 2021, Vol. 32


Electric energy produced from unstable and renewable energy can be stored and integrated into energy storage devices. For example, wind and solar energy can be converted into electric energy using wind turbines and solar cells, respectively. Therefore, it is necessary to develop reliable and efficient energy conversion and storage equipment [1-3]. Consecutive new electrochemical energy storage devices, such as supercapacitors, have attracted considerable attention due to various advantages [4-8]. Two-dimensional (2D) nanomaterials have been extensively investigated as electrochemical capacitors electrode materials. The layered structure is conducive to the transport and diffusion of electrolyte ions during charging-discharging. In particular, 2D materials can ensure a rapid and efficient redox reaction on the electrode surface, thus improving the rate performance and cycle stability of supercapacitors [9-12].
Transition metal oxides/hydroxides/sulfides are excellent electrode materials for supercapacitors. Currently, the most studied transition metal electrode materials are iron-based, cobalt-based, nickel-based, manganese-based, and vanadium-based electrode materials [13-20]. Among these materials, Fe micronutrient is an essential heavy metal for animals and plants. A large number of articles have indicated that Fe sitescan provide active centers. Fe-based electrode materials with several oxidation states or structures, rich resources, low cost, environmental friendliness, high potential windows, and good energy storage performance at both positive and negative electrodes are particularly promising supercapacitor electrode materials [21-29]. Fe-based electrode materials mainly include iron oxide [21, 22], ferric oxide [23, 24], hydroxy iron oxide [25, 26], ferric nitrate [27, 28] and ferric chloride [29].
Phosphate-based materials have been identified as potential electrode materials for supercapacitors. The flexible coordination of phosphate/pyrophosphate groups can resist the deformation due to any structural distortion by changing their local positions and stabilizing the intermediate state of the ions of the transition metal [30-34]. Some reports have also suggested that the phosphate framework can stabilize active sites in metal phosphates [35-37]. Fe-based phosphates with excellent physical and chemical featuresare mainly used in lithium-ion batteries, sodium ion batteries, and oxygen evolution catalyst, but less in supercapacitors, and still need a lot of research [38-40]. Different synthetic routes have been reported to synthesize Fe-based phosphate hydroxide or Fe-based phosphate. However, 2D Fe-based phosphate synthesis using the one-step method has received little attention.
In this study, Fe-based phosphate with different morphologies and compositions were successfully synthesizedusing the hydrothermal method. Influence factors such as the amount of sodium tartrate and solvent, reaction time, and reactant ratio on the chemical composition and morphology of the as-prepared materials were explored. To explore the influence of morphology and chemical composition on the electrochemical properties of the as-prepared electrode materials, the materials was characterized under the traditional three electrode system. Among them, sample F3 with the morphology of 2D nanosheets showed the best electrochemical performance. Then, sample F3 and activated carbon were used as electrode materials to construct a 2D Fe(PO3)3//AC supercapacitor to explore its performance in a two electrode system.
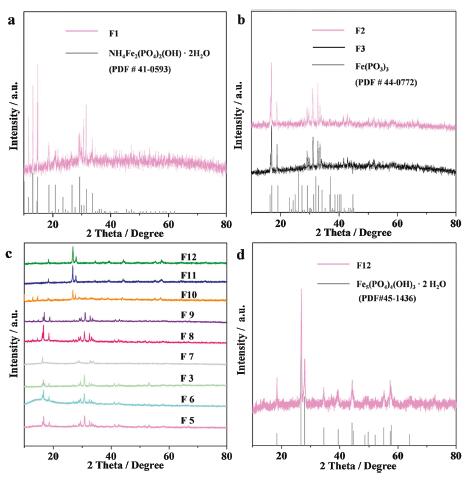
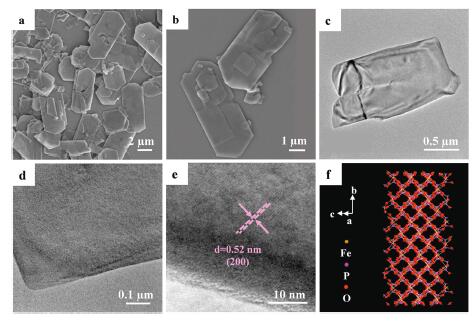
The detailed experimental conditions, preparation methods, and experimental part are shown in Table S1 (Supporting information). Sodium tartrate is used as the complexing agent, which releases more Fe3+ (ferric ion) in the reaction solution. It can also play a key role in the preparation of nanomaterials such as stabilizer and dispersant. Samples F1, F2 and F3 are the products obtained by adding 0 g, 0.05 g and 0.10 g of sodium tartrate into the reactant, respectively. Figs. 1a and b show the X-ray diffraction (XRD) diagrams of samples F1-F3. The XRD pattern of sample F1 corresponds to NH4Fe2(PO4)2(OH)·2H2O (PDF #41-0593), and the chemical composition of samples F2 and F3 is iron metaphosphate (Fe(PO3)3) (PDF #44-0772). This is because more ferric and phosphate ions participate in the reaction due to the addition of sodium tartrate. Fig. S1 (Supporting information) and Figs. 2a and b show the scanning electron microscope (SEM) images of samples F1, F2 and F3 at different magnifications, respectively. It can be seen from the SEM images that the morphology of sample F1 is agglomerated particles. With the addition of sodium tartrate, the morphology of sample F2 is 3D flower-like, composed of 2D nanosheets. When the amount of sodium tartrate is increased to 0.10 g, the morphology of sample F3 becomes 2D nanosheets, which shows that sodium tartrate releases Fe3+ ions uniformly in the reaction solution, and hence, the morphology of the crystal is controlled by sodium tartrate to some extent. The difference in the morphologies of samples F2 and F3 is due to the fact that a higher amount of sodium tartrate plays the role of complexing agent and dispersant in the preparation of sample F3.

|
Download:
|
| Fig. 1. (a) XRD pattern of sample F1. (b) XRD patterns of sample F2 and sample F3. (c) XRD patterns of sample F3, F5-F12. (d) XRD pattern of sample F12. | |

|
Download:
|
| Fig. 2. (a, b) SEM images of sample F3 at different magnification. (c, d) TEM images of sample F3 at different magnification. (e) HRTEM image of sample F3. (f) Schematic crystal structure super cells (2 × 2 × 2 slabs) drawn according to the data from inorganic crystal structure data (ICSD-88, 848). | |
The amount of solvent has a great influence on the reaction rate. Sample F4 was obtained by increasing the amount of solvent to 20 mL. When the amount of solvent is 10 mL, the concentration of the reactant increases, and the reaction is relatively violent. A large number of nucleated crystals are formed at the beginning of reaction, and these crystals further grow along the layered structure at a high temperature of 160 ℃. When the amount of solvent is increased to 20 mL, the concentration of the reactant decreases. At the beginning of the reaction, there are fewer nucleation crystals. As the reaction progresses, the crystals are easily adsorbed on the surface of the crystals formed at the beginning, and gradually grow forming a 3D flower structure resulting in the accumulation of 2D nanosheets. The SEM images of sample F4 are shown in Fig. S2 (Supporting information). To sum up, when the amount of sodium tartrate is 0.10 g, and the amount of solvent is 10 mL, 2D nanosheets with a uniform morphology can be obtained. Subsequently, the effect of the molar mass ratio of iron source to phosphorus source on the products can be explored under the experimental conditions.
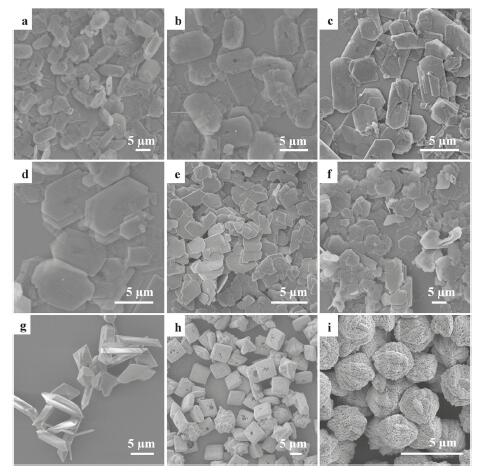
Samples F3 and F5-F12 were obtained with different ratios of iron source to phosphorus source in the reactant. It can be seen from the XRD and SEM images shown in Figs. 1c, d and 3 that when the mass of ferric sulfate is less thanor equal to 0.60 g (molar mass ratio of Fe3+ to PO43− is about 1:2), the chemical composition of the products is the same as that of sample F3, and the morphology is 2D nanosheets. When the mass of ferric sulfate is 0.90 g (molar mass ratio of Fe3+ to PO43− is about 3:4), sample F10 corresponds to the complexes of Fe5(PO4)4(OH)3·2H2O (PDF# 45-1436) and NH4Fe2(PO4)2(OH)·2H2O (PDF# 41-0593), and the morphology is composed of different bulk structures. This is due to the high concentration of ferric sulfate and reactant, which is suitable for the growth of the above-mentioned two crystals. When the mass of ferric sulfate is more than 1.20 g (molar mass ratio of Fe3+ to PO43− is greater than 1:1), the XRD peaks of samples F11 and F12 are the same as the standard card of Fe5(PO4)4(OH)3·2H2O (PDF #45-1436), and there are no other phases. Figs. 3h and i and Fig. S3 (Supporting information) show the SEM images of samples F11 and F12, which are regular 3D structures with hollow cube and carambola-like morphologies. This is due to the increase in Fe3+ ions involved in the reaction, resulting in the accumulation and growth of Fe5(PO4)4(OH)3·2H2O crystals.

|
Download:
|
| Fig. 3. SEM images of (a) sample F5, (b) sample F6, (c) sample F3 and (d-i) sample F7-12. | |
To sum up, when the mass of ammonium phosphate is 0.90 g (4.4 mmol), and the mass of ferric sulfate is less than 0.60 g (1.1 mmol), Fe(PO3)3 nanosheets can be obtained. The morphologies of samples F4, F5 and F6 are relatively disordered when the mass of ferric sulfate is 0.40 g, 0.50 g and 0.60 g, respectively. The morphology of sample F3 is the most uniform and narrow when the mass of ferric sulfate is 0.30 g. The survey X-ray photoelectron spectroscopy (XPS) spectra of sample F3 is shown in Fig. S4 (Supporting information), which show that the compound contains elements of Fe, P and O. Figs. S3b-d show the corresponding high-resolution spectra. The high-resolution XPS spectrum of Fe 2p3/2 can be deconvoluted into two spin-orbit doublets at the binding energies of 711.2 eV and 712.7 eV, and two satellites peaks at the binding energies of 715.7 eV and 719.7 eV, which can be ascribed to the Fe3+ ions state [41, 42]. The XPS peaks of P 2p3/2 and O 1s can be ascribed to P-O bonds [43, 44]. Combined with the XRD test results, the sample is further proved to be Fe(PO3)3.
Figs. 2c and d show the transmission electron microscope (TEM) images of sample F3 at different magnifications. It can be seen from the TEM images that the morphology of sample F3 is nanosheets, which is consistent with the SEM image. The nanosheet appears almost transparent under the TEM, indicating the thin thickness of the nanosheet, which is conducive to electron transport and transfer in redox reactions. As shown in Fig. 2e, the high-resolution transmission electron microscopy (HRTEM) image shows the lattice fringes with a lattice spacing of 0.52 nm, corresponding to the (200) plane of Fe(PO3)3. Fig. 2f shows the schematic crystal structure of sample F3 super cells (2 × 2 × 2 slabs), drawn according to the inorganic crystal structure data (ICSD-88848). The crystal with a regular pore structure is conducive to the charge transfer between theelectrolyte and electrode surface during the charging-discharging process.
In the traditional three electrode system, 2D Fe(PO3)3 electrodes (sample F3) were measured using the cyclic voltammetry (CV) and galvanostatic charge-discharge (GCD) methods. Fig. 4a shows the CV curves of 2D Fe(PO3)3 nanosheets at the scanning rates of 10 mV/s, 20 mV/s, 50 mV/s and 80 mV/s. It can be seen from the CV curves that the electrode has the characteristics of the Faraday pseudocapacitance. Fig. 4b shows the GCD curves of 2D Fe(PO3)3 electrode at current densities of 1.0, 2.0, 5.0 and 10.0 A/g. The GCD curves show that 2D Fe(PO3)3 has a high specific capacitance, but its charging time is slightly longer than the discharging time, indicating some irreversible electrochemical behaviors during the charging-discharging process. The platforms in each GCD curve exhibit a typical pseudocapacitance behavior. This is caused by either the charge transfer at the electrode material and electrolyte interface, or the electrochemical adsorption/desorption process. During this process, the continuous consumption of active substances on the electrode surface causes a constant change in the ion concentration on the electrode surface. At the same time, the concentration of redox reaction products continues to increase and diffuse to the electrolyte. Therefore, the redox reaction products appear concentration polarization between the electrolyte near the electrode surface and the bulk electrolyte, forming voltage platforms in the charging/discharging curves.

|
Download:
|
| Fig. 4. (a) Cyclic voltammetry curves of sample F3 electrode at different scan rates. (b) The galvanostatic charge-discharge curves of sample F3 electrode at different current densities. samples F3, F4, F10 and F12: (c) Cyclic voltammetry curves at a scan rate of 20 mV/s. (d) Galvanostatic charge-discharge curves at a current density of 1.0 A/g. | |
To explore the influence of chemical composition and morphology on the electrochemical properties, samples F3, F4, F10 and F12 with different chemical compositions or morphologies were selected for CV, GCD, and EIS tests. Cyclic voltammetry was carried out in the potential range of 0.0−0.5 V at a scanning rate of 20 mV/s. As shown in Fig. 4c, at the same scanning rate, the coverage area of the CV curve of sample F3 is greater than those of samples F4, F10 and F12. It can be seen from Fig. 4d that the discharging time of sample F3 is longer than those of samples F4, F10 and F12 at the same current density and discharge voltage window.
The specific capacitance (C) of 2D Fe(PO3)3 electrode can be calculated using the GCD curves, and the calculation formula is C= (i × Δt)/(m × ΔV). Here, i is the discharge current (A), Δt is the discharge time (s), m is the mass of 2D Fe(PO3)3 loaded in the working electrode (g), and ΔV is the value of the discharging voltage window (V). Fig. S5a (Supporting information) shows the specific capacitance of each sample calculated using the GCD curves at different current densities. The specific capacitances of samples F3, F4, F10 and F12 are 392.5, 345.3, 278.4 and 245.8 F/g, respectively, at a current density of 1.0 A/g. For sample F3, the specific capacitances are 392.5, 352.0, 323.4 and 286.7 F/g at current densities of 1.0, 2.0, 5.0 and 10.0 A/g, respectively. High mass specific capacitance has great potential for the application in high-power electrical appliances. During the charging/discharging process, OH− in electrolyte needs enough time to insert/extract/leave the electrode material surface. When the current density is low, the hydroxide group has enough time to transfer, indicating that more charge can be stored and a higher specific capacitance can be obtained at a low current density. According to the EIS diagram in Fig. S5b (Supporting information), the charge transfer resistance of sample F3 is the smallest.
The process of double layer capacitance and pseudocapacitance occurs on or near the surface of electrode material, therefore, the morphology and specific surface area of electrode materials are very important. Sample F3 with 2D morphology can realize rapid charge transfer and diffusion during the charging-discharging process, which can ensure a rapid and efficient redox reaction on the electrode surface. However, the specific surface area of samples F10-F12 with 3D morphology is greatly reduced, which leads to the inadequate pseudocapacitance reaction on the electrode surface. At the same time, the chemical composition also has a significant effect on the electrochemical performance. There may be more irreversible electrochemical behaviors in the redox process of Fe5(PO4)4(OH)3·2H2O and NH4Fe2(PO4)2(OH)·2H2O electrodes. To sum up, sample F3 has the best electrochemical energy storage performance among samples F1-F12 due to different structures and chemical compositions that result in different electrochemical properties.
Due to the limitation of the inherent electrochemical properties of the material, the working potential window of 2D Fe(PO3)3 is very small. To achieve high potential window, energy and power density, an asymmetric supercapacitor was successfully constructed with 2D Fe(PO3)3 nanosheets as positive material, active carbon (AC) as negative material, and 3.0 mol/L of KOH solution as electrolyte. The relationship of charge balance, q+ = q– (q = m × C × ΔV), should be followed between the two electrodes. The mass ratio of the positive and negative electrode materials should be m+ / m– = (C– × ΔV–) / (C+ × ΔV+) = (200×1)/(392.5×0.5) ≈ 1, in which the specific capacitance and potential window of the positive electrode material are measured in the above-mentioned three electrode system. Further, the specific capacitance and potential window of the negative electrode are the electrochemical parameters of the purchased commercial activated carbon.
It can be observed from Fig. 5a that when the potential window of Fe(PO3)3//AC supercapacitor is gradually expanded from 1.2 V to 1.6 V, the coverage area of CV curve is gradually increased. The CV curves show that the redox reaction is complete and stable at the voltage range of 0–1.5 V.Fig. 5b shows the CV curves of the supercapacitor at the scan rate range of 10−100 mV/s in the voltage window of 0–1.5 V.Fig. 5c shows the GCD curves of the Fe(PO3)3//AC asymmetric supercapacitor with the current densities of 0.50, 1.0, 1.25 and 2.5 A/g. The shape of GCD curves was not very symmetric, which indicates there were some irreversible electrochemical behaviors in charge-discharge process. The potential platform in every discharge curve is the typical pseudocapacitance behavior of transition metal compounds, which caused by electrochemical absorption/desorption process or a charge transfer reaction at the electrode-electrolyte interface. According to the GCD curves, the specific capacitances at different current densities of the asymmetric supercapacitor are calculated. Fig. 5d shows that the specific capacitances of the supercapacitor are 126.6, 113.4, 111.0 and 94.5 F/g at the current densities of 0.50, 1.0, 1.25 and 2.5 A/g, respectively. Compared to the specific capacitance of the supercapacitors constructed with other Fe-based compound and activated carbon as electrode materials, the specific capacitance of the Fe(PO3)3//AC supercapacitor is relatively high. Fig. 5e shows the cycle performance at the current density of 0.5 A/g. After 3000 cycles of galvanostatic charging-discharging, the specific capacitance retention rate of the Fe(PO3)3//AC supercapacitor is 89.9%, which proves that it has a good cycle stability.

|
Download:
|
| Fig. 5. Electrochemical characterization of the Fe(PO3)3//AC aqueous device: (a) Cyclic voltammetry curves with different voltage window. (b) Cyclic voltammetry curves with scan rate from 10 mV/s to 100 mV/s. (c) The galvanostatic charging-discharging curves with different current densities (0.50-2.50 A/g). (d) Specific capacitances at the current density of 0.50-2.50 A/g. (e) Charge-discharge cycling test at a current density of 0.5 A/g. (f) Power density-energy density diagram. | |
The Ragone diagram of the Fe(PO3)3//AC supercapacitor is shown in Fig. 5f. The energy density of the Fe(PO3)3//AC supercapacitor is 30.9 Wh/kg at the power density of 0.70 kW/kg. When the power density increases to 1.70 kW/kg, the energy density is still high at the value of 25.7 Wh/kg. These excellent electrochemical performances exhibit that the 2D Fe(PO3)3 is an excellent Fe-based electrode material for supercapacitors.
In this study, 2D Fe(PO3)3 was successfully prepared. In addition, the effects of the amount of sodium tartrate and solvent, and the molar mass ratio of iron to phosphorus sources on the chemical composition and morphology of the products were investigated. It was found that the morphology of sample F3 was uniform, which was due to the complexation and dispersion of sodium tartrate in the reactant, and the appropriate amount of solvent and Fe/P ratio. When the molar mass ratio of Fe3+ to PO43− was high, it was easy to generate 3D materials. The energy storage performance of electrode materials with different morphologies and compositions were characterized under the traditional three electrode system. Among these electrode materials, sample F3 showed better electrochemical performance than 3D Fe-based phosphate. The superiority of 2D Fe(PO3)3 to other bulk Fe(PO3)3 can be attributed to the nanosheet structure and smaller charge-transport resistance. Sample F3 and activated carbon were used as electrode materials to construct the 2D Fe(PO3)3//AC supercapacitor. The supercapacitor showed an excellent cycling stability (after 3000 cycles of galvanostatic charging-discharging, the capacitor retention rate was 89.9%), high energy density, and high power density (the energy density is 30.9 Wh/kg at the power density of 0.70 kW/kg). The aforementioned excellent performance demonstrates that 2D Fe(PO3)3 is a promising electrode material for supercapacitors.
Declaration of competing interestThe authors declare that they have no known competing financial interests or personal relationships that could have appeared to influence the work reported in this paper.
AcknowledgmentsThis work was supported by the National Natural Science Foundation of China (NSFC, Nos. 21673203, 21671170, U1904215), Natural Science Foundation of Jiangsu Province (No. BK20190870), the Top-notch Academic Programs Project of Jiangsu Higher Education Institutions (TAPP) and Post graduate Research & Practice Innovation Program of Jiangsu Province (No. XKYCX17-032). Program for Young Changjiang Scholars of the Ministry of Education, China. We also acknowledge the Priority Academic Program Development of Jiangsu Higher Education Institutions, and the technical support we received at the Testing Center of Yangzhou University.
Appendix A. Supplementary dataSupplementary material related to this article can be found, in the online version, at doi:https://doi.org/10.1016/j.cclet.2020.07.004.
| [1] |
W. Zhou, S. Lv, X.L. Liu, Chem. Commun. 55 (2019) 11207-11210. DOI:10.1039/C9CC06048K |
| [2] |
B.W. Lin, X.H. Zhu, L.Z. Fang, Adv. Mater. 31 (2019) 1900060. |
| [3] |
L. Xue, Q.H. Zhang, X.H. Zhu, et al., Nano Energy 56 (2019) 463-472. DOI:10.1016/j.nanoen.2018.11.085 |
| [4] |
Y. Li, Y.Y. Shan, H. Pang, Chin. Chem. Lett. 31 (2020) 2280-2286. DOI:10.1016/j.cclet.2020.03.027 |
| [5] |
B. Li, M.B. Zheng, H.G. Xue, et al., Inorg. Chem. Front. 3 (2016) 175-202. DOI:10.1039/C5QI00187K |
| [6] |
H.Y. Duan, T. Wang, X.Y. Wu, et al., Chin. Chem. Lett. 31 (2020) 2330-2332. DOI:10.1016/j.cclet.2020.06.001 |
| [7] |
X.L. Xu, W.H. Shi, P. Li, Chem. Mater. 29 (2017) 6058-6065. DOI:10.1021/acs.chemmater.7b01947 |
| [8] |
Y.Q. Jiang, C. Zhou, J.P. Liu, Energy Storage Mater. 11 (2018) 75-82. DOI:10.1016/j.ensm.2017.09.013 |
| [9] |
X. Huang, C.L. Tan, Z.Y. Yin, et al., Adv. Mater. 26 (2014) 2185. DOI:10.1002/adma.201304964 |
| [10] |
X. Huang, Z.Y. Zeng, H. Zhang, Chem. Soc. Rev. 42 (2013) 1934. DOI:10.1039/c2cs35387c |
| [11] |
X.L. Xu, W.H. Shi, W.X. Liu, J. Mater. Chem. A 6 (2018) 24086-24091. DOI:10.1039/C8TA06412A |
| [12] |
B. Li, P. Gu, Y.C. Feng, et al., Adv. Funct. Mater. 27 (2017) 1605784. DOI:10.1002/adfm.201605784 |
| [13] |
H.Y. Liang, J.H. Lin, H. Jia, et al., J. Power Sources 378 (2018) 248-254. DOI:10.1016/j.jpowsour.2017.12.046 |
| [14] |
S.J. Hou, X.T. Xu, M. Wang, et al., J. Mater. Chem. A 5 (2017) 19054. DOI:10.1039/C7TA04720G |
| [15] |
N.N. Zhang, X. Xiao, H. Pang, Nanoscale Horiz. 4 (2019) 99-116. DOI:10.1039/C8NH00144H |
| [16] |
Y. Yan, Y.Q. Luo, J.Y. Ma, et al., Small 14 (2018) 1801815. DOI:10.1002/smll.201801815 |
| [17] |
C. Feng, J.F. Zhang, Y. He, et al., ACS Nano 9 (2015) 1730-1739. DOI:10.1021/nn506548d |
| [18] |
Y.H. Dai, L.B. Kong, K. Yan, et al., Ionics 22 (2016) 1461-1469. DOI:10.1007/s11581-016-1652-y |
| [19] |
N. Liu, Y.L. Su, Z.Q. Wang, et al., ACS Nano 11 (2017) 7879-7888. DOI:10.1021/acsnano.7b02344 |
| [20] |
Y. Li, Y.X. Xu, Y. Liu, et al., Small 15 (2019) 1902463. DOI:10.1002/smll.201902463 |
| [21] |
W.W. Liu, M.H. Zhu, J.H. Liu, X. Li, J. Liu, Chin. Chem. Lett. 30 (2019) 750-756. DOI:10.1016/j.cclet.2018.09.013 |
| [22] |
H.F. Liang, C. Xia, A.H. Emwas, et al., Nano Energy 49 (2018) 155-162. DOI:10.1016/j.nanoen.2018.04.032 |
| [23] |
L. Wang, H.M. Ji, S.S. Wang, et al., Nanoscale 5 (2013) 3793. DOI:10.1039/c3nr00256j |
| [24] |
X.C. Li, L. Zhang, G.H. He, Carbon 99 (2016) 514-522. DOI:10.1016/j.carbon.2015.12.076 |
| [25] |
J.Q. Liu, M.B. Zheng, X.Q. Shi, et al., Adv. Funct. Mater. 26 (2016) 919-930. DOI:10.1002/adfm.201504019 |
| [26] |
C. Shen, R.Z. Li, L.J. Yan, et al., Ionics 25 (2019) 2769-2779. DOI:10.1007/s11581-018-2739-4 |
| [27] |
X. Chen, K.F. Chen, H. Wang, et al., Electrochim. Acta 147 (2014) 216-224. DOI:10.1016/j.electacta.2014.08.132 |
| [28] |
X. Chen, K.F. Chen, H. Wang, et al., J. Colloid Interf. Sci. 444 (2015) 49-57. DOI:10.1016/j.jcis.2014.12.026 |
| [29] |
H. Xu, J.X. Wu, C.L. Li, et al., Electrochim. Acta 165 (2015) 14-21. DOI:10.1016/j.electacta.2015.01.224 |
| [30] |
C.X. Zhang, H.X. Liu, J. He, et al., Chem. Commun. 55 (2019) 10511-10514. DOI:10.1039/C9CC04481G |
| [31] |
P.P. Sun, Z.H. Li, L. Zhang, et al., J. Alloys. Compd. 750 (2018) 607-616. DOI:10.1016/j.jallcom.2018.04.024 |
| [32] |
X.R. Li, X. Xiao, Q. Li, et al., Inorg. Chem. Front. 5 (2018) 11-28. DOI:10.1039/C7QI00434F |
| [33] |
Y.X. Chang, N.E. Shi, S.L. Zhao, et al., ACS Appl. Mater. Interfaces 8 (2016) 22534-22544. DOI:10.1021/acsami.6b07209 |
| [34] |
X.Y. Qin, B.Y. Yan, J. Yu, et al., Inorg. Chem. Front. 4 (2017) 1424-1444. DOI:10.1039/C7QI00184C |
| [35] |
J.H. Zhao, Y.J. Zhang, Z. Run, et al., Chem. Open. 4 (2015) 274-277. |
| [36] |
Y.F. Zhao, Z.Y. Chen, D.B. Xiong, et al., Sci. Rep. 6 (2016) 17613. DOI:10.1038/srep17613 |
| [37] |
D. Li, C.S. Pan, R. Shi, et al., CrystEngComm. 13 (2011) 6688-6693. DOI:10.1039/c1ce05483j |
| [38] |
C.Q. Min, X.Q. Ou, Z.X. Shi, et al., Ionics 24 (2018) 1285-1292. DOI:10.1007/s11581-017-2287-3 |
| [39] |
T.C. Liu, Y.D. Duan, G.X. Zhang, et al., J. Mater. Chem. A 4 (2016) 4479-4484. DOI:10.1039/C6TA00454G |
| [40] |
D.Z. Zhong, L. Liu, D.D. Li, et al., J. Mater. Chem. A 5 (2017) 18627-18633. DOI:10.1039/C7TA05580C |
| [41] |
X.J. Wei, Y.H. Li, H.R. Peng, et al., Chem. Eng. J. 355 (2019) 336-340. DOI:10.1016/j.cej.2018.08.009 |
| [42] |
A.K. Singha, K. Mandal, J. Appl. Phys. 117 (2015) 105101. DOI:10.1063/1.4913218 |
| [43] |
Y. Zhao, Y. Xie, S. Yan, et al., Chem. Mater. 20 (2008) 3959-3964. DOI:10.1021/cm8002468 |
| [44] |
L. Yang, Z.L. Guo, J. Huang, Adv. Mater. 29 (2017) 1704574. DOI:10.1002/adma.201704574 |