 2021, Vol. 32


b Jinan Guokeyigong Science and Technology Development Co., Ltd., Ji'nan 250103, China
Circulating tumor DNA (ctDNA) is a subset of cell-free DNA (cfDNA), which is a type of gene fragments originated from tumors [1, 2]. Since ctDNA released to peripheral blood carries tumor specific sequence alterations [3], it has been demonstrated to be a promising biomarker for liquid biopsy over other traditional invasive targets [4]. In addition, the result of ctDNA assay is much accurate with short half-life in blood, which is able to reflect real-time conditions [5]. ctDNA level in biological samples is usually pico-to-fetomolar level, thus the development of sensitive and selective methods is quite important [6]. Currently, common methods for ctDNA assay usually rely on modern techniques like digital droplet PCR, next-generation sequencing and so on. However, they may require complicated instruments and time consuming procedures, which are not suitable for daily clinical use [7, 8].
DNA nanotechnology offers promising routes to construct various DNA nanostructures for nanofabrication, biosensing, drug delivery and many other biomedical applications [9-12]. DNA nanostructures can be constructed in a predictable manner by Watson-Crick base pair interactions. Especially, three-dimensional (3D) DNA nanostructures may provide multiple functional sites for recognition, amplification or signaling purposes. DNA triangular prism (TP) is a typical 3D DNA nanoarchitecture with geometrical rigid structure, which shows unique advantages in different applications [13]. For example, Tan's group reported a DNA TP based logic gate nanomachine for computing on target cell surfaces [14].
In this contribution, a novel ctDNA sensing strategy is fabricated. We have firstly designed five DNA strands to construct DNA TP, which is then designed as the three-dimensional scaffold for target ctDNA recognition and signal generation. Four thiol groups are separately modified at the end of the four fuel strands of TP. After self-assembly, the rectangle bottom of DNA TP contains four "anchors", which facilitate firm immobilization of TP nanostructure on gold electrode surface via gold-sulfur chemistry. This three-dimensional DNA scaffold is also superior to linear DNA with improved molecular recognition efficiency [15-17]. The top edge of TP reserves single-stranded region for the formation of DNA three way junction after target ctDNA initiated cycles of strand displacement reactions, which is a convenient isothermal amplification procedure. The formed DNA nanostructures contribute to much intense electrochemical responses which can be used to indicate target ctDNA level. Detailed working principle is illustrated in Scheme 1. Generally, template DNA is designed with the complementary sequence of ctDNA and partial duplex is formed by hybridization. ctDNA can thus be extended by polymerase to achieve the complete duplex. In addition, since it contains the restriction site of nicking endonuclease, a nick can be created. With further polymerization reaction, TWJ1 strand can be displaced. After cycles of strand displacement reaction, a large number of TWJ1 sequences are produced. On the other hand, DNA TP is assembled with four thoils on the bottom surface for immobilization on electrode and single-stranded edge on top for three-way junction formation. Another two essential strands are the displaced TWJ1 by ctDNA and TWJ2, which is labeled with ferrocene (Fc) as the electrochemical probe. By the hybridization of corresponding parts of the three DNA sequences, stable junction structure can be fabricated and Fc is localized near the electrode surface to generate electrochemical response. By studying the intensity of Fc signal, initial ctDNA level can be evaluated. In real clinical applications, ctDNAs may have various lengths and possible 3′ protruding termini may inhibit extension reaction. One possible solution is the employment of exonuclease I, which digests single-stranded DNA from 3′ to 5′.

|
Download:
|
| Scheme1. Illustration of the DNA triangular prism and three-way junction nanostructures based ctDNA biosensor. | |
To characterize the formation of DNA nanostructures including TP and three-way junction nanostructures, polyacrylamide gel electrophoresis (PAGE) experiments are applied to identify the molecule weights of corresponding reaction products. We have mixed different combinations of the elements of DNA nanostructures. As shown in Fig. 1A, more strands help the formation of more complete DNA TP structure and the corresponding bands are localized at higher positions with larger molecule weights. The bands with smaller molecular weights (lanes c–e) are ascribed to small fractions of unreacted DNA sequences TP3, TWJ1 or TWJ2 (Table S1 in Supporting information). The successful strand displacement reaction can also be validated by PAGE. After the hybridization of ctDNA and template, the duplex with larger molecule weight is formed and the band is clearly shown in the gel. The further introduction of polymerase and nicking endonuclease can help the formation of complete double-stranded DNA and abundant displaced TWJ1 strands, the bands of which appear correspondingly. However, since random DNA does not contain complementary sequence with template, partial duplex cannot be formed. As a result, no strand displacement reaction products can be observed in the gel (Fig. 1B).

|
Download:
|
| Fig. 1. (A) Polyacrylamide gel electrophoresis analysis of (a) TP1, (b) TP1 and TP2, (c) TP1, TP2 and TP3, (d) TP1, TP2, TP3, TP4 and TP5, (e) TP1, TP2, TP3, TP4, TP5, TWJ1 and TWJ2. (B) Polyacrylamide gel electrophoresis analysis of (a) ctDNA, (b) template, (c) ctDNA and template, (d) TWJ1, (e) ctDNA and template after strand displacement reaction, (f) random DNA and template after strand displacement reaction. | |
Aiming to verify the feasibility of the electrochemical biosensor, electrochemical impedance spectroscopy (EIS) and square wave voltammetry (SWV) are carried out to identify the step-wise electrochemical properties. As shown in Fig. 2A, a straight line is observed in the nyquist plot for bare electrode, which reflects excellent electrical conductivity of the gold electrode interface. After modified with DNA TP, due to the repellant between negatively charged DNA scaffold and electrochemical species, a semicircle domain appears, the diameter of which is the reflection of the charge transfer resistance. With the incubation of TWJ2, three-way junction nanostructures are not formed in the absence of TWJ1. The slightly increased diameter of semicircle domain is due to non-specific adsorption. However, target ctDNA triggers strand displacement reaction, generating a larger amount of TWJ1 strands. DNA three-way junction can thus be formed. Due to the increase of electronegativity caused by the two additional DNA strands, charge transfer resistance is increased and the semicircle domain of nyquist plot is enlarged significantly. We have then recorded SWV after these reaction steps. Only after the formation of three-way junction, the Fc labeled at the end of TWJ2 can be located near the electrode surface, which contributes to the remarkable current peak (Fig. 2B). EIS and SWV results have well confirmed the feasibility of this electrochemical strategy.

|
Download:
|
| Fig. 2. (A) Nyquist plots and (B) square wave voltamograms corresponding to bare electrode, TP modified electrode in the absence and presence of TWJ2, TP modified electrode incubated with product of target (100 fmol/L) induced strand displacement reaction and TWJ2. | |
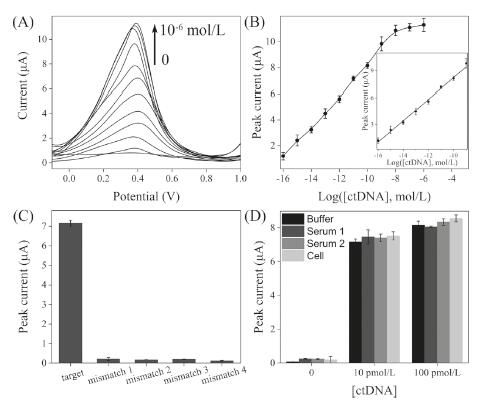
As mentioned above, the diameter of semicircle domain of nyquist plot is the reflection of charge transfer resistance. We have thereby studied the relationships between this parameter and the concentrations of DNA TP and TWJ2 (Fig. S1 in Supporting information). 1 μmol/L of DNA TP and 0.2 μmol/L of TWJ2 are used as optimized concentrations for subsequent quantitative experiments. The amount of TWJ1 is another critical element for the generation of electrochemical signal. With the increase of reaction time of Klenow fragment polymerase and Nb.BbvCI, more TWJ1 strands are supposed to be produced and displaced in the solution. Therefore, more three-way junctions are formed to localize electrochemical species. After the reaction time reaches 60 min, the SWV peak current tends to be saturation (Fig. S2 in Supporting information). Therefore, the time of 60min is selected for the following experiments. Under these optimized conditions, we have then recorded the square wave voltamograms in the presence of ctDNA of a series of concentrations. As shown in Fig. 3A, with the increase of ctDNA level, the current peak grows gradually. The detailed relationship between logarithmic ctDNA concentration and peak intensity is depicted in Fig. 3B. A linear range is established from 100 amol/L to 1 nmol/L. The equation is as follows:

|
Download:
|
| Fig. 3. (A) Square wave voltamograms for the detection of ctDNA with the concentrations of 0, 10−16, 10-15, 10-14, 10-13, 10-12, 10-11, 10-10, 10-9, 10-8, 10-7, 10-6 mol/L (from bottom to top). (B) Calibration curve showing the relationship between the peak current and logarithmic ctDNA concentration. Inset shows the linear range. (C) Selectivity investigation of electrochemical biosensor for ctDNA detection. (D) Comparison of the biosensor performances in buffer, serum and cell conditions. | |

|
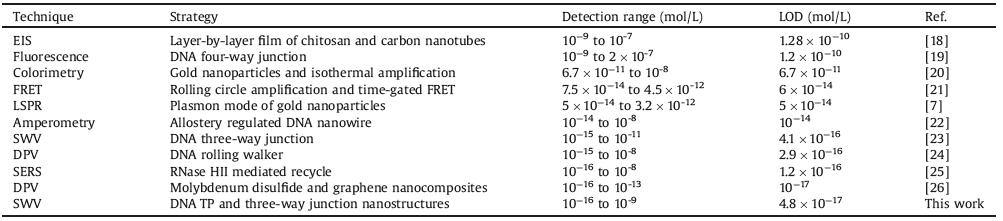
in which y is the peak current and x represents the logarithmic ctDNA concentration. The limit of detection is calculated to be 48 amol/L. We have then compared the analytical performances of this method with those of some recently developed biosensors. As list in Table 1 [7, 18-26], this work shows distinct superiority in sensitivity and detection range. We have also performed more experiments to confirm the high stability of this biosensor. The electrodes modified with DNA TP are firstly stored in 10 mmol/L Tris−HCl buffer (10 mmol/L TCEP, pH 8.0) at 4 ℃ for three weeks. Then, the electrodes are used to detect target ctDNA. The recorded electrochemical responses are over 93% of original values, confirming good stability of this electrochemical system.
|
|
Table 1 Comparison of analytical performances of this method with previously developed assays. |
For real sample analysis, target ctDNA may present in a large background of normal DNA fragments. Therefore, we have then firstly studied the selectivity of this ctDNA biosensor by introducing several mismatched DNA sequences. As shown in Fig. 3C, in the presence of the four mismatched sequences, the obtained SWV peak currents are negligible compared with that of target ctDNA sequence. This result demonstrates that only target ctDNA can be used to help produce TWJ1, which is required for the generation of DNA three-way junction. The highly stable three-dimensional DNA nanostructure may be beneficial to the application in complicated real sample analysis. We have further validated this ctDNA assay in biological samples directly. Different amount of ctDNA are spiked with standard buffer, serum and cell samples, which are then measured by the proposed method. The obtained SWV peak currents are recorded and compared in Fig. 3D. The trends of serum and cell tests with the increase of ctDNA concentration are similar to that of buffer condition. The absolute values are also in good accordance, demonstrating that this method is quite effective for practical utility.
In summary, we have successfully developed an ultrasensitive biosensor for ctDNA based on the engineering of DNA nanostructures. DNA TP is firstly formed and immobilized on the surface of electrode, which provides stable scaffold for effective reaction. With ctDNA triggered strand displacement amplification, abundant essential DNA strands can be generated, which aid the formation of three-way junction on the upright edge of DNA TP. This strategy simplifies the design and ctDNA can be indicated by the electrochemical responses with ultrahigh sensitivity. It can also distinguish target from potential interfering sequences. The proposed biosensor shows great promise for advanced liquid biopsy applications in the future.
Declaration of competing interestThe authors declare that they have no known competing financial interests or personal relationships that could have appeared to influence the work reported in this paper.
AcknowledgmentsThis work is supported by the Science and Technology Cooperation Project between the Chinese and Australian Governments (No. 2017YFE0132300), the Science and Technology Program of Suzhou (No. SYG201909) and the Collaborative Innovation Program of Jinan (No. 2018GXRC033).
Appendix A. Supplementary dataSupplementary material related to this article can be found, in the online version, at doi:https://doi.org/10.1016/j.cclet.2020.06.030.
| [1] |
J.J. Chabon, E.G. Hamilton, D.M. Kurtz, et al., Nature 580 (2020) 245-251. DOI:10.1038/s41586-020-2140-0 |
| [2] |
P. Razavi, B.T. Li, D.N. Brown, et al., Nat. Med. 25 (2019) 1928-1937. DOI:10.1038/s41591-019-0652-7 |
| [3] |
G.D. Cresswell, D. Nichol, I. Spiteri, et al., Nat. Commun. 11 (2020) 1446. DOI:10.1038/s41467-020-15047-9 |
| [4] |
A.M. Newman, S.V. Bratman, J. To, et al., Nat. Med. 20 (2014) 548-554. DOI:10.1038/nm.3519 |
| [5] |
L. Gorgannezhad, M. Umer, M.N. Islam, N.T. Nguyen, M.J.A. Shiddiky, Lab Chip 18 (2018) 1174-1196. DOI:10.1039/C8LC00100F |
| [6] |
H. Schwarzenbach, D.S.B. Hoon, K. Pantel, Nat. Rev. Cancer 11 (2011) 426-437. DOI:10.1038/nrc3066 |
| [7] |
A.H. Nguyen, S.J. Sim, Biosens. Bioelectron. 67 (2015) 443-449. DOI:10.1016/j.bios.2014.09.003 |
| [8] |
X. Li, M. Ye, W. Zhang, et al., Biosens. Bioelectron. 126 (2019) 596-607. DOI:10.1016/j.bios.2018.11.037 |
| [9] |
L.N. Green, H.K.K. Subramanian, V. Mardanlou, et al., Nat. Chem. 11 (2019) 510-520. DOI:10.1038/s41557-019-0251-8 |
| [10] |
X.Y. Ma, P. Miao, J. Mater. Chem. B Mater. Biol. Med. 7 (2019) 2608-2612. DOI:10.1039/C9TB00274J |
| [11] |
J. Pan, T.G. Cha, F. Li, et al., Sci. Adv. 3 (2017) e1601600. DOI:10.1126/sciadv.1601600 |
| [12] |
Q.Y. Lin, J.A. Mason, Z. Li, et al., Science 359 (2018) 669-672. DOI:10.1126/science.aaq0591 |
| [13] |
J.W. Conway, C. Madwar, T.G. Edwardson, et al., J. Am. Chem. Soc. 136 (2014) 12987-12997. DOI:10.1021/ja506095n |
| [14] |
R. Peng, X. Zheng, Y. Lyu, et al., J. Am. Chem. Soc. 140 (2018) 9793-9796. DOI:10.1021/jacs.8b04319 |
| [15] |
D. Zhu, H. Pei, G. Yao, et al., Adv. Mater. 28 (2016) 6860-6865. DOI:10.1002/adma.201506407 |
| [16] |
A.V. Pinheiro, D. Han, W.M. Shih, H. Yan, Nat. Nanotechnol. 6 (2011) 763-772. DOI:10.1038/nnano.2011.187 |
| [17] |
C.K. McLaughlin, G.D. Hamblin, K.D. Hänni, et al., J. Am. Chem. Soc. 134 (2012) 4280-4286. DOI:10.1021/ja210313p |
| [18] |
J.C. Soares, A.C. Soares, V.C. Rodrigues, et al., ACS Appl. Mater. Interfaces 11 (2019) 46645-46650. DOI:10.1021/acsami.9b19180 |
| [19] |
G. Liu, X. Ma, Y. Tang, P. Miao, Analyst 145 (2020) 1174-1178. DOI:10.1039/D0AN00044B |
| [20] |
Y. Wang, S.L. Kong, X.D. Su, RSC Adv. 10 (2020) 1476-1483. DOI:10.1039/C9RA09029K |
| [21] |
M. Dekaliuk, X. Qiu, F. Troalen, P. Busson, N. Hildebrandt, ACS Sens. 4 (2019) 2786-2793. DOI:10.1021/acssensors.9b01420 |
| [22] |
X. Lu, L. Wang, Q. Chen, et al., Chem. Commun. (Camb.) 56 (2020) 4184-4187. DOI:10.1039/D0CC01560A |
| [23] |
X. Chen, Y. Tang, R. Yan, P. Miao, ChemElectroChem 7 (2020) 64-68. DOI:10.1002/celc.201901657 |
| [24] |
D. Li, Y. Xu, L. Fan, et al., Biosens. Bioelectron. 148 (2020) 111826. DOI:10.1016/j.bios.2019.111826 |
| [25] |
J. Zhang, Y. Dong, W. Zhu, et al., ACS Appl. Mater. Interfaces 11 (2019) 18145-18152. DOI:10.1021/acsami.9b02953 |
| [26] |
Y. Chu, B. Cai, Y. Ma, et al., RSC Adv. 6 (2016) 22673-22678. DOI:10.1039/C5RA27625J |