 2021, Vol. 32


b Institute of Reproductive Health, Tongji Medical College, Huazhong University of Science and Technology, Wuhan 430030, China;
c Department of Obstetrics and Gynaecology, Union Hospital, Tongji Medical College, Huazhong University of Science and Technology, Wuhan 430022, China
Gene point mutations have been proven to be biomarkers for numerous cancers [1, 2]. The detection of low-abundance mutations will provide great help in precision medicine for cancer patients [3-5]. In recent years, much effort has been made to develop novel low-abundance mutation detection methods, including selective PCR [6, 7, 8], novel sequencing [9, 10] and DNA probe hybridization methods [11, 12]. Among these methods, DNA probe hybridization has distinct advantages over others for its simple operation, short reaction time and low instrument requirements [11]. In the DNA probe hybridization method, a single-stranded DNA (ssDNA) probe is usually designed to hybridize with the mutant-type target strand (MT) or the wild-type target strand (WT) and form the double-stranded DNA (dsDNA) structure. The discrimination factor (DF), which is the ratio of the MT signal to the WT signal, is often used to evaluate the selectivity of the method. As MT and WT only have the single-base difference, DF of the method with simple probe design is very poor (DF < 10) [13].
To improve the selectivity of the DNA probe hybridization method, researchers provided two strategies. One is to construct complex DNA structures to hybridize with the target strand. With the complex structures, the DNA toehold exchange [14, 15], DNA migration [16, 17], or DNA competition [18] could occur to enlarge the selectivity. The limit of detection (LOD) could reach around 0.1% (the ratio of MT in the MT and WT mixture). The other strategy is to introduce enzymes into the reaction system. As the enzyme itself could selectively digest the substrate with or without mismatch, the selectivity could be improved, and the LOD for mutation detection could reach 1% to 0.003% [19-23]. However, the DNA probe in both of two strategies should be optimized to show the best performance. As the probe is usually labelled with the expensive fluorophore and quencher, its optimization process significantly increases the cost of the method. In recent years, several works have provided the optimization rules for the first strategy (with complex DNA structures) to lower the cost [18, 24]. However, these rules could not be applied to the second strategy (with enzymes). Because the behaviour of the enzyme is relatively hard to be calculated and different sequences may cause additional interference to the enzyme compared with the DNA structure.
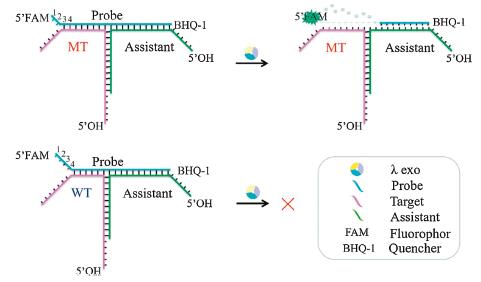
Herein, we proposed a DNA three-way junction (TWJ) structure into a mutation detection method with the second strategy which uses lambda exonuclease (λ exo) to enhance the selectivity (Fig. 1). In our previous work, we found that λ exo could recognize different DNA terminal structure with high selectivity [25]. The probe was designed to hybridize with MT and form dsDNA with a two-nucleotide (2-nt) overhang structure at the 5′ end. As the WT has one more mismatch with the probe, it could not form the 2-nt overhang structure [26]. In this work, an assistant strand was introduced into the previous dsDNA structure system, and it could form the TWJ structure with the target and probe. Thus, we could optimize the assistant, which has no expensive labels, instead of the probe to get better DF. In this way, the cost of optimization could be dramatically reduced. As shown in Fig. 1, the assistant (green) matches with a part of the probe (blue) and a part of the target (purple). The probe, target and assistant form TWJ structure, which is marked as probe/target/assistant. The probe contains 5′-FAM and 3′-BHQ-1 labels (see more information about FAM and BHQ-1 in Fig. S1 in Supporting information), and the fluorescence signal is quenched through fluorescence resonance energy transfer (FRET) when the probe is intact. As in the dsDNA structure system mentioned above, the probe and MT form the 2-nt overhang structure at the 5′-FAM end. This structure can be easily digested by λ exo, thereby releasing the FAM group to generate a fluorescent signal. Then the excess of the free probe in the solution can continue to combine with the target and assistant to form the TWJ structure. Again, the probe can be recognized and digested by λ exo, giving out a signal amplification. Meanwhile, the probe and WT cannot form such a 2-nt overhang structure because of one more mismatch in probe/WT than in probe/MT (the fourth position from the 5′ end of the probe, red in Fig. 1). Thus, it is challenging for λ exo to digest the probe in probe/WT/assistant, resulting in a weak fluorescent signal. It's worth mentioning that the target/assistant and probe/assistant dsDNA are designed to contain protruding 5′-OH ends to prevent λ exo from destroying the TWJ structure by digesting from these 5′ ends (Fig. 1).

|
Download:
|
| Fig. 1. Schematic depiction of the interactions between λ exo and TWJ structure with MT or WT. | |
As a proof of concept, we randomly designed MT and WT and tried to discriminate the T: A base pair in probe/MT from the T: G mismatch in probe/WT. The sequences are shown in Table S1 (Supporting information), in which P1 is for the probe and T1 to T10 are for the targets. As T: G is considered as one of the most stable mismatches, this pair of MT and WT is the most difficult one to be discriminated.
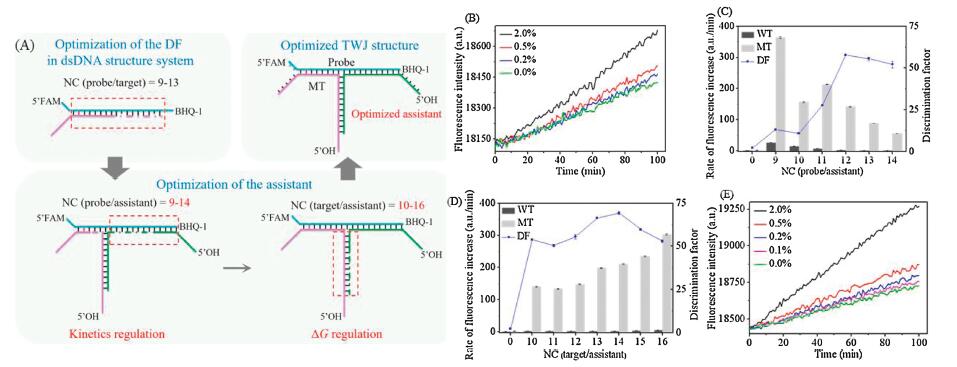
Before applying the TWJ structure, we firstly determined the DF and LOD with the previously reported mutation detection method with λ exo and dsDNA structure system. To save the cost, as shown in Fig. 2A, we fixed the probe sequence and changed the target sequence to find the best complementary base pairs in the probe/target duplex. However, in real sample detection, the probe rather than the target is to be optimized. As shown in Fig. S2 (Suporting information), when the number of base pairs in the complementary region of probe/target (marked as NC (probe/target)) was 11, we got the largest DF. Then we detected the low-abundance mutation with the probe (P1) and optimized targets (T5 and T6). As shown in Fig. 2B, the LOD was 0.2% (the proportion of MT to the total target). The LOD was determined based on the comparison of the low-abundance mutation samples with the WT sample (0% mutation) and 3σ criteria (Table S2 in Supporting information).

|
Download:
|
| Fig. 2. (A) Schematic depiction of the optimization process. (B) In the dsDNA structure system, fluorescence intensity responses of the target in the detection of mutation at different abundances (from 0.0% to 2.0%). (C) When the number of base pairs in the complementary region of probe/target is 9 (NC (probe/target) = 9), the rate of fluorescence increase of WT (dark gray column) and MT (light gray column) as NC (probe/assistant) changed. DF (blue line) was calculated for each. (D) When NC (probe/target) = 9 and NC (probe/assistant) = 12, the rate of fluorescence increase of WT (dark gray column) and MT (light gray column) as NC(target/assistant) changed. DF (blue line) was calculated for each. For (C) and (D), 0 in the abscissa means no assistant was added. The rate of fluorescence increase of WT without the assistant was set as 1. (E) In the TWJ structure system, fluorescence intensity responses of the target in the detection of mutation at different abundances (from 0.0% to 2.0%). | |
However, when dealing with the target in real samples, optimal NC (probe/target) is not easy to obtain without the probe optimization. The ΔG between probe and target may provide some clues for probe design, but the sequence changes of different targets may affect the optimal condition, resulting in a smaller DF. However, in the TWJ structure system, we can optimize the assistant instead of the expensive probe. Thus, a satisfactory DF could still be obtained even if NC (probe/target) is not optimal. To validate this assumption, we tested the situation when NC (probe/target)=9 (with P1, T1, T2), which is not the optimal NC (probe/target) in the dsDNA structure system. The DF of P1/T2 (MT) to P1/T1 (WT) was only 2 without the assistant. The rate of fluorescence increase of MT and WT were low, indicating that the dsDNA structure of P1/T1 and P1/T2 were not fully formed.
As shown in Fig. 2A, the optimization of the assistant was divided into two steps. In the first step, NC (probe/assistant) was optimized to regulate the kinetics of the reaction. The assistant strands were designed (A1 to A6 in Table S1 in Supporting information) to be complementary to the probe from its 3′ end with 9–14 base pairs (NC (probe/assistant)=9–14). NC (probe/assistant) added NC (probe/target) is constant to be 19 when NC(probe/assistant) > 9 as there are only 19 bases in the probe to hybridize with assistant or target. Thus, the change in NC (probe/assistant) should not change the ΔG of the system in this condition. However, when the assistant becomes longer, it will compete with the target to bind with the probe, and generate a bubble on the junction point. The bubble may affect the kinetics of the reaction. Because the λ exo has the manner of processive digestion, which means that λ exo will not leave the substrate until the substrate is almost digested. Thus the bubble on the junction point may impede the digestion of λ exo and decrease the reaction rate. As the decrease extents of MT and WT may not be the same, DF could be affected. As shown in Fig. 2C, the addition of the assistant strand could significantly improve the reaction rate for MT, and DF was improved. When NC(probe/assistant) was 12, we obtained the preliminary optimized DF to be 58.
As shown in Fig. 2A, in the second step, NC (target/assistant) was optimized to regulate the reaction from thermodynamics. According to the results of the first step, we kept NC (probe/target) as 9 and NC (probe/assistant) as 12. We changed the sequence of assistant strands (A4 and A8 to A13 in Table S1 in Supporting information) to get different NC (target/assistant) to regulate the ΔG of the reaction system. As shown in Fig. 2D, the optimal DF 70 was got when NC (target/assistant) was 14 with the assistant A11. The formation of the TWJ structure could be predicted by the NUPACK software and confirmed by the electrophoretic analysis (Fig. S3 in Supporting information).
Then, we used probe P1 and assistant A11 to detect the low-abundance mutation of T2 in the T1 and T2 mixture. With the help of the assistant in the TWJ structure, the LOD reached 0.1% (Fig. 2E), which is even better than in the dsDNA structure system using the optimal NC (probe/target) (Fig. 2B). We also tested the DF with TWJ structure when NC (probe/target)=11 (with P1, T5, T6, results shown in Fig. S4 in Supporting information) and NC (probe/target)=13 (with P1, T9, T10, results shown in Fig. S5 in Supporting information). The DF could also be improved with the assistant optimization process. Thus, we confirmed that with adjusting the assistant, satisfactory DF could still be obtained in TWJ structure system when the probe was not optimally designed. As the assistant strand has no expensive labels, it is about 90% cheaper than the probe. The optimization cost could be dramatically saved.
Encouraged by the above results, we used the TWJ structure system to detect a human ovarian cancer-related gene mutation BRCA1 (rs1799949, c.2082C > T). According to the above experiments, NC (probe/target) was set to be 11 (P2, T11 and T12 in Table S1 in Supporting information). The ΔG between the probe and the target was similar to the optimal condition in the above system (−15.03 kcal/mol vs. −16.58 kcal/mol). However, the LOD for mutation detection in the dsDNA structure system was only 2% (Fig. S6 and Table S2 in Supporting information), meaning that the probe is not optimal. The results indicated that different sequences could have significant interference to the probe design in the dsDNA structure system. Then we kept the probe P2 in the TWJ structure system to detect the target. As depicted in Fig. 2A, the assistant strand optimization was conducted. As shown in Fig. S7 (Supporting information), the DF was improved from 7 in the dsDNA structure system to 15 in the TWJ structure system. Also, the reaction rate was significantly improved by about 7 times. With the optimal assistant (A32 in Table S1), the LOD for mutation detection reached as low as 0.2% (Table S2 and Fig. S8 in Supporting information).
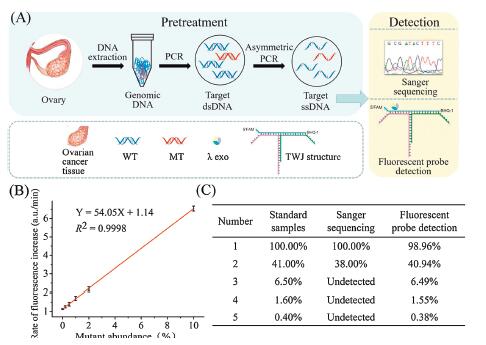
To validate the clinical practicability of our method, we extracted the genomic DNA from an ovarian cancer patient who has 100% BRCA1 c.2082C > T mutation. The genomic DNA was regarded as MT. The genomic DNA brought from Promega with no BRCA1 c.2082C > T mutation was regarded as WT. Then we prepared a serial of samples with different mutation abundance by mixing MT and WT. After the pretreatment procedure (Fig. 3A), we used a microplate reader to detect the fluorescent signal and draw the calibration curve. As shown in Fig. 3B, the LOD was 0.2%, identical to the limit of detection obtained with the synthesized DNA substrates. Then we prepared five standard samples by mixing MT and WT with the mutation abundance to be 100%, 41%, 6.5%, 1.6% and 0.4%, respectively. We used Sanger sequencing and our method to detect the mutation abundance. As shown in Fig. 3C, for samples with high-abundance mutation (100% and 41%, ), the abundance estimated by Sanger sequencing (Fig. S9A in Supporting information) and measured by our method with the calibration curve (Fig. 3B and Fig. S9B in Supporting information) were consistent with the initial abundance in the standard samples. For samples with low-abundance mutation (6.5%, 1.6% and 0.4%), Sanger sequencing could no longer detect the mutation. Our method could still detect them, and the abundances were consistent with the initial abundance in the standard samples. These data demonstrated the practicability of our method in clinical sample detection.

|
Download:
|
| Fig. 3. (A) The workflow of the whole mutation detection process. (B) Calibration curve of the rate of fluorescence increase for samples with different mutation abundances (from 0% to 10%). (C) Mutation abundances in five samples measured by Sanger sequencing and fluorescent probe detection. | |
The TWJ structure system has advantages of lower optimization cost and better DF over the dsDNA structure system. In both reaction systems, the free probe could hardly be digested by λ exo. When the probe hybridizes with the target, the probe/target duplex converts to the substrate of λ exo. The amount of probe/target to the initial amount of the target, which is marked as the conversion ratio of the target, is related to the ΔG of DNA hybridization. We roughly calculated the relation between ΔG and the conversion ratio in the dsDNA system and TWJ system and got the the equations between ΔG and the conversion ratio (see detail discussion in the Supporting information). Based on the equations, we could calculate ΔG with certain conversion ratio and draw the black and red curves shown in Fig. 4A. Ideally, if the ΔG of the reaction system for MT is set at a place where the conversion ratio curve changes sharply (orange line), the ΔG for WT will correspond to a lower conversion rate (blue line). Then better DF could be obtained. However, as mentioned above, the optimal ΔG is not easy to be predicted when the enzyme is involved. Thus, the optimization of the probe is often needed in the dsDNA structure system, as the target sequence in the real sample is fixed. In the TWJ system, we could change the sequence of the assistant to regulate the ΔG of the reaction system. Thus, the expensive probe could be kept. Moreover, a single base pair addition or deletion could change the ΔG at the range between 1.83–6.57 kcal/mol [27]. So, it is challenging to obtain optimal ΔG. In TWJ structure system, it is possible to precisely adjust the ΔG by setting a mismatch at the complementary region formed by the target/assistant without interfering with subsequent λ exo hydrolysis reactions. As shown in Table S3 (Supporting information), the step between the ΔG with different assistant strands could reach 0.12 kcal/mol. When using P1 to discriminate T5 and T6, we could obtain better DF with the precise control of the ΔG (Fig. 4B). The mismatch strategy cannot be achieved in the dsDNA structure system, because additional mismatches set in probe/target will directly affect the λ exo activity.

|
Download:
|
| Fig. 4. (A) The relationship between the conversion ratio of the target and ΔG in the dsDNA structure and the TWJ structure systems. (B) The rate of fluorescence increase of WT (dark gray column) and MT (light gray column) as the ΔG between target/assistant changed. DF (blue line) was calculated for each. 0 in the abscissa means no assistant was added. The rate of fluorescence increase of WT without the assistant was set as 1. | |
In summary, we constructed a new low-abundance gene mutation detection method based on the DNA TWJ structure and λ exo. The TWJ structure showed advantages over the dsDNA structure. In the TWJ structure system, we could optimize the cheap assistant strand instead of the probe with expensive labels and save about 90% of the optimization cost. Besides, we could precisely control the ΔG of TWJ structure hybridization and obtain better DF than in dsDNA structure system. The new method has been successfully applied to clinical samples detection and showed the ability to detect the low-abundance mutations quantitively.
Declaration of competing interestThe authors declare that they have no known competing financial interests or personal relationships that could have appeared to influence the work reported in this paper.
AcknowledgmentsThis work was financially supported by the National Natural Science Foundation of China (Nos. 21904045, 21705053 and 81871732), the Fundamental Research Funds for the Central Universities (No. 2019kfyXJJS169) and National Training Program of Innovation and Entrepreneurship for Undergraduates (No. 201910487087).
Appendix A. Supplementary dataSupplementary material related to this article can be found, in the online version, at doi:https://doi.org/10.1016/j.cclet.2020.06.009.
| [1] |
K. Cibulskis, M.S. Lawrence, S.L. Carter, et al., Nat. Biotechnol. 31 (2013) 213-219. DOI:10.1038/nbt.2514 |
| [2] |
J.C.M. Wan, C. Massie, J. Garcia-Corbacho, et al., Nat. Rev. Cancer 17 (2017) 223-238. DOI:10.1038/nrc.2017.7 |
| [3] |
A. Letai, Nat. Med. 23 (2017) 1028-1035. DOI:10.1038/nm.4389 |
| [4] |
G. De Rubis, S.R. Krishnan, M. Bebawy, Trends Pharmacol. Sci. 40 (2019) 172-186. DOI:10.1016/j.tips.2019.01.006 |
| [5] |
V. Cucchiara, M.R. Cooperberg, M. Dall' Era, et al., Eur.Urol. 73 (2018) 572-582. DOI:10.1016/j.eururo.2017.10.036 |
| [6] |
J.J. Zhang, X.L. Pan, C.E. Bell, Biochemistry 53 (2014) 7415-7425. DOI:10.1021/bi501155q |
| [7] |
J. Li, L.L. Wang, H. Mamon, et al., Nat. Med. 14 (2008) 579-584. DOI:10.1038/nm1708 |
| [8] |
H. Kimura, K. Kasahara, M. Kawaishi, et al., Clin. Cancer Res. 12 (2006) 3915-3921. DOI:10.1158/1078-0432.CCR-05-2324 |
| [9] |
T. Forshew, M. Murtaza, C. Parkinson, et al., Sci. Transl. Med. 4 (2012) 136ra68. |
| [10] |
A.M. Newman, S.V. Bratman, J. To, et al., Nat. Med. 20 (2014) 552-558. |
| [11] |
K. Knez, D. Spasic, K.P.F. Janssen, J. Lammertyn, Analyst 139 (2014) 353-370. DOI:10.1039/C3AN01436C |
| [12] |
Y.V. Gerasimova, D.M. Kolpashchikov, Chem. Soc. Rev. 43 (2014) 6405-6438. DOI:10.1039/C4CS00083H |
| [13] |
D.M. Kolpashchikov, J. Am. Chem. Soc. 128 (2006) 10625-10628. DOI:10.1021/ja0628093 |
| [14] |
S.X. Chen, D.Y. Zhang, G. Seelig, Nat. Chem. 5 (2013) 782-789. DOI:10.1038/nchem.1713 |
| [15] |
M. Bai, F. Chen, X. Cao, et al., Angew. Chem. Int. Ed. 59 (2020) 13267-13272. DOI:10.1002/anie.202001598 |
| [16] |
X.J. Xiao, T.B. Wu, L. Xu, W. Chen, M.P. Zhao, Nucleic Acids Res. 45 (2017) e90. DOI:10.1093/nar/gkx117 |
| [17] |
L. Zhou, Y. Wang, C. Yang, et al., Biosens. Bioelectron. 126 (2019) 657-663. DOI:10.1016/j.bios.2018.11.028 |
| [18] |
J.S. Wang, D.Y. Zhang, Nat. Chem. 7 (2015) 545-553. DOI:10.1038/nchem.2266 |
| [19] |
X.J. Xiao, C. Song, C. Zhang, X. Su, M.P. Zhao, Chem. Commun. 48 (2012) 1964-1966. DOI:10.1039/C1CC15360A |
| [20] |
T.B. Wu, X.J. Xiao, F.D. Gu, M.P. Zhao, Chem. Commun. 51 (2015) 17402-17405. DOI:10.1039/C5CC05749C |
| [21] |
T.B. Wu, X.J. Xiao, Z. Zhang, M.P. Zhao, Chem. Sci. 6 (2015) 1206-1211. DOI:10.1039/C4SC03375B |
| [22] |
J.J. Xu, L.J. Li, N. Chen, et al., Chem. Commun. 53 (2017) 9422-9425. DOI:10.1039/C7CC04816E |
| [23] |
F.M. Shen, H. Qian, Y.L. Cheng, et al., Talanta 206 (2020) 120216. DOI:10.1016/j.talanta.2019.120216 |
| [24] |
X. Chen, N. Liu, L.Q. Liu, et al., Nat. Commun. 10 (2019) 4675. DOI:10.1038/s41467-019-12593-9 |
| [25] |
T.B. Wu, Y.F. Yang, W. Chen, et al., Nucleic Acids Res. 46 (2018) 3119-3129. DOI:10.1093/nar/gky154 |
| [26] |
T.B. Wu, W. Chen, Z.Y. Yang, et al., Nucleic Acids Res. 46 (2018) e24. DOI:10.1093/nar/gkx1218 |
| [27] |
D.Y. Zhang, S.X. Chen, P. Yin, Nat. Chem. 4 (2012) 208-214. DOI:10.1038/nchem.1246 |