 2021, Vol. 32


As a consequence of the long-term overusing of fossil resources for combustible electricity generation, excavating clean and sustainable alternatives to mitigate those environmental issues has been worldwide promoted. Renewable electricity generation from wind and solar could be the most optimal option to reduce dependence on the traditionally thermal power station. Nonetheless, the natural intermittency limits the spreading of commercialization, leading to the creeping demands of reliable energy storage. Electrochemical energy storage has been well known since 1940 and massively researched in the last decades. Now, research attentions are focused on several electrochemical energy storage systems, such as lithium-ion batteries (LIBs) [1-4], lithium-sulfur batteries [5-7], sodium-ion batteries [8] and supercapacitors [9, 10]. Among them, LIBs are the most popular commercial energy storage devices used in various portable electronics such as cellular phones and in large-scale applications such as electric vehicles. Over the last decades, graphite has always been the cardinal anode material for LIBs, but the low capacity (372 mAh/g) [11], poor rate performance and safety considerations extremely limit its large-scale commercial applications in electric vehicles and grid storage, etc. Therefore, the development of high-capacity anode materials has become the focus of attention. There are various high-capacity anode materials, for example, transition metal oxides, metal nitrides, metal sulfides. Among them, Fe3O4 has attracted extensive attentions owing to its high reversible capacity (926 mAh/g), affordable cost and abundant reserves [12].
However, the shortcomings of Fe3O4-based nanomaterials cannot be ignored, even though they have many advantages, i.e., (ⅰ) Fe3O4 nanoparticles are prone to agglomeration due to its size effect and magnetism; (ⅱ) In the process of Li+ insertion and deinsertion reactions, large volume change will occur in transition metal oxides due to the internal stress, leading to the deteriorative transportation and diffusion properties of electric charge and Li+ ions, which seriously affects its cycle performance and rate performance; (ⅲ) The lack of interpenetrating ion transmission paths and continuous conductive network in electrode materials usually results in the low utilization of Fe3O4 nanoparticles [13]; (ⅳ) The inherently low conductivity of metal oxides has a serious negative effect on the transport of ions/electrons in the rapid electrochemical reaction [14, 15]. To solve these problems, various modification methods have been carried out, such as preparation of nanoparticles with special morphology, surface modification by coating, and change of the crystal structure by doping. It is recognized that regulate the structure and morphologies of Fe3O4 or combine it with other functional materials can significantly improve the electrochemical performance [16, 17].
Functional carbon-coated materials with special morphologies are more likely to obtain higher lithium storage performance. For example, the electrical conductivity, active material utilization (specific capacity) and the rate performance of Fe3O4/carbon composites can be obviously enhanced by combining the Fe3O4 with conductive pyrolytic carbon shell [18, 19], carbon nanotubes [20, 21] or rGO [22]. Attractively, surface functionalized two-dimensional reduced graphene oxide (rGO) is conducive to interact or react with most metal ligands, which means that bridging rGO with other metal oxides can be easily achieved. As an enhancing component, rGO has some particular features, e.g., outstanding carrier mobility, large specific surface area, attractive electrical conductivity and extraordinary mechanical strength. Besides, rGO can change the transfer path and influence the contact area between active material and electrolyte, having a deep impact on the diffusion rate of lithium ions.
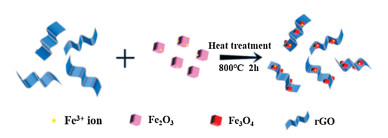
Herein, a Fe3O4/rGO composite was prepared by a facile hydrothermal reaction followed by a high temperature treatment, as described in detail in Supporting information. First, the Fe2O3 cubes were prepared by a hydrothermal reaction. Second, for the preparation of Fe3O4/rGO composite, the surface of the prepared Fe2O3 cubes was modified by adsorbing Fe3+ cations, and then an electrostatic interaction taken place between the positively charged Fe2O3 cubes and the negatively charged GO sheets. Thus, the Fe2O3 cubes were anchored on the surface of GO sheets. Through separation, rinsing and drying, the Fe2O3 cubes were wrapped by the curled GO sheets. Lastly, the 3D structured Fe3O4/rGO composite with Fe3O4 cubes enwrapped by rGO was obtained by heat treatment of the Fe2O3 cubes and GO sheets at 800 ℃ under nitrogen atmosphere, as illustrated in Scheme 1.

|
Download:
|
| Scheme 1. Schematic diagram illustrating the preparation procedure of Fe3O4/rGO composite material. | |
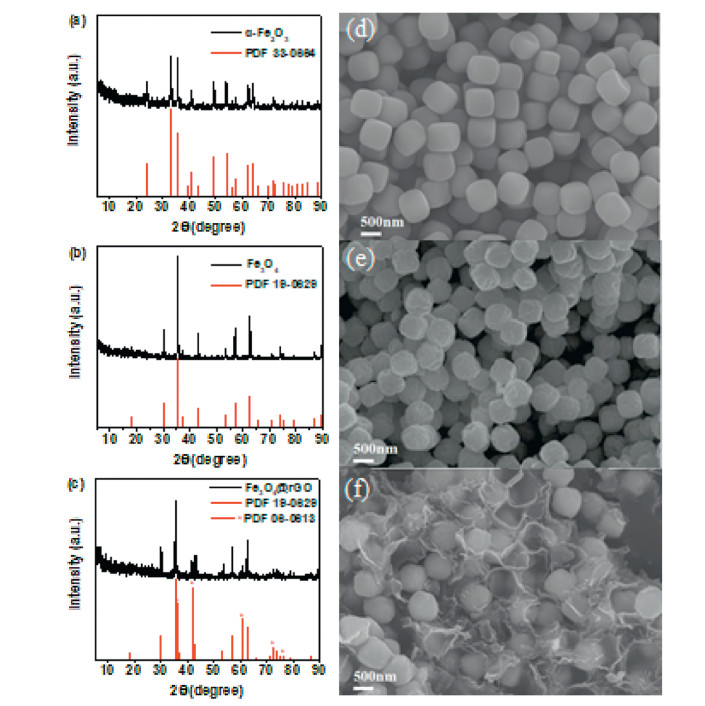
The X-ray diffraction (XRD) patterns of Fe2O3 cubes, Fe3O4 cubes and Fe3O4/rGO composite are shown in Figs. 1a-c, respectively. As can be seen in Fig. 1a, the diffraction peaks of Fe2O3 corresponded well to the standard diffraction peaks of α-Fe2O3 (JCPDS No. 33-0664, space group R-3c). While, in Fig. 1b the Fe3O4 ascribed to the Fe3O4 phase (JCPDS No. 19-0629, space group Fd3m), and the iron oxide in Fe3O4/rGO composite (Fig. 1c) is mainly composed of Fe3O4 (JCPDS No. 19-0629, space group Fd3m), but contains a small amount of FeO (JCPDS No. 06-0615, space group Fm3m). However, no characteristic diffraction peaks of rGO can be detected in the Fe3O4/rGO composite due to its low content and the disordered structure [23]. The rGO content in Fe3O4/rGO composite is ca. 9.4%, which is determined by the thermogravimetric analysis (Fig. S2 in Supporting information). Figs. 1d-f show the SEM images of Fe2O3, Fe3O4 and Fe3O4/rGO composites, respectively. It can be seen from Fig. 1d that the Fe2O3 sample exhibits the morphology of monodisperse cubes of ∼700 nm with a smooth surface, and while In Fig. 1e, the reduced product (Fe3O4 cubes) become slightly coarse on the surface. In Fig. 1f, the iron oxide cubes in Fe3O4/rGO sample have the same shape and size as the Fe2O3 cubes and the rGO nanosheets are distributed in the Fe3O4 cubes, forming a conductive network.

|
Download:
|
| Fig. 1. XRD patterns of (a) Fe2O3, (b) Fe3O4 and (c) Fe3O4/rGO. SEM images of (d) Fe2O3, (e) Fe3O4 and (f) Fe3O4/rGO. | |
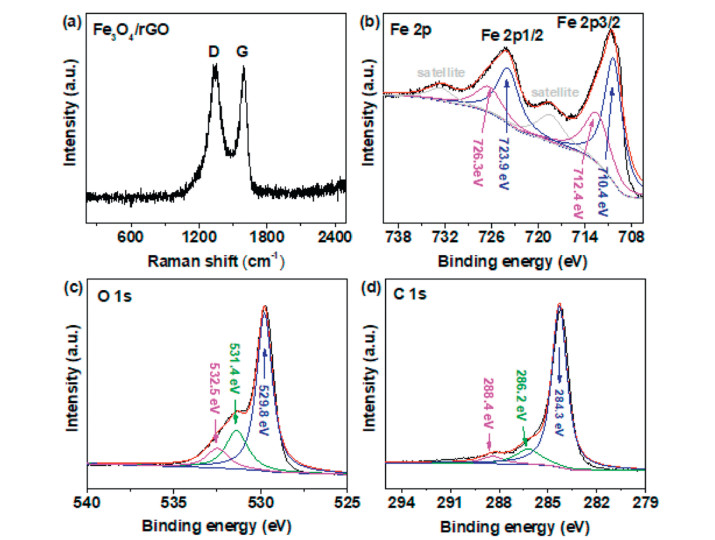
The Fe3O4/rGO composite was further analyzed by Raman spectroscopy and the result is shown in Fig. 2a. Two main peaks are observed in the Raman spectrum, corresponding to the disordered carbon defect (D band) at 1350 cm−1 and the ordered sp2 graphite plane (G band) at 1591 cm−1 [24, 25]. The intensity ratio of D band to G band (ID/IG) is usually used to illustrate the degree of ordering of carbon element [26]. The ID/IG value of rGO in Fe3O4/rGO sample is 0.983, which proves that the rGO contained in Fe3O4/rGO composite possesses high crystallinity, thus enhances the conductivity of the material. X-ray photoelectron spectroscopy (XPS) was used to analyze the chemical characteristics and oxidation states. As shown in Fig. 2b, the high-resolution XPS spectra of Fe 2p reveals two characteristic peaks of Fe 2p3/2 and Fe 2p1/2 at 710.8 and 724.4 eV, respectively. The fitted features of 710.4 and 723.9 eV should be attributed to 2p3/2 and 2p1/2 of Fe2+, and while those of 712.4 and 726.3 eV should be ascribed to 2p3/2 and 2p1/2 of Fe3+ [27, 28]. It can be seen from the fitted peak areas that the content of Fe2+ and Fe3+ are almost equivalent because of the existence of a small amount of FeO in the composite, which is consistent with the XRD result. The O 1s spectrum in Fig. 2c shows three fitted peaks at 529.8, 531.4 and 532.5 eV, respectively. The peak at 529.8 eV is attributed to the lattice oxygen (Fe3O4), the peak at 531.4 eV should be caused by the Fe-O-C bond formed between Fe3O4 and rGO, and the peak at 532.5 eV should be assigned to the C−OH group in rGO. The C 1s spectrum in Fig. 2d displays a sharp peak at 284.8 eV, which should be attributed to the carbon skeleton in rGO, and while the fitted peaks at 286.2 and 288.4 eV should correspond to C−OH and C=O groups, respectively [29].

|
Download:
|
| Fig. 2. (a) Raman spectra of Fe3O4/rGO composite; High-resolution XPS spectra of (b) Fe 2p, (c) O 1s and (d) C 1s of Fe3O4/rGO composite. | |
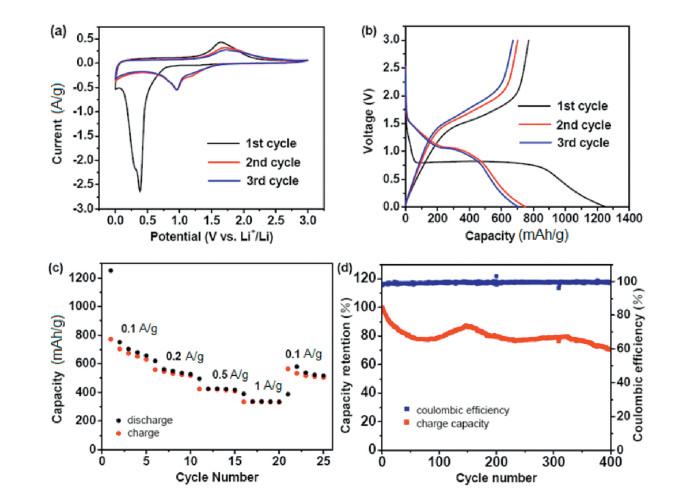
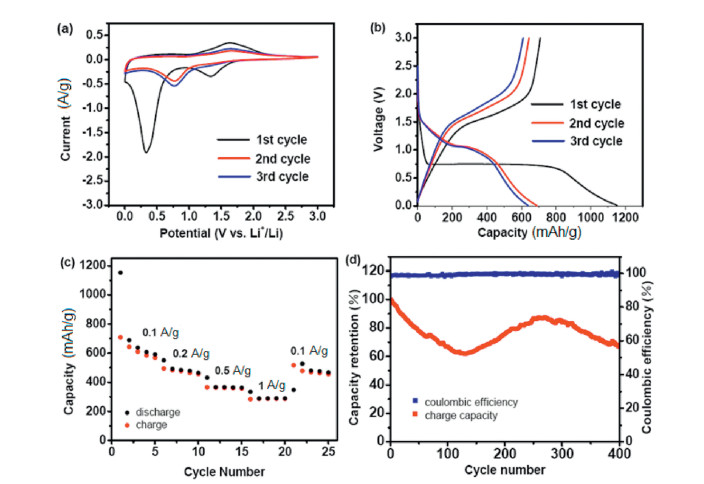
The cyclic voltammograms (CVs) of Fe3O4/rGO electrode for the first three cycles is presented in Fig. 3a. In this work, the current density (A/g) and specific capacity (mAh/g) are calculated based on the mass of the active materials. As shown, during the first cathode scan, the very sharp peak at ca. 0.45 V is assigned to the conversion of Fe3O4 (containing a small amount of FeO) to metallic Fe and Li2O, which is positively moved to ca. 1.0 V in the subsequent cycles, and while the anodic peak at ca. 1.65 V should be attributed to the oxidation of metallic Fe to Fe(Ⅱ) and/or Fe(Ⅲ) oxide(s) accompanied by the decomposition of Li2O [30-33]. From the second cycle scan, the cathodic peak is obviously decreased and anodic peak is also decreased in some degree, and the coulombic efficiency for the first cycle is low. This is because that the first cathode process is accompanied by the decomposition of electrolyte and formation of the solid electrolyte interphase (SEI) layer. In addition, the inherently poor conductivity of the Fe3O4/Fe/Li2O matrix formed during the Li+ insertion/extraction process may also cause irreversible capacity loss [34].

|
Download:
|
| Fig. 3. Electrochemical performance of Fe3O4/rGO electrode. (a) CVs of first three cycles at the scan rate of 0.2 mV/s. (b) Discharge/charge curves of first three cycles at 0.1 A/g. (c) Rate performance. (d) Cycling performance at 0.5 A/g. | |
Fig. 3b shows the constant current discharge and charge curves of Fe3O4/rGO electrode at the current density of 0.1 A/g for the first three cycles. The first discharge and charge capacities are 1251 and 773 mAh/g, respectively, giving coulombic efficiency of 61.8%. The second charge capacity is 704 mAh/g and the coulombic efficiency is 93.7%, and while the third charge capacity is 674 mAh/g and the coulombic efficiency is 95.9%. The rate performance of Fe3O4/rGO electrode cycled from 0.1 A/g to 1 A/g is shown in Fig. 3c. The maximum reversible charge specific capacities at 0.1, 0.2, 0.5 and 1 A/g are 772.1, 558.4, 423.7 and 335.8 mAh/g, respectively, with capacity retention of 43.5% when the current density is increased from 0.1 A/g to 1 A/g. When the current density is decreased back to 0.1 A/g, the maximum reversible charge specific capacity is 564.5 mAh/g that is obviously lower than that achieved in the initial cycle due to capacity decline in the cycles at lower current densities (0.1 and 0.2 A/g). As can be seen, the cycle stability becomes better with increasing current density. The cycling performance of Fe3O4/rGO electrode (after the rate performance test) at the current density of 0.5 A/g is displayed in Fig. 3d. The capacity decline in the first 70 cycles may be related to the initial volume change, and the subsequent capacity rise (from ca. 90-150th cycle) should be ascribed to the further morphological change of the electrode towards a favorable direction. After 400 cycles, the capacity retention is 70.3% with the coulombic efficiency close to 100%. Fig. S3 (Supporting information) shows the SEM image of Fe3O4/rGO electrode after 400 cycles. As can be seen, the particles of the active material have a certain degree of aggregation after a long-term cycle.
For comparison, the electrochemical performance of Fe2O3 cubes is presented in Fig. 4, where Fig. 4a shows the CVs for the first three cycles. In the first cathodic scan, two peaks located at ca. 1.33 and 0.34 V are observed. The peak at ca. 1.33 V should be related to the initial lithiation of Fe2O3 (Fe2O3 + xLi+ + xe− → LixFe2O3), and while the sharp peak at ca. 0.34 V should be attributed to the conversion reaction (LixFe2O3 + (6-x)Li+ + 6e− ↔ 2Fe + 3Li2O) to metallic Fe and Li2O, which is shifted positively to ca. 0.77 V during the following cathodic scan. In the first anodic scan, the peak at ca. 1.65 V should be ascribed to the oxidation of metallic Fe to FeOx and the decomposition of Li2O [35, 36]. During the following cycles, the reversible conversion reactions take place between metallic Fe and FeOx. Fig. 4b shows the constant current discharge and charge curves of Fe2O3 electrode at 0.1 A/g for the first three cycles. The first discharge and charge capacities are 1152 and 708 mAh/g, giving coulombic efficiency of 61.4%. The second charge capacity is 643 mAh/g with the coulombic efficiency of 93.5%, and the third charge capacity is 609 mAh/g with the coulombic efficiency of 95.6%. As shown in Fig. 4c, the maximum reversible charge specific capacities at 0.1, 0.2, 0.5 and 1 A/g are 708.4, 493.9, 364.9 and 286.3 mAh/g, respectively, with capacity retention of 40.4% when the current density is increased from 0.1 A/g to 1 A/g. When the current density is decreased back to 0.1 A/g, the maximum reversible charge specific capacity is 516.3 mAh/g. Fig. 4d displays the cycle performance at 0.5 A/g. After 83 cycles, the capacity is decreased to 70.5% of the initial value. After 130 cycles, the capacity is decreased to a low value of 61.7% of the initial value. Afterwards, the capacity increases again and then decreases. After 400 cycles, the capacity retention is 66.7%. Compared to Fe3O4/rGO composite (Fig. 3), the electrochemical performance of Fe2O3 is poor, especially the cycling performance.

|
Download:
|
| Fig. 4. Electrochemical performance of Fe2O3 electrode. (a) CVs of first three cycles at the scan rate of 0.2 mV/s. (b) Discharge/charge curves of first three cycles at 0.1 A/g. (c) Rate performance. (d) Cycling performance at 0.5 A/g. | |
The CVs of Fe3O4 electrode for the first three cycles at the scan rate of 0.2 mV/s are shown in Fig. S4a (Supporting information). In the first cathodic scan, two peaks are observed at ca. 1.75 and 0.2 V. The cathodic peak at ca. 1.75 V should be ascribed to the initial lithiation of Fe3O4 (Fe3O4 + xLi+ + xe− → LixFe3O4), and the sharp peak at ca. 0.2 V is attribute to the conversion reaction (LixFe3O4 + (8-x)Li+ + 8e− ↔ 3Fe + 4Li2O), which is positively moved to ca. 0.98 V during the following cathodic scan. In the first anodic scan, the peak at ca. 1.6 V should be ascribed to the oxidation of metallic Fe to FeOx and the decomposition of Li2O. During the subsequent cycles, the reversible conversion reactions take place between metallic Fe and FeOx. Fig. S4b (Supporting information) shows the constant current discharge and charge curves of Fe3O4 electrode for the first three cycles at 0.1 A/g. The first discharge and charge capacities are 1154 and 425 mAh/g, giving coulombic efficiency of 36.8%. The second charge capacity is 300.4 mAh/g with the coulombic efficiency of 77.5%, and the third charge capacity is 259 mAh/g with the coulombic efficiency of 88.4%, exhibiting much inferior electrochemical performance to the Fe3O4/rGO composite. As shown in Fig. S4c (Supporting information), the maximum reversible charge specific capacities at 0.1, 0.2, 0.5 and 1 A/g are 425, 142.7, 65.3 and 33.3 mAh/g, respectively, with capacity retention of 7.84% when the current density is increased from 0.1 A/g to 1 A/g, showing poor rate performance. When the current density is decreased back to 0.1 A/g, the maximum reversible charge specific capacity is decreased to 212.3 mAh/g. Fig. S4d (Supporting information) displays the cycle performance at 0.5 A/g. After 84 cycles, the capacity is decreased to 94.2% of the initial value. Yet, a gradual increase in capacity is observed thereafter. Howbeit, its specific capacity is too low at this current rate.
In order to know the kinetic characteristics of Fe3O4/rGO, Fe2O3 and Fe3O4 electrodes, after the rate performance test (25 cycles), the electrochemical impedance spectroscopy (EIS) measurement was carried out for the electrodes. As depicted in Fig. S5 (Supporting information), the intersection of the real axis and the semicircle of the high frequency zone in Nyquist plots is the ohmic resistance (RΩ). The smaller arc in the high frequency region represents the SEI-related resistance (R1) in parallel with the constant phase angle element (CPE1), and the larger medium frequency region represents the charge transfer resistance (R2) in parallel with the another constant phase angle element (CPE2), and while the line in the low frequency region corresponds to the Warburg diffusion impedance (W1) of lithium ions in the active material [37, 38]. As can be seen, both the ohmic resistance and the charge transfer resistance of the Fe3O4/rGO composite are obviously smaller than those of the Fe2O3 and Fe3O4, which should be responsible for the observed better rate performance of the Fe3O4/rGO composite. The impedance of Fe3O4 is much larger than that of the others, which should account for the observed poor rate performance. In addition, the rGO in the Fe3O4/rGO composite can not only provide an interconnected conductive network for the monodispersed Fe3O4 cubes, but also relieve the effect of volume expansion of the active material during cycling, thus improve the lithium storage performance, especially the cycling stability.
In conclusion, a Fe3O4/rGO composite was prepared by a hydrothermal reaction and followed heat treatment process, and physically characterized in detail. Electrochemical results revealed that the lithium storage performance of Fe3O4/rGO is superior to that of the Fe2O3 or Fe3O4. The reversible charge specific capacities of Fe2O3, Fe3O4 and Fe3O4/rGO are 708.4, 425.8 and 772.1 mAh/g at the current density of 0.1 A/g, and 286.3, 30.8 and 335.8 mAh/g at 1 A/g, respectively. After 400 cycles at 0.5 A/g, the capacity retention of Fe3O4/rGO is 70.3% that is much superior to that of the Fe2O3. These results demonstrate that the combination of conductive and flexible rGO can effectively enhance lithium storage performance of the iron oxide-based anode material for lithium ion batteries.
Declaration of competing interestThe authors declare that they have no known competing financial interests or personal relationships that could have appeared to influence the work reported in this paper.
AcknowledgmentsThis work was supported by the Shanghai Committee of Science and Technology, China (No. 17010500500) and the National Key Research and Development Plan of China (No. 2017YFB0102200).
Appendix A. Supplementary dataSupplementary material related to this article can be found, in the online version, at doi:https://doi.org/10.1016/j.cclet.2020.11.038.
| [1] |
F. Han, W.C. Li, C. Lei, et al., Small 10 (2014) 2637-2644. DOI:10.1002/smll.201400371 |
| [2] |
T. Yi, T. Wei, Y. Li, et al., Energy Stor. Mater. 26 (2020) 165-197. DOI:10.1016/j.ensm.2019.12.042 |
| [3] |
H. Zheng, H. Zhang, Y. Fan, et al., Chin. Chem. Lett. 31 (2020) 210-216. DOI:10.1016/j.cclet.2019.03.048 |
| [4] |
H. Zhang, X. Huang, O. Noonan, et al., Adv. Funct. Mater. 27 (2017) 1606023. DOI:10.1002/adfm.201606023 |
| [5] |
J. He, A. Manthiram, Energy Stor. Mater. 20 (2019) 55-70. DOI:10.1016/j.ensm.2019.04.038 |
| [6] |
W. Sun, C. Liu, Y. Li, et al., ACS Nano 13 (2019) 12137-12147. DOI:10.1021/acsnano.9b06629 |
| [7] |
Y. Wang, R. Zhang, J. Chen, et al., Adv. Energy Mater. 9 (2019) 1900953. DOI:10.1002/aenm.201900953 |
| [8] |
S. Qi, D. Wu, Y. Dong, et al., Chem. Eng. J. 370 (2019) 185-207. DOI:10.1016/j.cej.2019.03.166 |
| [9] |
J. Nai, X.W.D. Lou, Adv. Mater. 31 (2019) e1706825. DOI:10.1002/adma.201706825 |
| [10] |
Y.F. Deng, Y. Xie, K.X. Zou, et al., J. Mater. Chem. A 4 (2016) 1144-1173. DOI:10.1039/C5TA08620E |
| [11] |
L. Sun, K. Wang, N. Li, et al., Chin. Chem. Lett. 31 (2020) 2333-2338. DOI:10.1016/j.cclet.2020.02.006 |
| [12] |
Y. Wang, L. Chen, H. Liu, et al., Chem. Eng. J. 356 (2019) 746-755. DOI:10.1016/j.cej.2018.09.015 |
| [13] |
W. Han, X. Qin, J. Wu, et al., Nano Res. 11 (2017) 892-904. |
| [14] |
C. Han, L. Xu, H. Li, et al., Carbon 140 (2018) 296-305. DOI:10.1016/j.carbon.2018.09.010 |
| [15] |
Z. Liu, X. Yu, U. Paik, Adv. Energy Mater. 6 (2016) 1502318. DOI:10.1002/aenm.201502318 |
| [16] |
G. Zhong, K. Qu, C. Ren, et al., Nano Energy 74 (2020) 104876. DOI:10.1016/j.nanoen.2020.104876 |
| [17] |
Y. Deng, Q. Zhang, Z. Shi, et al., Electrochim. Acta 76 (2012) 495-503. DOI:10.1016/j.electacta.2012.05.071 |
| [18] |
L. Li, Z. Yuan, R. Fan, et al., J. Mater. Sci. Mater. Electron. 31 (2020) 6449-6460. DOI:10.1007/s10854-020-03200-5 |
| [19] |
T. Sun, Z. Li, H. Wang, et al., Angew. Chem. Int. Ed. 55 (2016) 10662-10666. DOI:10.1002/anie.201604519 |
| [20] |
C. Lin, L. Hu, C. Cheng, et al., Electrochim. Acta 260 (2018) 65-72. DOI:10.1016/j.electacta.2017.11.051 |
| [21] |
Z. Yao, X. Xia, C.A. Zhou, et al., Adv. Sci. 5 (2018) 1700786. DOI:10.1002/advs.201700786 |
| [22] |
X. Ou, C. Yang, X. Xiong, et al., Adv. Funct. Mater. 27 (2017) 1606242. DOI:10.1002/adfm.201606242 |
| [23] |
Y. Wang, D. Kong, W. Shi, et al., Adv. Energy Mater. 6 (2016) 1601057. DOI:10.1002/aenm.201601057 |
| [24] |
X. Ge, Z. Li, L. Yin, Nano Energy 32 (2017) 117-124. DOI:10.1016/j.nanoen.2016.11.055 |
| [25] |
Z. Li, C. Li, X. Ge, et al., Nano Energy 23 (2016) 15-26. DOI:10.1016/j.nanoen.2016.02.049 |
| [26] |
K. Wu, D. Liu, Y. Tang, Electrochim. Acta 263 (2018) 515-523. DOI:10.1016/j.electacta.2018.01.047 |
| [27] |
S. Chen, Q. Wu, M. Wen, et al., ACS Appl. Mater. Interfaces 10 (2018) 19656-19663. DOI:10.1021/acsami.8b02839 |
| [28] |
J. Luo, J. Liu, Z. Zeng, et al., Nano Lett. 13 (2013) 6136-6143. DOI:10.1021/nl403461n |
| [29] |
C. Fu, G. Zhao, H. Zhang, et al., Int. J. Electrochem. Sci. 9 (2014) 46-60. |
| [30] |
C.P. Han, L. Xu, H.F. Li, et al., Carbon 140 (2018) 296-305. DOI:10.1016/j.carbon.2018.09.010 |
| [31] |
J.S. Luo, J.L. Liu, Z.Y. Zeng, et al., Nano Lett. 13 (2013) 6136-6143. DOI:10.1021/nl403461n |
| [32] |
M. Gao, P. Zhou, P. Wang, et al., J. Alloys Compd. 565 (2013) 97-103. DOI:10.1016/j.jallcom.2013.03.012 |
| [33] |
S. Zhou, Y. Zhou, W. Jiang, et al., Appl. Surf. Sci. 439 (2018) 927-933. DOI:10.1016/j.apsusc.2017.12.259 |
| [34] |
W. Deng, S. Ci, H. Li, et al., Chem. Eng. J. 330 (2017) 995-1001. DOI:10.1016/j.cej.2017.08.039 |
| [35] |
R. Huang, Y. Li, W. Liu, et al., Ceram. Int. 46 (2020) 17478-17485. DOI:10.1016/j.ceramint.2020.04.043 |
| [36] |
Z. Zheng, P. Li, J. Huang, et al., J. Energy Chem. 41 (2020) 126-134. DOI:10.1016/j.jechem.2019.05.009 |
| [37] |
Y. Dong, B. Wang, K. Zhao, et al., Nano Lett. 17 (2017) 5740-5746. DOI:10.1021/acs.nanolett.7b02698 |
| [38] |
P. Lian, S. Liang, X. Zhu, et al., Electrochim. Acta 58 (2011) 81-88. DOI:10.1016/j.electacta.2011.08.088 |