 2021, Vol. 32


b School of Physics, Henan Normal University, Xinxiang 453000, China;
c Center of Nanoelectronics and School of Microelectronics, Shandong University, Ji'nan 250100, China;
d ARC Centre of Excellence in Exciton Science, School of Chemistry, The University of Melbourne, Parkville, Victoria 3010, Australia
Solar energy plays a very important role in solving serious environmental problems and the terawatt energy challenge the world is facing today. Academia and industry try their best to provide clean, renewable, cost-effective and high-performance photovoltaic technologies [1, 2]. Solution-processed bulk hetero-junction (BHJ) organic solar cells (OSCs) have attracted considerable attention in the last two decades due to their advantages such as low cost fabrication, light weight, flexibility, semitransparency [3-5]. Fullerene derivatives were believed to be a critical component for efficient operation of OSCs in past two decades because of their ball-like fully conjugated structure, which provides strong electron-accepting and isotropic electron-transport capabilities and facilitates electron delocalization at the donor/acceptor (D/A) interfaces [6, 7]. However, the extensive application of fullerene derivatives in OSCs are restricted, due to limited tunability of energy levels [8], weak absorption in the visible region and poor stability. The development of non-fullerene (NF) acceptors presents opportunities which are not possible to achieve in fullerene-based OSCs. To date, the highest power conversion efficiency (PCE) of single-junction NF OSCs has achieved 16.35% [9]. The typical BHJ OSCs are based on a sandwiched structure with the active layer blending an electron donor (D) and an electron acceptor (A). The basic working principle of the BHJ OSCs relies on four elementary steps [10]: (1) absorption of photons and creation of excitons; (2) exciton diffusion to the D/A interface; (3) exciton dissociation into free charge carriers (holes and electrons) at D/A interfaces; (4) charge transport and collection. Each step could be a bottleneck limiting the improvement of OSCs performance. The morphology of active layers plays a very important role on the second and forth steps [11]. The nanomorphology of the active layer is affected by the D/A properties (such as solubility, miscibility, D: A ratios) [12-14]. Abi-continuous composite of donor and acceptor which possesses maximized D/A interface area and appropriate domain size, achieving effective exciton dissociation and exciton diffusion, is defined as the ideal BHJ OSCs [15]. The proper balance between the mixing and demixing of donor and acceptor is necessary to obtain high OSCs performance. However, although the effect of various D: A ratios on OSCs performance are extensively investigated based on different polymer donor materials with the fullerene acceptor PCBM [16-18], few researches have been done on the various ratio of D: A based on non-fullerene systems. Seeking the solution of these key problems is urgently required to further understand the photophysical mechanism and boost the efficiency of nonfullerene solar cells. Therefore, it is necessary to investigate the effect of various D: A ratios on photophysical properties (such as charge transfer, energy transfer, etc.) in the non-fullerene organic BHJ devices, which would help to get a deep insight into the nonfullerene systems.
In this work, we comprehensively investigated the relationship between various D: A blend ratios and the charge transfer and energy transfer mechanisms in OSCs based on poly[(2, 6-(4, 8-bis(5-(2-ethylhexyl)thiophen-2-yl)benzo[1, 2-b: 4, 5-b']dithiophene))-co-(1, 3-di(5-thiophene-2-yl)–5, 7-bis(2-ethylhexyl)benzo[1, 2-c: 4, 5-c'] dithiophene-4, 8-dione)] (PBDB-T) and non-fullerene acceptor 3, 9-bis(2-methylene-(3-(1, 1-dicyanomethylene)-5-methylindanone))-5, 5, 11, 11-tetra(4-hexylphenyl)dithieno[2, 3-d: 20, 30-d0]sindaceno[1, 2-b: 5, 6-b0]dithiophene (IT-M) [19]. A series of films are fabricated with various D: A ratios to study the photophysical mechanism. The steady-state photoluminescence (PL) spectra, fluorescence lifetime profiles and transient absorption (TA) spectroscopy are used to elucidate the charge transfer and energy transfer process from donor to acceptor. With various D: A ratios, we further demonstrate the effect on the nanomorphology, such as crystallinity, molecular orientation, domain purity. This exhibits a perspective to understand the effect of various D: A ratios on BHJ OSCs photophysical properties and also provides constructive suggestions for rationally designing new materials and feedback for photovoltaic performance optimization.
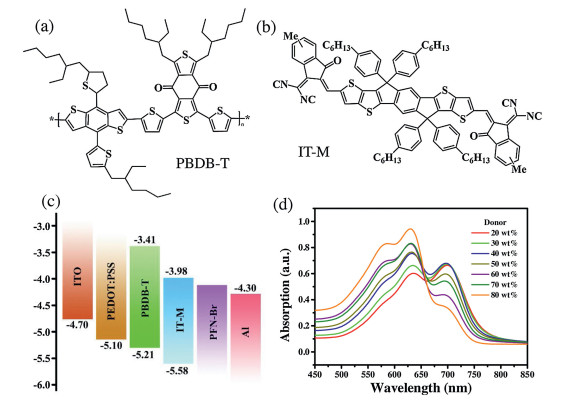
The chemical structures and the molecular energy level alignments of the donor and acceptor used in this work are shown in Figs. 1 a–c. Fig. S1a (Supporting information) shows the normalized absorption spectra of neat PBDB-T and neat IT-M. The absorption spectrum of PBDB-T film exhibits a strong absorption band among 500-700 nm with two peaks located at 580 and 630 nm. The lower energy part at 630 nm should be related to interchain π-π* transition due to the π-π stacking of the backbones, while the higher energy part at 580 nm should be attributed to π-π* transition along the conjugated backbone of the polymer [20-22]. The absorption spectrum of neat IT-M is primarily in the range from 550 nm to 800 nm with a maximum at 700 nm, complementary to that of the donor. The absorption spectra of the blend films with different donor: acceptor (D: A) ratios are shown in Fig. 1d. Three characteristic absorption peaks can be observed in the absorption spectra of blend films. With increasing donor component, the intensity of shoulder peaks at 580 nm and 630 nm notably improves, while the shoulder peak intensity at 700 nm isgradually weakened. Obviously, the polymer donor contributes more to the absorption in the short wavelength region, while IT-M contributes more to the absorption in long wavelength region [23]. The absorption spectra of blend films reveal that PBDB-T and IT-M have different contributions to the photon acquisition. Figs. S1b and c (Supporting information) depict the normalized absorption spectra of blend films with the various D: A ratio, normalized at 630 nm and 700 nm, respectively. The normalized absorption spectra show the 0-0 peak of IT-M blue shift slightly, while the peak of PBDB-T do not change obviously. In previous work [24, 25], the strong aggregation effect of PBDB-T in solution is helpful for forming pure polymer aggregations and suppressing geminate recombination in a device. Therefore, from the PL measurement, we assume that the size of the aggregate for IT-M isdecreased and IT-M is significant disorder. The addition of IT-M negligible impact the forming of pure polymer aggregation.

|
Download:
|
| Fig. 1. Chemical structures of (a) PBDB-T and (b) IT-M. (c) Energy level diagrams of the materials used in OSCs. (d) Absorption spectra of the blend films of PBDB-T and IT-M with various D: A blend ratios. | |
Steady-state photoluminescence (PL) spectra were recorded to examine the efficient exciton dissociation and charge transfer property in BHJ with various D: A blend ratios. PL quenching effect can be an important evidence of charge transfer [26, 27]. As depicted in Fig. 2a, the neat film of PBDB-T shows an emission peak at 680 nm, and the emission peak at 760 nm comes from neat IT-M. When the weight ratio of donor is 20% and 30%, the PL peak of PBDB-T is almost quenched (Fig. 2b, red line and green line), indicating the efficient electron transfer from PBDB-T to IT-M. With increasing the PDBD-T content, the PL peak of PBDB-T continuously enhanced. The population of photoinduced excitons decays either by charge transfer or through geminate recombination. Förster resonance energy transfer (FRET) is the incoherent nonradiative transfer of excitons between two chromophores via dipole-dipole coupling [28], which could significantly boost the PCEs of BHJ solar cells [29]. Based on FRET theory, the emission spectrum of PBDB-T almost overlapped with the absorption spectrum of IT-M, as shown in Fig. 2a, so that energy transfer may occur from PBDB-T to IT-M [26].

|
Download:
|
| Fig. 2. The normalized PL spectra of neat PBDB-T and neat IT-M and the normalized absorption of neat IT-M. (b) The normalized PL spectra with various D: A blend ratios. (c) Fluorescence decay profiles recovered from the lifetime image with pump intensity of 3 mW. | |
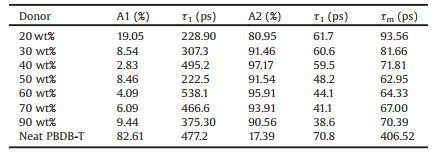
The time-resolved fluorescence measurments with the timecorrelated single photon counting mode were used to investigate the fluorescence decay dynamics of blend films with various D: A ratios, and the results are shown in Fig. 2c (the pump intensity is 3 mW). The fluorescence lifetime if usually a sum of multiple exponential behavior decays [30]. The measured curves can be nicely fitted with bi-exponential function I(t)=A1 exp(-t/τ2) + A2 exp(-t/τ2), where Ai is the exponential coefficient (%) for the ti decay times [31]. The average lifetime is calculated according to the equation 〈τ〉= (A1τ1 + A2τ2)/(A1 + A2). The fitted results are shown in Table 1. With the increment of donor component (the weight ratio of donor increases from 20% to 80%), the lifetime of the slow decay component decreases from 61.7 ps to 38.6 ps. The average lifetime obviousely decreased from 93.56 ps to 62.95 ps, then increased to 70.39 ps. The energy transfer efficiency (E) values were calculated using Eq. (1).

|
(1) |
|
|
Table 1 Fitting parameters for corresponding fluorescencedecay profiles of various D: A blend ratios with pump intensity of 3 mW. |
Where τDA and τD are the fluorescence lifetime of donor in the presence and absence of the acceptor, respectively. From the fluorescence decay lifetimes, we could obtain the energy transfer efficiency, increasing from 77.0%–84.5%, then decreasing to 82.7%. This demonstrates optimised D: A ratio can promote rapid exciton dissociation at the donor/acceptor interface. In order to investigate the effect of pump intensity to fluorescence decay dynamics, various intensity are uesd to excite the samples. The fluorescence decay times and corresponding fluorescence decay profiles are shown in Fig. S2 and Tables S1-S3 (Supporting information). With the increment of pump intensity, the fluorescence lifetime decreases suggested exiton-excitoninteraction, while the change tendency of lifetime is consistent [32].
Femtosecond transient absorption (TA) spectroscopy was performed to probe the effect of various D: A blend ratios on charge-transfer dynamics in the BHJ blend films. The TA spectra for neat PBDB-T and various D: A ratio blend films at several delay times are shown in Fig. 3. The kinetic profiles are shown in Fig. S1d (Supporting information) probing at 630 nm. TA spectra are made up of two parts, negative signature of ground state bleaching (GSB) characteristics and positive signature attributed to excited state absorption (ESA). In order to detect spectral and temporal characteristics of charge generation dynamics, we specifically selected excitation wavelength at 470 nm to guarantee that there is negligible excitation of IT-M [33]. As described in Fig. 3h, two negative signals peaked at 580 nm and 630 nm appear in both neat PBDB-T and the blend, matching with the absorption peak of PBDB-T. The negative signals can be attributed to the GSB of the transition in PBDB-T naturally, which means the depletion of the ground state and/or the filling of the excited state by the photoinduced singlet excitons [34]. These excitons can also induce extra absorption of the incident photons, forming ESA signals, as observed in the range of 650–750 nm [35]. The ESA signals nearly decay to zero within 10 ps that can attribute to the quick singlet exciton recombination process. However, the long-lived GSB signals (> 1 ns) were observed in the spectrum, which may be originated from the formation of triplet excitons [35]. Figs. 3a-g depict the TA spectra of films with various D: A blend ratios. As indicated in the legend, the long-lived negative signals may be originated from the free charge carriers generated by the charge transfer states at the interface of PBDB-T and IT-M [34]. With the decrease of donor components, positive signals ranged from 650 nm to 680 nm gradually weaken until they disappear, while negative signals in the range of 680–735 nm with a peak around 700 nm and another positive signal peak at 760 nm were observed. In the system of PBDB-T and IT-M, on the one hand, we assume that the singlet excitons can form charge transfer states at a short time scale. Therefore, photoinduced singlet excitons can form charge transfer states immediately instead of being excited to higher excitation states. On the other hand, the gradually decreased ESA signals of PBDB-T manifest the decreased formation of triplet states and the reduced energy loss.

|
Download:
|
| Fig. 3. Transient absorption spectra with a 470 nm pump light at different time delays of blend films with various weight ratio of donor (a) 20%, (b) 30%, (c) 40%, (d) 50%, (e) 60%, (f) 70%, (g) 80% and (h) neat PBDB-T. | |
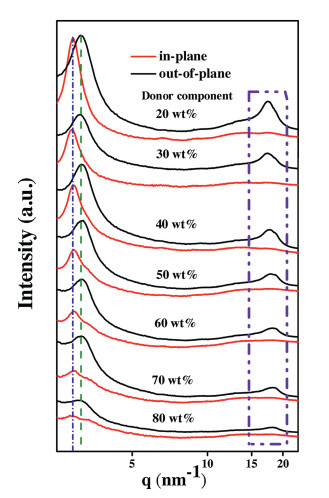
The nanomorphology of the active layer plays a vital role in influencing the efficient exciton diffusion and dissociation, and charge transport [14, 36]. AFM, GIWAXS and GISAXS were carried out to investigate the microstructures of PBDB-T: IT-M blend films with various ratios (Fig. 4). As shown in Fig. 4h and i, the neat PBDB-T and IT-M films show distinctly different surface and bulk morphologies. The neat IT-M film shows a smooth surface (RMS = 0.89 nm), implying that the aggregate sizeobversed at the surface is small. The neat PBDB-T films shows a rougher surface with RMS = 1.82 nm. As depicted in Fig. 4 and Fig. S3 (Supporting information), all the blend films show very similar surface (RMS is about 2.5 nm). Due to the low content of PBDB-T (the weight ratio of donor from 20% to 40%), fibril-like domains permeate in the whole area of the image (Figs. 4a-c). As described in previous work, the morphologies of the blended films are mainly determined by the polymer because PBDB-T may self-assemble to form nanoscals aggregates on the surface in solid blend films because of its strong aggregation effect in the solution state [24, 37]. In order to obtain more detailed morphological information on the nanoscale in various D: A blend ratio, GIWAXS and GISAXS to quantify the correlationlength of each component in the BHJ. The 2D GIWAXS patterns of PDBD-T: IT-M with various D: A ratios are shown in Fig. S4 (Supporting information), with 1D profiles in the out-of-plane and in-plane directions are plotted in Fig. 5. From Fig. 5, we found that the lamellar (100) diffraction peaks of PBDB-T in the in-plane and out-of-plane are located at 3.1 nm-1 and 3.3 nm-1, respectively. It is consistent with literature report [19, 32]. The intensity of peaks was enhanced upon increasing the donor component (the weight ratio of donor from 20% to 80%). The (010) π-π stacking peaks of PBDB-T and IT-M are located at about 17.97 nm-1 and about 18.35 nm-1, respectively. Whenthe weight ratio of donor is 20% and 80%, we found that the sample with 20 wt% donor proportion shows stronger (010) peak. This suggested that the increased π-π stacking peak intensity is attributed to the increased PDBD-Tcomponent. The coherence length and π-π stacking distance (d-spacing), obtained through L = 2π/△q and d = 2π/q, are described in Table S4 (Supporting information). where △q is full width at half maximum of each peak and q is the location of the peak. The d-spacing of PBDB-T and IT-M does not show significant changes with different D: A ratio, the distance of π-π stacking corresponding to molecular packing has not changed significantly. The coherence length of IT-M decreased from 3.00 nm to 2.01 nm, while that of PBDB-T increased from 1.65 nm to 2.43 nm. The enlarged coherence lengthis beneficial to charge transport and mitigation of bimolecular recombination [38, 39]. In PBDB-T: IT-M system, we assume optimized D: A ratio can obtain faster charge transport, achieving high-performance devices. 2D GISAXS patterns of PBDB-T: IT-M films with various blend ratios are shown in Fig. S5 (Supporting information), with the 1D profiles in the low-Q range (0.038-0.2 nm-1) plotted in Fig. 6a. With the D: A blend ratios increasing from 1:4 to 4:1, the diffraction intensity significantly increases, indicating the crystallinity of PBDB-T is enhanced. It is consistent with GIWAXS results. To obtain detailed structual information on IT-M aggregates, the Guinier approximation was applied to quantitatively calculate the radius of gyration (Rg) of a IT-M cluster,

|
(2) |

|
Download:
|
| Fig. 4. AFM height images ofvarious weight ratio of donor: (a) 20%, (b) 30%, (c) 40%, (d) 50%, (e) 60%, (f) 70%, (g) 80%, (h) neat PBDB-T and (i) neat IT-M. | |

|
Download:
|
| Fig. 5. 1D cuts of 2D GIWAXS patterns to PBDB-T: IT-M blend films with the various D: A ratios. | |

|
Download:
|
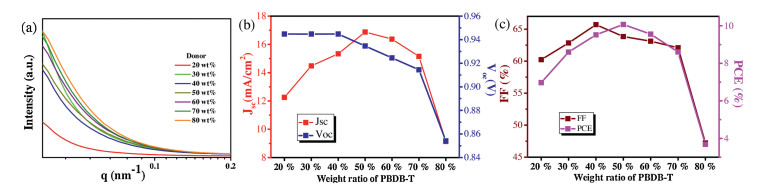
| Fig. 6. (a) GISAXS profiles along qy axis. (b, c) The photovoltaic parameters of the OSCs based on PBDB-T and IT-M with the various D: A ratio under the illumination of AM 1.5 G, 100 mW/cm2. | |
where I(Q) is the scattering intensity and I(0) is the scattering intensity at Q = 0, which Q given by Q = 4πsin(θ/2)/λ, and θ and λ as the scattering angle and the incident wavelength, respectively. The value of R is obtained by taking the slope of the linear correlation between ln(I(q)) and q2 using Eq. 2. Two fitting lines are used to decrease experimental error [30, 40]. The detailed data are shown in the inset of Fig. S6a (Supporting information).The average radius of IT-Mdomains decrease from 102.3 to 67.2 with the increase of donor content. Although larger polymerdomains are beneficial for charge transport in the active layer, they also hamper efficient exciton dissociation, therefore bothprocesses should be balanced appropriately [37, 41]. It is well in agreement with the results of the time-resolved fluorescence measurment.
To assess the various D: A blend ratios of the active layer on device performance, we have studied the photovoltaic properties of PBDB-T: IT-M solar cells in conventional configurations. The J-V characteristics of the devices are plotted in Fig. S6b (Supporting information). Table S5 (Supporting information) summarized the performance parameters of the devices. Whenthe weight ratio of donor is 50% (the D: A blend ratio is 1:1), the optimized device has a Voc of 0.93 V, a Jsc of 16.9 mA/cm2 and FF of 63.9%, achieving a best PCE of 10.1%. It is consistent with previously reported work [37]. In order to reveal the effect of D: A blend ratio of photovoltaic parameters, the Jsc, Voc, FF and PCE values versus D: A ratios are plotted in Figs. 6b and c. The decrease of Voc can be attributed to the increase of energy loss upon the increase of PBDB-T component. It is well in agreement with TA results that the increased formation of triplet states may increase the energy loss. As previously reported [42], excitons rapidly migrate from the disordered domains to the ordered regions and then diffuse within the ordered regions. We infer that changes in Jsc can be attributed to the variety in the donor/acceptor interface and crystallization.
In summary, we systematically studied the effect with various D: A blend ratios onthe charge transfer and energy transfer dynamics of the organic photovoltaic device. The TA result shows optimized D: A blend ratios are beneficial to forming chare transfer states and suppressing the formation of triplet states and therefore reducing energy loss. Rational D: A blend ratios can provide appropriate donor/accepter surface of charge transfer which has been powerfully verified by our detailed experimental results from PL, the time-resolved fluorescence measurement and AFM. GIWAXS and GISAXS measurement results reveal that optimized D: A blend ratios can optimize coherence length and crystallinity, which would improve charge generation, separation, and collection. Overall, our work comparatively investigated the effect of various D: A blend ratios on the BHJ photovoltaic device, which would be helpful to exploit the potential of binary systems to boost photovoltaic performance.
Declaration of competing interestTo the best of our knowledge, the named authors have no conflict of interest, financial or otherwise.
AcknowledgmentsThis work was supported by the National Natural Science Foundation of China (Nos. 11774204, 11804084). L. Feng and X.T. Hao acknowledgethe Major Program of Natural Science Foundation of Shandong Province (No. ZR2019ZD43). X.J. Feng acknowledges the Fundamental Research Funds of Shandong University (No. 2018JC034). X.T. Hao also acknowledges support from the ARC Centre of Excellence in Exciton Science (No. CE170100026). The authors would like to thank the Shanghai Synchrotron Radiation Facility (beamline BL16B1) for providing the beam time for GIWAXS measurements.
Appendix A. Supplementary dataSupplementary material related to this article can be found, in the online version, at doi:https://doi.org/10.1016/j.cclet.2020.02.013.
| [1] |
P. Cheng, G. Li, X. Zhan, Y. Yang, Nat. Photonics 12 (2018) 131-142. DOI:10.1038/s41566-018-0104-9 |
| [2] |
C. Zhang, R. Liu, C.H. Mak, et al., J. Photonics Energy 8 (2018) 021001. |
| [3] |
X. Ma, Z. Xiao, Q. An, et al., J. Mater. Chem. A 6 (2018) 21485-21492. DOI:10.1039/C8TA08891H |
| [4] |
Y. Li, G. Xu, C. Cui, Y. Li, Adv. Energy Mater 8 (2018) 1701791. DOI:10.1002/aenm.201701791 |
| [5] |
Y. Cui, C. Yang, H. Yao, et al., Adv. Mater 29 (2017) 1703080. DOI:10.1002/adma.201703080 |
| [6] |
S. Gelinas, A. Rao, A. Kumar, et al., Science 343 (2014) 512-516. |
| [7] |
J. Hou, O. Inganas, R.H. Friend, F. Gao, Nat. Mater. 17 (2018) 119-128. DOI:10.1038/nmat5063 |
| [8] |
W. Wang, C. Yan, T.K. Lau, et al., Adv. Mater. 29 (2017) 1701308. DOI:10.1002/adma.201701308 |
| [9] |
X. Xu, K. Feng, Z. Bi, et al., Adv. Mater. 31 (2019) 1901872. DOI:10.1002/adma.201901872 |
| [10] |
S.M. Falke, C.A. Rozzi, D. Brida, et al., Science 344 (2014) 1001-1005. DOI:10.1126/science.1249771 |
| [11] |
H. Yan, J.G. Manion, M. Yuan, et al., Adv. Mater. 28 (2016) 6491-6496. DOI:10.1002/adma.201601553 |
| [12] |
M.M. Tavakoli, H.T. Dastjerdi, J. Zhao, et al., Small 15 (2019) 1900508. DOI:10.1002/smll.201900508 |
| [13] |
J. Mayer, B. Gallinet, T. Offermans, R. Ferrini, Opt. Express 24 (2016) A358-A373. DOI:10.1364/OE.24.00A358 |
| [14] |
F. Zhao, C. Wang, X. Zhan, Adv. Energy Mater. 8 (2018) 1703147. DOI:10.1002/aenm.201703147 |
| [15] |
B.C. Thompson, J.M.J. Frechet, Angew. Chem. Int. Ed. 47 (2008) 58-77. DOI:10.1002/anie.200702506 |
| [16] |
D. Qian, W. Ma, Z. Li, et al., J. Am. Chem. Soc. 135 (2013) 8464-8467. DOI:10.1021/ja402971d |
| [17] |
J. Yuan, H. Dong, M. Li, et al., Adv. Mater. 26 (2014) 3624-3630. DOI:10.1002/adma.201305577 |
| [18] |
T. Kim, J.H. Kim, T.E. Kang, et al., Nat. Commun. 6 (2015) 8547. DOI:10.1038/ncomms9547 |
| [19] |
S. Li, L. Ye, W. Zhao, et al., Adv. Mater. 28 (2016) 9423-9429. DOI:10.1002/adma.201602776 |
| [20] |
D. Qian, L. Ye, M. Zhang, et al., Macromolecules 45 (2012) 9611-9617. DOI:10.1021/ma301900h |
| [21] |
B. Huang, L. Chen, X. Jin, et al., Adv. Funct. Mater. 28 (2018) 1800606. DOI:10.1002/adfm.201800606 |
| [22] |
J. Clark, J.F. Chang, F.C. Spano, R.H. Friend, C. Silva, Appl. Phys. Lett 94 (2009) 163306. DOI:10.1063/1.3110904 |
| [23] |
X. Guo, M. Zhang, J. Tan, et al., Adv. Mater. 24 (2012) 6536-6541. DOI:10.1002/adma.201202719 |
| [24] |
W. Zhao, D. Qian, S. Zhang, et al., Adv. Mater. 28 (2016) 4734-4739. DOI:10.1002/adma.201600281 |
| [25] |
Y. Liu, J. Zhao, Z. Li, et al., Nat. Commun. 5 (2014) 5293. DOI:10.1038/ncomms6293 |
| [26] |
Z. Liang, J. Tong, H. Li, et al., J. Mater. Chem. A 7 (2019) 15841-15850. DOI:10.1039/C9TA04286E |
| [27] |
L. Feng, P.Q. Bi, X.Y. Yang, et al., Org. Electron. 57 (2018) 140-145. DOI:10.1016/j.orgel.2018.02.044 |
| [28] |
D.M. Stoltzfus, J.E. Donaghey, A. Armin, et al., Chem. Rev. 116 (2016) 12920-12955. DOI:10.1021/acs.chemrev.6b00126 |
| [29] |
V. Gupta, V. Bharti, M. Kumar, S. Chand, A.J. Heeger, Adv. Mater. 27 (2015) 4398-4404. DOI:10.1002/adma.201501275 |
| [30] |
X. Yang, F. Zheng, W. Xu, et al., ACS Appl. Mater. Interfaces 9 (2017) 618-627. DOI:10.1021/acsami.6b11063 |
| [31] |
X. Wen, P. Yu, Y.R. Toh, et al., J. Mater. Chem. C 2 (2014) 3826-3834. DOI:10.1039/C3TC32376E |
| [32] |
Z. Wen, X. Ma, X. Yang, et al., Chin. Chem. Lett. 30 (2019) 995-999. DOI:10.1016/j.cclet.2019.01.028 |
| [33] |
T. Hou, F. Liu, Z. Wang, et al., Adv. Optical Mater 6 (2018) 1800027. DOI:10.1002/adom.201800027 |
| [34] |
F. Jin, G. Ding, Y. Wang, et al., J. Phys. Chem. C 121 (2017) 8804-8811. DOI:10.1021/acs.jpcc.7b03001 |
| [35] |
P. Bi, T. Xiao, X. Yang, et al., Nano Energy 46 (2018) 81-90. DOI:10.1016/j.nanoen.2018.01.040 |
| [36] |
B.C. Thompson, J.M.J. Frechet, Angew. Chem. Int. Ed. 47 (2008) 58-77. DOI:10.1002/anie.200702506 |
| [37] |
W. Li, J. Cai, Y. Yan, et al., Solar RRL 2 (2018) 1800114. DOI:10.1002/solr.201800114 |
| [38] |
G. Zhang, K. Zhang, Q. Yin, et al., J. Am. Chem. Soc. 139 (2017) 2387-2395. DOI:10.1021/jacs.6b11991 |
| [39] |
P. Bi, X. Hao, Solar RRL 3 (2018) 1800263. |
| [40] |
C.K. Lyu, F. Zheng, B.H. Babu, et al., J. Phys. Chem. Lett. 9 (2018) 6238-6248. DOI:10.1021/acs.jpclett.8b02701 |
| [41] |
Y. Huang, E.J. Kramer, A.J. Heeger, G.C. Bazan, Chem. Rev. 114 (2014) 7006-7043. DOI:10.1021/cr400353v |
| [42] |
X.H. Jin, M.B. Price, J.R. Finnegan, et al., Science 360 (2018) 897-900. DOI:10.1126/science.aar8104 |