 2021, Vol. 32


b Hunan Key Laboratory of Biomedical Nanomaterials and Devices, Hunan University of Technology, Zhuzhou 412007, China
Accompanying the development of biomaterials [1-17] and biosensors [18-31], recently, aptamers have attracted a good many of interests from scientists [32-36], and have also found some actual or potential applications in various fields [37-41]]. For example, aptamers can be applied in biosensors [42-47], targeted drug delivery [48-50], etc. [51-55]. Nucleic acid aptamers are oligonucleotide chains with specific permutation sequences, which have the ability to identify and specifically bind to targets such as proteins, and are also known as chemical antibodies [56-59]. Compared with antibodies with similar functions, it has the advantages of easy synthesis, small batch gap, high binding affinity, and can be screened against unknown targets [60-62].
Among the researches and applications of aptamers, to get special aptamers probes is essential [63-69], and the cell-based aptamer screening is usually performed as a process of continuously enriching the desired bands from random libraries containing 1013–1016 single-stranded DNA or single-stranded RNA samples with different sequences and finally obtaining one or more high affinity single-stranded nucleic acids [70-74].
However, there are significant differences between cell-based systematic evolution of ligands by exponential enrichment (cell-SELEX) and traditional protein-based aptamer screening [75-77]. In aptamer screening of proteins, we use purified proteins as targets. But the specific conditions of target cells are unknown during cell-SELEX. In other words, aptamers can be applied to complete cell screening without knowing the distribution of proteins on the cell surface, thus realizing the purpose of distinguishing different cells or different subtypes of the same cell.
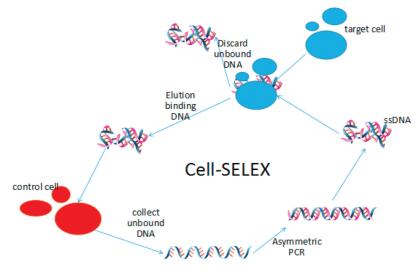
Random libraries were first synthesized and incubated in conjunction with target cells, and bands that could not be bound were washed away. Next, the bands bound to the cells were collected, amplified by asymmetric PCR, and the obtained products served as the templates for the next round of screening libraries and the incubation process with the target cells was repeated. After that, besides using target cells for screening, reference group cells are added for reverse screening (usually normal cells corresponding to target tumor cells) in each round of experiments. In this process, bands that can bind to reference group cells are discarded, and unbound bands are collected for asymmetric PCR amplification as the screening raw materials for the next round (Fig. 1) [78]. Repeat the above process until about 16 rounds, when the binding degree of oligonucleotide bands to cells is no longer significantly changed with the increase in screening rounds observed by flow cytometry, it can be preliminarily considered that the corresponding nucleic acid aptamers have been obtained, and then validate and characterize them to determine their ability as nucleic acid aptamers.

|
Download:
|
| Fig. 1. Technological process of cell-SELEX. | |
Because of the ability of aptamers to screen unknown targets, they are now also applied in many aspects of cancer research. For example, using aptamers to directly identify tumor cells, constructing sensors to detect tumor cells [79], using aptamers to achieve fluorescence imaging [80], using aptamers for drug targeting therapy [81, 82]. In this review, the use of aptamers for the extraction of membrane proteins on the surface of tumor cells and the discovery of novel biomarkers for tumor diagnosis and treatment is also a hot topic of research.
2. From nucleic acid aptamers to novel tumor markersMembrane proteins are important mediators of cellular communication with the outside world [83-86]. Changes in cell surface membrane proteins usually indicate a series of changes in cell state that also occur between normal cells and corresponding tumors. Therefore, many scientists currently use membrane proteins as markers to distinguish tumor cells from normal cells [87-91]. However, how to obtain tumor cell-specific membrane protein markers? Because of their ability to distinguish tumor cells from normal cells without known targets, aptamers have been widely used to screen tumor markers for membrane proteins [92-98].
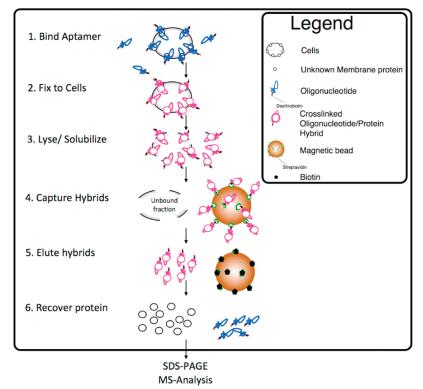
The basic steps of a round of screening experiments for tumor cell markers for membrane proteins are as follows (Fig. 2). Firstly, the corresponding tumor cell aptamer is obtained. Secondly, the selected aptamer is incubated with the tumor cells and the excess is washed away with a detergent solution. The cells were then treated with lysates and the proteins bound to the aptamers in the mixture were captured and eluted with magnetic beads. The target proteins were then separated by SDS electrophoresis. Finally, mass spectrometry analysis was performed to identify the obtained proteins and select candidate markers from them [92].

|
Download:
|
| Fig. 2. Experimental flow of membrane protein extraction based on aptamer. Reprint with permission [92]. Copyright 2014, American Chemical Society. | |
The ability of aptamers to screen cells without knowing the specific target has led many scientists to identify novel protein markers in tumor cells. Shangguan et al. [72] discovered protein tyrosine kinase 7 (PTK7) as a potential biomarker for T-cell acute lymphoblastic leukemia (T-ALL) through nucleic acid aptamer. Jia et al. [95] discovered CD109 as a potential biomarker for nasopharyngeal carcinoma through nucleic acid aptamer. However, obtaining a protein target is not the end of the experiment, further characterization of its ability as a biomarker is also needed. This is the reason why we discuss the characterization techniques used in the identification of protein in this review. We hope to discuss the standard flow of such verification through analyzing the commonly used protein characterization methods, furthermore, propose suggestions on such experiments.
3. Protein characterization techniques 3.1. Small interfering RNA blockingSmall interfering RNA (siRNA), sometimes called short interfering RNA or silencing RNA, was first discovered by David Baulcombe's team in the UK as part of the post-transcriptional gene silencing phenomenon in plants. Subsequently in 2001, Thomas Tuschl's team discovered that synthetic siRNAs can be used to induce RNAi action in mammals, and this discovery led to the use of controllable RNAi for biomedical research and drug development [99-101]. SiRNA is a double-stranded RNA of 20–25 bases in length, each with a short 5′-phosphate end and a 3′-hydroxyl end containing two sticky nucleotide ends.
SiRNA is mainly involved in the phenomenon of RNA interference (RNAi), which can regulate gene expression, and this process has great specificity. It can interfere with the mRNA that complements a specific gene and is responsible for its translation process, thereby rendering the corresponding protein unable to be expressed. SiRNAs are double strand RNAs (dsRNAs) that are cleaved intracellularly by RNase III (such as Dicer) into 20–25 bp-sized double strand RNAs. DsRNAs can be either endogenous or exogenous, and dsRNAs produced by cells themselves are formed by endogenous single-stranded RNA under the action of RNA polymerase, while those manually introduced or replicated by viral RNA belong to the external source of dsRNAs [102-104]. Because theoretically any gene can be blocked by artificial synthesis of the corresponding siRNA with complementary sequences, siRNA is an important tool for validating gene function and guiding drug delivery in the current post-genomic era [105-109].
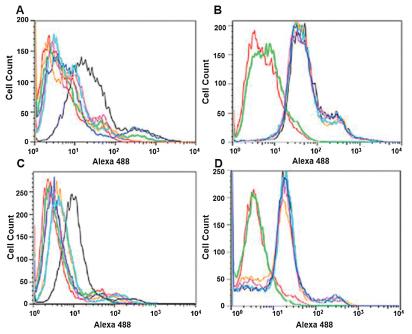
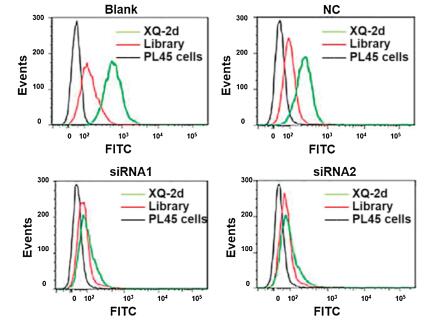
Therefore, this method can also be used to validate the corresponding membrane proteins obtained in the aptamer-based membrane protein extraction experiments [92, 93, 110]. Since our aim is to demonstrate whether the membrane proteins obtained in the experiment specifically bind to the aptamers we selected, an experimental idea is to knock out the mRNA responsible for the expression of this membrane protein in cells, and then let the cells incubate with the aptamers to observe the binding effect. If the cell still binds closely to the aptamer when it does not express the corresponding membrane protein, it can be explained that the obtained protein is not the target of the aptamer, which further proves that it cannot be used as a new tumor marker, and vice versa, it can be indicated that this protein has the potential as a new tumor marker and can be further detected. Van Simaeys et al. [92] used this method to validate the potential tumor marker STIP1 protein obtained by TOV6 aptamer screening against ovarian cancer cells (Fig. 3). They used TOV-21-G cells and A172 cells to incubate with TOV6 (A, C), in order to prevent the possible effects of STIP1 siRNA on other unrelated proteins, they used TOV-21-G cells and A172 cells to incubate with Sgc8 adaptor (corresponding to PTK7 protein) (B, D), all the four groups of cells were treated with STIP1 siRNA. To obtain the experimental results flow cytometry was used to measure the fluorescence intensity to characterize the binding of aptamers to cells in the four groups, respectively. Wu et al. [93] similarly used this approach by treating PL45 cells with two siRNAs targeting the CD71 protein and incubating cells before and after treatment with fluorescent XQ-2d adaptors, demonstrating that the CD71 protein is a specific binding site for the XQ-2d adaptor (Fig. 4).

|
Download:
|
| Fig. 3. Effect of siRNA treatment on the binding ability of TOV6 aptamer to ovarian cancer cells. Red: streptavidin; Green: library processing; Black: scrambled siRNA; other different colors correspond to different siRNA sequences of the same target protein. Reprint with permission [92]. Copyright 2014, American Chemical Society. | |

|
Download:
|
| Fig. 4. Validation of the binding of PL45 cells to aptamers before and after siRNA treatment. Reprint with permission [93]. Copyright 2019, American Chemical Society. | |
Immunofluorescence co-localization is a common method to study the interaction between several proteins [111-113]. This technique is based on the principle of antigen-antibody reaction [114], labeling known protein antibodies with fluorescent groups, and then using fluorescent antibodies as probes to detect corresponding antigens in cells. By observing the fluorescence under the fluorescence microscope, we can determine the nature of intracellular antigen and locate it, and further compare the differences of intracellular protein expression and cell localization in experimental groups under different conditions [115-118]. Immunofluorescence co-localization is the cytological evidence of direct or indirect interaction between the two proteins. If protein A itself is located in the x-organelle of the cell, and when protein A and protein B are simultaneously expressed, protein A and protein B are co-located in the y-organelle, which means that the two proteins may interact.
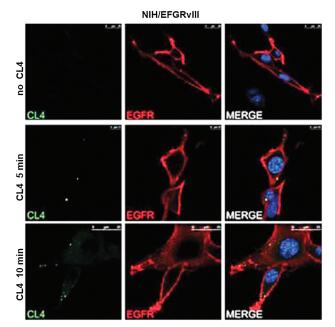
In the aptamer-based membrane protein extraction experiment, we need to demonstrate whether the membrane protein extracted in the experiment specifically combines with the aptamer as the raw material, which can be used to co-locate the aptamer, that is, the aptamer is modified by a fluorescence label, and the membrane protein is modified with another fluorescence label. Then they were incubated with the cells, and the position relationship of the two kinds of fluorescence in the same direction was observed by confocal microscope. If it is observed that the imaging position of the fluorescent group on the aptamer deviates from that of the protein antibody, the protein cannot be used as a specific tumor marker. In any case, it shows that the protein is specific binding to aptamer in a high confidence interval, which means that it has the potential to become a new tumor marker. Camorani et al. [94] used this technique to study the aptamer CL4 and its corresponding membrane protein EGFRvIII targeting glioblastoma multiforme (GBM). Epidermal growth factor receptor (EGFR) is an effective driver of glioblastoma multiforme, and its mutant EGFRvIII is considered to be a predictor of low survival rate. They first overexpressed EGFRvIII in mouse NIH3T3 fibroblasts, which had little expression of EGFRvIII. Secondly, they used FAM labeled CL4 to incubate cells to observe the location of aptamers. After incubation, the cells were fixed and labeled with fluorescent anti-EGFR antibody. The results in Fig. 5 showed that the CL4 aptamer could specifically bind to EGFRvIII protein, and showed the feasibility of EGFRvIII protein as a tumor marker.

|
Download:
|
| Fig. 5. NIH3T3 cells artificially over-expressing EGFRvIII were incubated with FAM-labeled CL4 for 5 and 10-min, and the cells were labeled with anti-EGFR antibodies after fixation. CL4 fluorescence is green, EGFRvIII fluorescence is red, and nucleus fluorescence is blue. Reprint with permission [94]. Copyright 2015, Camorani et al. | |
The application of enzymes plays an important role in human biological exploration, and many reactions are carried out by the catalysis of enzymes. Proteases are a general term for a class of enzymes that hydrolyze protein peptide chains. Different proteases act on specific kinds of peptide bonds, for example, trypsin is often used when digesting cells, which is responsible for hydrolyzing the peptide bonds formed by basic amino acids [119-123]. However, proteases cannot specifically digest a certain protein, which is non-selective in the process of digestion.
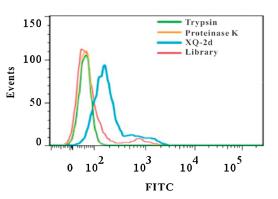
Therefore, when characterizing proteins obtained from aptamer-based membrane protein extraction experiments, the results obtained by protease digestion can only be used for rough judgment of the properties of proteins in pre-experiments or as an auxiliary judgment means. Wu et al. [93] also used this method at the beginning of their study by treating well-growing PL45 cells with trypsin and proteinase K for 10-min, respectively, and then incubating them with fluorescent XQ-2d aptamers. Through the result shown in Fig. 6, the author demonstrated that the atopic recognition target of the XQ-2d aptamer is a membrane protein.

|
Download:
|
| Fig. 6. PL45 cells were treated with trypsin and proteinase K, respectively, and incubated with XQ-2d aptamer, and the fluorescence intensity was measured by flow cytometry. Reprint with permission [93]. Copyright 2019, American Chemical Society. | |
Western blot is one of the common methods to detect proteins [124-127]. The mixed protein samples were first subjected to SDS-polyacrylamide gel electrophoresis (SDS-PAGE) to separate the proteins into different protein bands according to their molecular weights. Next, the protein bands on the SDS-polyacrylamide gel were transferred to the prepared solid-phase membrane. Subsequently, antigen-antibody binding reaction was used to detect the target protein, i.e., the solid-phase membrane was incubated with the corresponding antibody (primary antibody) of the target protein to capture the target protein. Afterwards, the solid-phase membrane was incubated with an enzyme-labeled antibody (secondary antibody) that could specifically bind to the primary antibody, allowing the labeled secondary antibody to bind to the primary antibody. Finally, the enzyme chromogenic reaction or luminescent substrate is used for incubation to obtain the bands of the target protein at one time. By analyzing the information of the bands, we can know the expression and content of the target protein in the samples to be detected [128-131].
This method is often used to characterize proteins obtained from aptamer-based membrane protein extraction experiments [94, 95, 132-135]. In some experiments, the specific binding of aptamers to proteins is directly demonstrated by detecting certain downstream reactions. Camorani et al. [94] demonstrated in this study that CL4 aptamer binds to EGFRvIII mutants on the surface of malignant glioma cells (U87MG), and further validated the significance of this binding process for tumor treatment (Fig. 7). In the experiment, Simona et al. incubated U87MG cells expressing EGFRvIII in a good growth state with CL4 adapter and CL4Sc obtained from their disordered treatment, respectively, using untreated cells as standard controls. Western blot was used to determine the ratio of pEGFR to total EGFR expression in each group of cells. It can be seen that the binding of CL4 aptamer to EGFRvIII successfully blocked the transfer process in the downstream reaction, demonstrating the specific binding of the two.

|
Download:
|
| Fig. 7. Western blot was used to measure the expression of pEGFR and EGFR in untreated, CL4Sc-treated and CL4-treated U87MG cells, and the ratio of pEGFR to EGFR expression was marked. Reprint with permission [94]. Copyright 2015, Camorani et al. | |
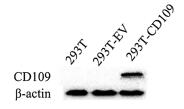
In some other experiments this technology is applied as an auxiliary means to simply detect the expression of target proteins in cells, so as to provide a basis for subsequent validation. For example, Jia et al. [95] chose the method of transfecting the protein in cells that do not express the target protein for subsequent detection in the experiment to verify the specific binding of the target protein to the aptamer. They used Western blot to detect the content of CD109 in human renal epithelial cells (239-T), 239-T cells transfected with empty vector and 239-T cells transfected with CD109 vector (Fig. 8). On the one hand, it proved the success of transfection; on the other hand, it also excluded the possible background interference of selected host cells, providing a guarantee for the feasibility of subsequent experiments.

|
Download:
|
| Fig. 8. Western blot was used to measure the expression of CD109 in untreated and 239-T cells treated with empty vector and vector loaded with CD109, respectively. Reprint with permission [95]. Copyright 2016, Jia et al. | |
Mass spectrometry is a common method to study proteins [136]. Its principle is to digest proteins into small peptide chain mixtures using proteases, which are ionized to form charged particles in the mass spectrometer, and then separated by the electric field and magnetic field treatment of the mass spectrometer according to different mass-to-charge ratios (m/z). Then, the separated peptide chain fragments were collected by the detector, and the m/z of each part was determined to obtain the overall spectrum of all fragments of the measured protein, that is, the first-order mass spectrometry peak map of the protein. At the same time, the fragments with higher abundance were selected by ion-selective device, and the secondary mass spectra of proteins were obtained by further analysis and mapping. By comparing the peak maps of primary mass spectrometry and secondary mass spectrometrywith those of standard proteins, the information of the detected proteins can be obtained [137-139].
Common MS methods are divided into MALDI-MS and ESI-MS [140, 141]. Compared with the latter, although the ionization speed is lower than the ESI-MS, the MALDI-MS has higher ionization degree for the sample and less loss to the sample due to more controllable laser energy. Meanwhile, MALDI-MS often outper-forms ESI-MS in the analysis of targets with larger molecular weight.
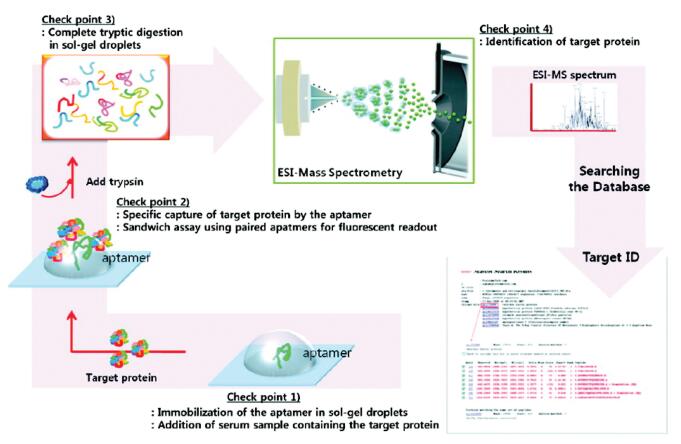
In characterizing proteins obtained from aptamer-based membrane protein extraction experiments, there are generally two purposes for using mass spectrometry techniques. The first purpose is in the preliminary analysis of the extracted protein fragments, such applications generally analyze the overall mass spectra of the obtained proteins and compare them with the mass spectra of various membrane proteins known in the database, in which potential candidates for protein species are selected for further screening. ESI-MS technology is used in an aptamer microarray platform designed by Ahn et al. [96] to detect low-abundance targets in complex serum samples. They used aptamer microarrays to capture protein targets, digested them directly in situ and detected them by mass spectrometry, and compared the obtained information with existing databases to preliminarily speculate that proteins among them could be used as detection targets (Fig. 9).

|
Download:
|
| Fig. 9. In situ digestion of protein targets captured by aptamer microarrays and ESI-MI mass spectrometry detection were performed, and the obtained information was compared with existing literature databases. Reprint with permission [96]. Copyright 2010, American Chemical Society. | |
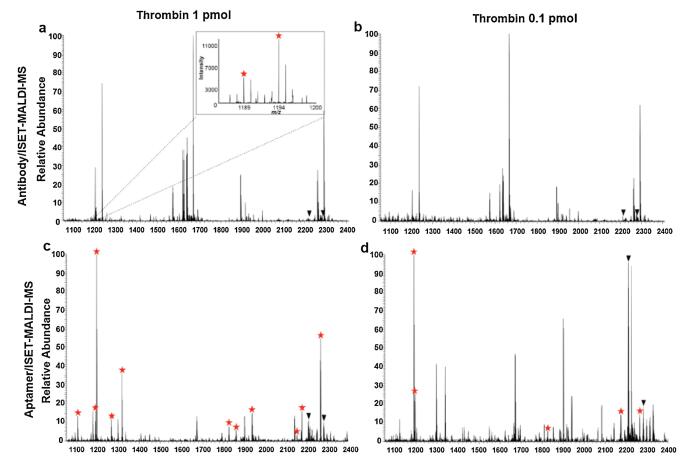
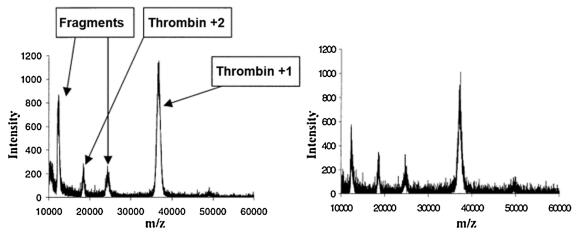
The second purpose is to analyze the specific binding mechanism between the protein and the aptamer after determining the type of protein obtained. The principle of this application is to incubate the aptamer with the target protein under ultraviolet irradiation, and the cross-linked fragments formed by the two will change the original mass spectra of the protein. The cross-linked mixture was digested directly and measured by mass spectrometry. The obtained mass spectra were compared with the mass spectra of the protein itself. The changes of amino acid residues in the mass spectra before and after the binding of the aptamer to the protein were analyzed to know whether the two had specific binding and the specific situation of the binding site. Lee et al. [97] analyzed the binding effect of thrombin-binding antibodies and aptamers to thrombin using MALDI-MS (Fig. 10), and the characteristic binding peaks were marked with red. Dick & Mcgown [98] used another idea to analyze the results of MALDI-MS. They measured the individual mass spectrum of thrombin and the mass spectrum of the aptamer immobilized on the solid phase carrier after incubation with thrombin rinse (Fig. 11). The specific binding of the aptamer to thrombin was verified by finding out the characteristic peaks of the representative thrombin contained in both.

|
Download:
|
| Fig. 10. (a, b) MADLI-MI peak map after incubation of thrombin-binding antibody with thrombin. (c, d) MADLI-MI peak map after incubation of aptamer with thrombin. Reprint with permission [97]. Copyright 2014, American Chemical Society. | |

|
Download:
|
| Fig. 11. Left: MADLI-MI peak map of thrombin; Right: MADLI-MI peak map of aptamer immobilized on solid phase carrier after incubation with thrombin rinse. Reprint with permission [98]. Copyright 2004, American Chemical Society. | |
Carcinogenesis is a multistage process in which changes happen in a range of genes, proteins and other molecules. Among these molecules, membrane proteins are considered to be the most appropriate biomarkers. The discovery of a membrane protein that can be used to specifically identify tumor cells has many benefits, and can allow scientists not only to understand how tumors develop, but also to use it as a tumor marker to develop new treatments. However, obtaining proteins does not mean that tumor marker screening experiments are successful. Further characterization of the specific binding capacity of proteins and tumor cell aptamers is still needed. There is no universal and precise standard process for this step. In characterizing the acquired proteins, we must remember what the purpose of doing so is. In oncology, the ultimate goal of extracting cell surface proteins is to identify targets that can be used as new tumor markers. Therefore, our judgment on the advantages and disadvantages of the characterization techniques mainly depends on whether they can be used to verify the ability of the obtained protein as a tumor marker.
Starting from the principles of five common protein characterization methods, this review focuses on their application ideas, advantages and disadvantages, and feasibility in characterizing proteins obtained from aptamer-based membrane protein extraction experiments. SiRNA blockade, which cuts off protein expression by directly blocking the transcription of RNA to protein, is a very precise method to analyze whether the protein binds to the aptamer, but the technical difficulty is higher and the results obtained are not intuitive enough. In contrast, the results obtained by immunofluorescence co-localization method are very intuitive. It directly demonstrates whether the aptamer in the experiment binds to the protein by position comparison, but the problem with the same method is that false positive results are likely to occur and the reaction between the two cannot be verified in principle. Protease digestion is the easiest of these methods to operate, however it is only used as an auxiliary means because it is not selective. Western blot combines intuition and clarity of principle. It can not only qualitatively analyze the presence or absence of proteins, but also quantitatively monitor downstream reactions and demonstrate the specific binding of aptamers to proteins from multiple angles. The results of mass spectrometry (MADLI-MS and ESI-MS) are highly reliable, and it is the only one of these characterization methods which can directly analyze the specific information of the cross-linking region when an aptamer binds to a protein. In summary, different characterization methods have their own advantages and disadvantages in reliability, accuracy, practicability, intuition, etc. When we characterize the proteins obtained from the aptamer-based membrane protein extraction experiment, we must carefully consider, select according to the specific situation in the experiment, and combine the above various commonly used protein analysis methods to obtain accurate conclusions.
Declaration of competing interestThe authors declare no competing financial interest.
AcknowledgmentsThis work was financially supported by the National Key Researchand Development Program of China (No. 2018YFC1602905), National Natural Science Foundation of China (Nos. 81902153, 61871180, 61527806).
| [1] |
Z.P. Zhang, S.W. Tan, S.S. Feng, Biomaterials 33 (2012) 4889-4906. DOI:10.1016/j.biomaterials.2012.03.046 |
| [2] |
J.K.F. Suh, H.W.T. Matthew, Biomaterials 21 (2000) 2589-2598. DOI:10.1016/S0142-9612(00)00126-5 |
| [3] |
Z.Y. He, C.L. Tang, X. Chen, et al., Mater. Express. 9 (2019) 956-961. DOI:10.1166/mex.2019.1579 |
| [4] |
L. Jin, Y. Deng, N.Y. He, L.J. Wang, M.L. Weng, J. Biomed. Nanotechnol. 14 (2018) 546-552. DOI:10.1166/jbn.2018.2545 |
| [5] |
Y.X. Lai, C.X. Zhang, Y. Deng, et al., Chin. Chem. Lett. 30 (2019) 160-162. DOI:10.1016/j.cclet.2018.07.011 |
| [6] |
M. Geetha, A.K. Singh, R. Asokamani, A.K. Gogia, Prog. Mater. Sci. 54 (2009) 397-425. DOI:10.1016/j.pmatsci.2008.06.004 |
| [7] |
M. Hussain, M. Lv, X.H. Dong, et al., J. Nanosci. Nanotechnol. 20 (2020) 4047-4056. DOI:10.1166/jnn.2020.17491 |
| [8] |
Z. Chen, H.W. Yang, J. Peng, et al., Nanosci. Nanotechnol. Lett. 10 (2018) 23-31. DOI:10.1166/nnl.2018.2597 |
| [9] |
G.J. Yang, Y.X. Lai, Z.Q. Xiao, C.L. Tang, Y. Deng, Chin. Chem. Lett. 29 (2018) 1857-1860. DOI:10.1016/j.cclet.2018.11.030 |
| [10] |
A. Meyer, J. Auemheimer, A. Modlinger, H. Kessler, Curr. Pharm. Design. 12 (2006) 2723-2747. DOI:10.2174/138161206777947740 |
| [11] |
H. Xie, K.L. Di, R.R. Huang, et al., Chin. Chem. Lett. 31 (2020) 1737-1745. DOI:10.1016/j.cclet.2020.02.049 |
| [12] |
Y.L. Fang, P. Liao, Z. Chen, et al., J. Nanosci. Nanotechnol. 20 (2020) 7369-7375. DOI:10.1166/jnn.2020.18714 |
| [13] |
L.L. Guo, H. Chen, N.Y. He, Y. Deng, Chin. Chem. Lett. 29 (2018) 1829-1833. DOI:10.1016/j.cclet.2018.10.038 |
| [14] |
J. Deng, Q.J. Chen, Z.Y. Peng, et al., Mater. Express. 9 (2019) 985-992. DOI:10.1166/mex.2019.1592 |
| [15] |
X.W. Zeng, W. Tao, L. Mei, et al., Biomaterials 34 (2013) 6058-6067. DOI:10.1016/j.biomaterials.2013.04.052 |
| [16] |
C.M. Zhang, Y.P. Huang, Y.L. Fang, et al., J. Nanosci. Nanotechnol. 19 (2019) 2049-2053. DOI:10.1166/jnn.2019.16486 |
| [17] |
G.J. Yang, H. Huang, Z.Q. Xiao, et al., J. Biomed. Nanotechnol. 16 (2020) 548-552. DOI:10.1166/jbn.2020.2909 |
| [18] |
D. Seliktar, Science 336 (2012) 1124-1128. DOI:10.1126/science.1214804 |
| [19] |
H. Khan, A. Khan, Y.F. Liu, et al., Chin. Chem. Lett. 30 (2019) 2201-2204. DOI:10.1016/j.cclet.2019.10.032 |
| [20] |
C. Wang, Y.P. Huang, H. Zhu, et al., J. Nanosci. Nanotechnol. 20 (2020) 2138-2143. DOI:10.1166/jnn.2020.17327 |
| [21] |
L. Hood, J.R. Heath, M.E. Phelps, B.Y. Lin, Science 306 (2004) 640-643. DOI:10.1126/science.1104635 |
| [22] |
Z.Q. Xiao, G.J. Yang, Y. Deng, et al., Mater. Express. 9 (2019) 509-516. DOI:10.1166/mex.2019.1520 |
| [23] |
H.M. Dong, C.L. Tang, Z.Y. He, et al., Chin. Chem. Lett. 31 (2020) 1812-1816. DOI:10.1016/j.cclet.2020.03.002 |
| [24] |
H. Chen, Y.Q. Wu, Y.L. Fang, et al., Nanosci. Nanotechnol. Lett. 10 (2018) 1423-1428. DOI:10.1166/nnl.2018.2802 |
| [25] |
Y.X. Lai, H. Huang, Z.H. Xia, et al., Mater. Express. 9 (2019) 444-450. DOI:10.1166/mex.2019.1524 |
| [26] |
Y. Liu, T.T. Li, C.X. Ling, et al., Chin. Chem. Lett. 30 (2019) 2211-2215. DOI:10.1016/j.cclet.2019.05.020 |
| [27] |
R.R. Huang, Z.J. Xi, Y. Deng, N.Y. He, Sci. Rep. 6 (2016) 31103. DOI:10.1038/srep31103 |
| [28] |
X. Zhou, C.X. Zhang, H. Jiang, et al., Nanosci. Nanotechnol. Lett. 10 (2018) 596-602. DOI:10.1166/nnl.2018.2695 |
| [29] |
C. Wang, F. Meng, Y.P. Huang, N.Y. He, Z. Chen, J. Nanosci, Nanotechnol. 20 (2020) 1332-1340. |
| [30] |
Z.S. Chen, Z. Ali, S. Li, B. Liu, N.Y. He, J. Nanosci, Nanotechnol. 16 (2016) 9346-9358. |
| [31] |
Z.Z. Xi, R.R. Huang, Z.Y. Li, et al., ACS Appl. Mater. Interfaces 7 (2015) 11215-11223. DOI:10.1021/acsami.5b01180 |
| [32] |
Z.J. Xi, B. Zheng, Nanosci. Nanotechnol. Lett. 10 (2018) 309-319. DOI:10.1166/nnl.2018.2624 |
| [33] |
C. Wang, Z.K. Guo, H. Zhu, et al., J. Nanosci. Nanotechnol. 20 (2020) 1401-1408. DOI:10.1166/jnn.2020.17355 |
| [34] |
Z.J. Xi, B. Zheng, C. Wang, Nanosci. Nanotechnol. Lett. 8 (2016) 1061-1066. DOI:10.1166/nnl.2016.2246 |
| [35] |
D.D. Yang, M. Liu, J. Xu, et al., Talanta 185 (2018) 113-117. DOI:10.1016/j.talanta.2018.03.045 |
| [36] |
M. Liu, Z.F. Wang, T. Tan, et al., Theranostics 8 (2018) 5772-5783. DOI:10.7150/thno.28949 |
| [37] |
M. Liu, T. Yang, Z.S. Chen, Z.F. Wang, N.Y. He, Biomater. Sci. 6 (2018) 3152-3159. DOI:10.1039/C8BM00787J |
| [38] |
Z.J. Xi, R.R. Huang, Y. Deng, E.B. Su, N.Y. He, Sci. Adv. Mater. 8 (2016) 1678-1682. DOI:10.1166/sam.2016.2447 |
| [39] |
Y. Liu, Y. Deng, T.T. Li, et al., J. Biomed. Nanotechnol. 14 (2018) 2156-2161. DOI:10.1166/jbn.2018.2655 |
| [40] |
Z.Y. Zhang, A. Runa, J. Wu, et al., Chin. Chem. Lett. 30 (2019) 779-782. DOI:10.1016/j.cclet.2018.10.019 |
| [41] |
C. Wang, L.L. Sun, Q. Zhao, Chin. Chem. Lett. 30 (2019) 1017-1020. DOI:10.1016/j.cclet.2019.01.029 |
| [42] |
R.R. Huang, L. He, Y.Y. Xia, et al., Small 115 (2019) 1900735. |
| [43] |
M.Q. Gu, J.L. Liu, D.L. Li, et al., Nanosci. Nanotechnol. Lett. 11 (2019) 1139-1144. DOI:10.1166/nnl.2019.2981 |
| [44] |
S.H. Yu, T.H. Kim, J. Biomed, Nanotechnol. 15 (2019) 1824-1831. |
| [45] |
Y. Wang, K. Chang, C. Yang, et al., J. Biomed. Nanotechnol. 15 (2019) 1568-1577. DOI:10.1166/jbn.2019.2793 |
| [46] |
H.X. Shi, W.W. Xiang, C. Liu, et al., Nanosci. Nanotechnol. Lett. 10 (2018) 1707-1712. DOI:10.1166/nnl.2018.2835 |
| [47] |
D.S. Zhen, F.F. Zhong, D. Yang, Q.Y. Cai, Y. Liu, Mater. Express. 9 (2019) 319-327. DOI:10.1166/mex.2019.1499 |
| [48] |
L. Jin, C.X. Zhang, Y. Deng, et al., Nanosci. Nanotechnol. Lett. 10 (2018) 908-912. DOI:10.1166/nnl.2018.2702 |
| [49] |
S. Yu, X.J. Bi, L. Yang, et al., J. Biomed. Nanotechnol. 15 (2019) 1135-1148. DOI:10.1166/jbn.2019.2751 |
| [50] |
X.W. Hu, M.M. Zhang, Q. Xue, T. Cai, J. Biomed, Nanotechnol. 15 (2019) 319-328. |
| [51] |
M. Liu, X.C. Yu, Z. Chen, et al., Nanobiotechnol. 15 (2017) 81. DOI:10.1186/s12951-017-0311-4 |
| [52] |
Z.J. Xi, R.R. Huang, Y. Deng, N.Y. He, J. Biomed, Nanotechnol. 10 (2014) 3043-3062. |
| [53] |
T.T. Li, J.J. Yang, Z.S. Ali, et al., Sci. China Chem. 60 (2017) 370-376. DOI:10.1007/s11426-016-0159-2 |
| [54] |
R.R. Huang, Z.S. Chen, M. Liu, et al., Sci. China Chem. 60 (2017) 786-792. |
| [55] |
L.P. Zhong, H. Zou, Y. Huang, et al., J. Biomed. Nanotechnol. 15 (2019) 352-362. DOI:10.1166/jbn.2019.2688 |
| [56] |
I. Willner, M. Zayats, Angew. Chem. Int. Ed. 46 (2007) 6408-6418. DOI:10.1002/anie.200604524 |
| [57] |
D.E. Huizenga, J.W. Szostak, Biochemistry 34 (1995) 656-665. DOI:10.1021/bi00002a033 |
| [58] |
N. Hamaguchi, A. Ellington, M. Stanton, Anal. Biochem. 294 (2001) 126-131. DOI:10.1006/abio.2001.5169 |
| [59] |
E.W.M. Ng, D.T. Shima, P. Calias, et al., Nat. Rev. Drug Discov. 5 (2006) 123-132. DOI:10.1038/nrd1955 |
| [60] |
M.N. Stojanovic, P. De Prada, D.W. Landry, et al., J. Am. Chem. Soc. 123 (2001) 4928-4931. DOI:10.1021/ja0038171 |
| [61] |
V. Pavlov, Y. Xiao, B. Shlyahovsky, I. Willner, J. Am. Chem. Soc. 126 (2004) 11768-11769. DOI:10.1021/ja046970u |
| [62] |
V. Bagalkot, O.C. Farokhzad, R. Langer, S. Jon, Angew. Chem. Int. Ed. 45 (2006) 8149-8152. DOI:10.1002/anie.200602251 |
| [63] |
Y. Liu, Y.X. Lai, G.J. Yang, et al., J. Biomed. Nanotechnol. 13 (2017) 1253-1259. DOI:10.1166/jbn.2017.2424 |
| [64] |
M. Liu, Z.F. Wang, N.Y. He, Y. Deng, Clin Basic, Pharmacol. Toxicol. 124 (2018) 3-4. |
| [65] |
S. Fredriksson, M. Gullberg, J. Jarvius, et al., Nat. Biotechnol. 20 (2002) 473-477. DOI:10.1038/nbt0502-473 |
| [66] |
R.R. Huang, Z.J. Xi, N.Y. He, et al., Sci. China Chem. 58 (2015) 1122-1130. DOI:10.1007/s11426-015-5344-7 |
| [67] |
C.F. Zhu, Z.Y. Zeng, H. Li, et al., J. Am. Chem. Soc. 135 (2013) 5998-6001. DOI:10.1021/ja4019572 |
| [68] |
Y.P. Huang, C. Wang, H. Zhu, et al., J. Nanosci. Nanotechnol. 20 (2020) 2165-2170. DOI:10.1166/jnn.2020.17328 |
| [69] |
D. Li, S.P. Song, C.H. Fan, Acc. Chem. Res. 43 (2010) 631-641. DOI:10.1021/ar900245u |
| [70] |
G. Mayer, M.S.L. Ahmed, A. Dolf, et al., Nat. Protoc. 5 (2010) 1993-2004. DOI:10.1038/nprot.2010.163 |
| [71] |
Z.Y. Xiao, D.H. Shangguan, Z.H. Cao, X.H. Fang, W.H. Tan, Chem. Eur. J. 14 (2008) 1769-1775. DOI:10.1002/chem.200701330 |
| [72] |
D.H. Shangguan, Z.H. Cao, L. Meng, et al., J. Proteome Res. 7 (2008) 2133-2139. DOI:10.1021/pr700894d |
| [73] |
Y. Wang, Z.H. Li, D.H. Hu, et al., J. Am. Chem. Soc. 132 (2010) 9274-9276. DOI:10.1021/ja103169v |
| [74] |
O.C. Farokhzad, S.Y. Jon, A. Khademhosseini, et al., Cancer Res. 64 (2004) 7668-7672. DOI:10.1158/0008-5472.CAN-04-2550 |
| [75] |
G.Z. Zhu, M. Ye, M.J. Donovan, et al., Chem. Commun. 48 (2012) 10472-10480. DOI:10.1039/c2cc35042d |
| [76] |
J. Zhu, T. Nguyen, R.J. Pei, M. Stojanovic, Q. Lin, Lab Chip 12 (2012) 3504-3513. DOI:10.1039/c2lc40411g |
| [77] |
X.H. Fang, W.H. Tan, Acc. Chem. Res. 43 (2010) 48-57. DOI:10.1021/ar900101s |
| [78] |
Z.K. Guo, C. Wang, S. Li, et al., J. Nanosci. Nanotechnol. 20 (2020) 3373-3377. DOI:10.1166/jnn.2020.17424 |
| [79] |
R.R. Huang, L. He, S. Li, et al., Nanoscale 12 (2020) 2445-2451. DOI:10.1039/C9NR08747H |
| [80] |
X.C. Yu, L. He, M. Pentok, et al., Nanoscale 11 (2019) 15589-15595. DOI:10.1039/C9NR04050A |
| [81] |
F. Zhou, P. Wang, Y.B. Peng, et al., Angew. Chem. Int. Ed. 58 (2019) 11661-11665. DOI:10.1002/anie.201903807 |
| [82] |
M. Liu, A. Khan, Z.F. Wang, et al., Biosens. Bioelectron. 130 (2019) 174-184. DOI:10.1016/j.bios.2019.01.006 |
| [83] |
D. Hoffmann, J.M. Bangen, W. Bayer, O. Wildner, Gene Ther. 13 (2008) 1534-1544. |
| [84] |
V.S. Mueller, P.R. Jungblut, T.F. Meyer, S. Hunke, Proteomics 11 (2011) 2124-2128. DOI:10.1002/pmic.201000558 |
| [85] |
S.P.C. Cole, G. Bhardwaj, J.H. Gerlach, et al., Science 258 (1992) 1650-1654. DOI:10.1126/science.1360704 |
| [86] |
S.R. Hingorani, E.F. Petricoin, A. Maitra, et al., Cancer Cell 4 (2003) 437-450. DOI:10.1016/S1535-6108(03)00309-X |
| [87] |
N. Normanno, A. De Luca, C. Bianco, et al., Gene 366 (2006) 2-16. DOI:10.1016/j.gene.2005.10.018 |
| [88] |
T.M. Phillips, W.H. Mcbride, P. Frank, J. Natl, Cancer Inst. 24 (2006) 1777-1785. |
| [89] |
P. Thomas, Y. Pang, E.J. Filardo, J. Dong, Endocrinology 2 (2005) 624-632. |
| [90] |
Y. Kim, A.M. Lillo, S.C.J. Steiniger, et al., Biochemistry 45 (2006) 9434-9444. DOI:10.1021/bi060264j |
| [91] |
T. Horikawa, T. Yoshizaki, T.S. Sheen, S.Y. Lee, M. Furukawa, Cancer 89 (2000) 715-723. DOI:10.1002/1097-0142(20000815)89:4<715::AID-CNCR1>3.0.CO;2-9 |
| [92] |
D. Van Simaeys, D. Turek, C. Champanhac, et al., Anal. Chem. 86 (2014) 4521-4527. DOI:10.1021/ac500466x |
| [93] |
X.Q. Wu, H.L. Liu, D.M. Han, et al., J. Am. Chem. Soc. 141 (2019) 10760-10769. DOI:10.1021/jacs.9b03720 |
| [94] |
S. Camorani, E. Crescenzi, D. Colecchia, et al., Oncotarget 6 (2015) 37579-37596. |
| [95] |
W.T. Jia, C.P. Ren, L. Wang, et al., Oncotarget 7 (2016) 55328-55342. DOI:10.18632/oncotarget.10530 |
| [96] |
J.Y. Ahn, S.W. Lee, H.S. Kang, et al., J. Proteome Res. 9 (2010) 5568-5573. DOI:10.1021/pr100300t |
| [97] |
S.J. Lee, B. Adler, S. Ekström, et al., Anal. Chem. 15 (2014) 7627-7634. |
| [98] |
L.W. Dick, L.B. Mcgown, Anal. Chem. 76 (2004) 3037-3041. DOI:10.1021/ac049860e |
| [99] |
A. Nykanen, B. Haley, P.D. Zamore, Cell 107 (2001) 309-321. DOI:10.1016/S0092-8674(01)00547-5 |
| [100] |
L. He, G.J. Hannon, Nat. Rev. Genet. 5 (2004) 522-531. DOI:10.1038/nrg1379 |
| [101] |
M.A. Valencia-Sanchez, J.D. Liu, G.J. Hannon, P. Parker, Genes Dev. 20 (2006) 515-524. DOI:10.1101/gad.1399806 |
| [102] |
A. Reynolds, D. Leake, Q. Boese, et al., Nat. Biotechnol. 22 (2004) 326-330. DOI:10.1038/nbt936 |
| [103] |
D.H. Kim, L.M. Villeneuve, K.V. Morris, J.J. Rossi, Nat. Struct. Mol. Biol. 13 (2006) 793-797. DOI:10.1038/nsmb1142 |
| [104] |
G. Meister, M. Landthaler, Y. Dorsett, T. Tuschi., RNA 10 (2004) 544-550. DOI:10.1261/rna.5235104 |
| [105] |
D. Zilberman, X.F. Cao, S.E. Jacobsen, Science 299 (2003) 716-719. DOI:10.1126/science.1079695 |
| [106] |
R.M. Schiffelers, A. Ansari, J. Xu, et al., Nucleic Acids Res. 32 (2004) 149. DOI:10.1093/nar/gnh140 |
| [107] |
C.P. Neff, J.H. Zhou, L. Remling, et al., Sci. Transl. Med. 3 (2011) 66ra6. |
| [108] |
P.H. Giangrande, J.O. McNamara, E. Andrecheck, E. Gilboa, B.A. Sullenger, Mol. Ther. 13 (2006) S35. |
| [109] |
J.P. Dassie, X.Y. Liu, G.S. Thomas, et al., Nat. Biotechnol. 27 (2009) 839-849. DOI:10.1038/nbt.1560 |
| [110] |
Y. Li, H.J. Lee, R.M. Corn, Anal. Chem. 79 (2007) 1082-1088. DOI:10.1021/ac061849m |
| [111] |
V. Zinchuk, O. Zinchuk, T. Okada, Acta Histochem. Cytochem. 40 (2007) 101-111. DOI:10.1267/ahc.07002 |
| [112] |
T. Redmond, E.R. Sanchez, E.H. Bresnick, et al., Eur. J. Cell Biol. 50 (1989) 66-75. |
| [113] |
J.C.G. Marvizón, W.L. Chen, N. Murphy, J. Comp, Neurol. 517 (2009) 51-68. |
| [114] |
S. Jones, J.M. Thornton, Proc. Natl. Acad. Sci. U. S. A. 93 (1996) 13-20. DOI:10.1073/pnas.93.1.13 |
| [115] |
J.M. Fritschy, H. Mohler, J. Comp. Neurol. 359 (1995) 154-194. DOI:10.1002/cne.903590111 |
| [116] |
S.V. Costes, D. Daelemans, E.H. Cho, et al., Biophys. J. 86 (2004) 3993-4003. DOI:10.1529/biophysj.103.038422 |
| [117] |
M. Lalancette-Hebert, G. Gowing, A. Simard, Y.C. Weng, J. Kriz, J. Neurosci. 27 (2007) 2596-2605. DOI:10.1523/JNEUROSCI.5360-06.2007 |
| [118] |
S.T. Shi, S.J. Polyak, H. Tu, et al., Virology 292 (2002) 198-210. DOI:10.1006/viro.2001.1225 |
| [119] |
Y.A. Lazebnik, S.H. Kaufmann, S. Desnoyers, G.G. Poirier, W.C. Earnshaw, Nature 371 (1994) 346-347. DOI:10.1038/371346a0 |
| [120] |
L. Teufel, K.C. Schuster, P. Merschak, T. Bechtold, B. Redl, J. Mol, Microbiol. Biotechnol. 14 (2008) 193-200. |
| [121] |
M.D. Sternlicht, Z. Werb, Annu. Rev. Cell Dev. Biol. 17 (2001) 463-516. DOI:10.1146/annurev.cellbio.17.1.463 |
| [122] |
N. Prenzel, E. Zwick, H. Daub, et al., Nature 402 (1999) 884-888. DOI:10.1038/47260 |
| [123] |
M. Gross-Bellard, P. Oudet, P. Chambon, Eur. J. Biochem. 36 (1973) 32-38. DOI:10.1111/j.1432-1033.1973.tb02881.x |
| [124] |
K.R. Sayre, R.Y. Dodd, G. Tegtmeier, et al., Transfusion 36 (1996) 45-52. DOI:10.1046/j.1537-2995.1996.36196190514.x |
| [125] |
Y.J. Wu, L. Chen, P.G. Scott, E.E. Tredget, Stem Cells 25 (2007) 2648-2659. DOI:10.1634/stemcells.2007-0226 |
| [126] |
S.T. Chari, D.S. Longnecke, G. Klöppel, Pancreas 38 (2009) 846-848. DOI:10.1097/MPA.0b013e3181bba281 |
| [127] |
C. Romano, M.A. Semsa, C.T. Mcdonald, et al., J. Comp. Neurol. 355 (1995) 455-469. DOI:10.1002/cne.903550310 |
| [128] |
M. Kato, M. Sanada, I. Kato, et al., Nature 459 (2009) 712-716. DOI:10.1038/nature07969 |
| [129] |
J.G. Greger, S.D. Eastman, V.V. Zhang, et al., Mol. Cancer Ther. 11 (2012) 909-920. DOI:10.1158/1535-7163.MCT-11-0989 |
| [130] |
J.H. Urban, J. Vogel, Nucleic Acids Res. 35 (2007) 1018-1037. DOI:10.1093/nar/gkl1040 |
| [131] |
M.M. Taher, C.M. Hershey, J.D. Oakley, K. Valerie, Photochem. Photobiol. 71 (2000) 455-459. DOI:10.1562/0031-8655(2000)071<0455:ROTPAM>2.0.CO;2 |
| [132] |
S. Shin, I.H. Kim, W. Kang, J.K. Yang, S.S. Hah, Bioorg. Med. Chem. Lett. 20 (2010) 3322-3325. DOI:10.1016/j.bmcl.2010.04.040 |
| [133] |
E. Ramos, D. Pineiro, M. Soto, et al., Lab. Invest. 87 (2007) 409-416. DOI:10.1038/labinvest.3700535 |
| [134] |
S.J. Cho, H.M. Woo, K.S. Kim, J.W. Oh, Y.J. Jeong, J. Biosci. Bioeng. 112 (2011) 535-540. DOI:10.1016/j.jbiosc.2011.08.014 |
| [135] |
D. Grate, C. Wilson, Bioorg. Med. Chem. 9 (2001) 2565-2570. DOI:10.1016/S0968-0896(01)00031-1 |
| [136] |
A. Scherl, Methods 81 (2015) 3-14. DOI:10.1016/j.ymeth.2015.02.015 |
| [137] |
Y. Ho, A. Gruhler, A. Heilbut, et al., Nature 415 (2002) 180-183. DOI:10.1038/415180a |
| [138] |
J.E. Elias, S.P. Gygi, Nat. Methods 4 (2007) 207-214. DOI:10.1038/nmeth1019 |
| [139] |
M. Schneider, A. Belsom, J. Rappsilber, Trends Biochem. Sci. 43 (2018) 157-169. DOI:10.1016/j.tibs.2017.12.006 |
| [140] |
T.Y. Samgina, S.V. Kovalev, V.A. Gorshkov, et al., J. Am. Soc. Mass Spectrom. 21 (2010) 104-111. DOI:10.1016/j.jasms.2009.09.008 |
| [141] |
X. Zhang, M. Scalf, T.W. Berggren, M.S. Westphall, L.M. Smith, J. Am. Soc. Mass Spectrom. 17 (2006) 490-499. DOI:10.1016/j.jasms.2005.12.007 |