 2020, Vol. 31


b State Key Laboratory of Heavy Oil Processing, China University of Petroleum-Beijing, Beijing 102249, China;
c Personalized Drug Therapy Key Laboratory of Sichuan Province, Department of Pharmacy, Sichuan Provincial People's Hospital, School of Medicine, University of Electronic Science and Technology of China, Chengdu 610072, China;
d Stomatology Department of the General Hospital of Chinese PLA, Beijing 100853, China
Quantum dots, derived from two-dimensional (2D) materials, have shown applications in bioimaging [1], photocatalysis, biosensors and white light emission devices (W-LEDs) [2]. Twodimensional quantum dots (2D-QDs) include hexagonal diatomic boron nitride (h-BN) [3], graphitized carbon nitride (g-C3N4) [4], transition metal dichalcogenides (TMDs) [5], and monoatomic curved crystals [6]. They are defined as quantum dots with new luminescence and chemical properties generated from twodimensional lamellar structures [7]. Thus, the 2D form of their atomic thickness (single or multiple layers) preserves and displays the properties corresponding to their flaky structure. Because of the simple function and strong processing ability, 2D-QDs have been widely used in sensing [8-11], catalysis [12], battery [13] and biology [14-17].
MXene is a novel two-dimensional layered material [18], including transition metal carbides, carbonitrides and nitrides. Their general expression can be defined as Mn+1XnTx (n = 1–3), where M is the early transition metal, X is the carbon and/or nitrogen, and T is the surface hydrophilic group (O, F, OH or Cl) [7, 19]. Although MXene has great potential in a variety of fields, the low photoluminescence (PL) effect of this material in aqueous solutions greatly limit its wide application in biological and optical fields [20]. In some ion detection applications, strong light response and photoluminescence quantum yield (PLQY) play a crucial role in the application of MXene quantum dots [21].
Studies have shown that the type of transition metal M and the number of layers of X will affect the structural properties of MXene's materials. M2X structures show higher Li-ion specific capacities, compared to their M3X2 and M4X3 counterparts, for the simple reason that the number of atomic layers per MXene sheet in the former are 3 instead of 5 or 7 for the latter [22]. Besides, experimental Li-ion specific capacities of Nb2CTx are more than Ti2CTx [23], and delaminated MXene can store more charge than their multilayer counterparts [24]. Therefore, as with other 2D materials, the development of a wider variety of other MXene quantum dots (MQDs) is crucial for their ultimate use in most applications. In the previous study, Xu et al. [25] has successfully fabricated high quantum yield Ti3C2 dots and expand their applications in the Fe3+ ion detection. Additionally, we are performing a toxicity test for the developed Nb2C MXene QDs, and we found that high PLQY MQDs exhibit high efficiency in detecting Cu2+.
Here, we report an outstanding high quantum yield (QY) sulfur and nitrogen co-doped Nb2C quantum dots (S, N-MQDs) synthesized by layered Nb2C nanosheet as a precursor. The prepared S, N-MQDs have bright green fluorescence, small particle size, high PLQY, up to 17.25%, and pH resistance. Compared with the previous paper [26], we applied heteroatom doped quantum dots (S, N-MQDs) to copper ion detection for the first time, with detection limit of 2 μmol/L. The structure of the modified S, N-MQDs was further explored with X-ray photoelectron spectroscopy (XPS), Fourier transform infrared spectroscopy (FTIR) and X-ray diffraction analysis (XRD) in an angle range of 5°–90°. The S, N-MQDs can be successfully applied as fluorescent probe in Caco-2 cells labeling and the fluorescence detection of Cu2+ ions. This research provided a scope for the environmental monitoring application of the modified S, N-MQDs.
In a typical procedure, 100 mg of Nb2C MXene was suspended in concentrated sulphuric acid and nitric acid in an oil bath and held at a constant temperature of 100 ℃ for 12 h. The acid solution was cooled to room temperature and added to NaOH water solution slowly until the pH was 7. S, N-MQDs were synthesized using the following hydrothermal method. Briefly, 15 mL water, 0.1 g of L-cysteine, 0.05 g urea and prepared MXene dots was added to a 50 mL Teflon-lined stainless-steel autoclave. Then, the autoclave was kept at a temperature of 160 ℃ for 12 h. The reaction mixture was adequately separated and purified using the following procedures. The mixture was filtered through a 0.45 μm polytetrafluoroethylene membrane to remove impurities. Then, the filtrate was dialyzed in a 1000 Da dialysis bag against ultrapure water which was renewed every 10-12 h for 2 days, until no Na+ was detected in the ultrapure water.
The scanning electron microscopy (SEM) image of the Nb2C powders is shown in Fig. S1 (Supporting information). The obtained product was subjected to a hydrothermal treatment to produce nitrogen and sulfur functionalized Nb2C MXene based quantum dots. The elements are uniformly distributed in the layered material (Fig. S2 in Supporting information). The morphology of S, N-MQDs was analyzed by dropping the aqueous solution on carbon-coated copper grid for high resolution transmission electron microscopy (HRTEM), which was also applied for diameter measurement. The TEM image of the S, NMQDs was shown in Fig. 1a. The size distributions were calculated by counting 100 particles from the TEM images, and the S, N-MQDs were well dispersed with average lateral sizes of 3.8±0.5 nm (Fig. 1b). The average lateral particle sizes were 3.54 nm. The morphology and thickness of the S, N-MQDs were further characterized by AFM measurements (Fig. 1c). The size of S, N-MQDs are distributed from 0.8 nm to 1.8 nm in thickness (Fig. 1d), indicating that the S, N-MQDs were quasi-spherical, well dispersed, highly exfoliated and few-layered.

|
Download:
|
| Fig. 1. TEM image (a) and the height distribution (b) of S, N-MQDs; AFM image (c) and the thickness distribution (d) of S, N-MQDs. | |
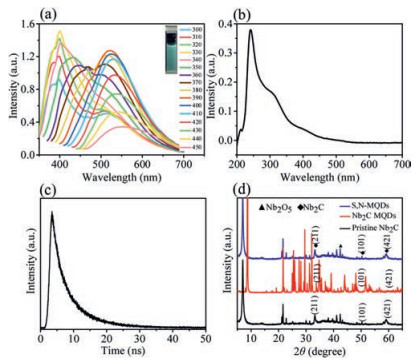
To investigate the optical properties of the S, N-MQDs in detail, spectrum of photoluminescence (PL) and UV–vis absorption were collected. The emissions of the S, N-MQDs excited with different wavelengths are shown in Fig. 2a. The S, N-MQDs exhibited excitation-dependent PL features. Accompanying with the excitation wavelength increasing, the fluorescence intensity first little enhanced and then reduced. In addition, as the excitation wavelength increases from 300 nm to 400 nm, the emission peaks of S, N-MQDs red-shifted gradually. According to fluorescence spectrum, the maximum excitation wavelength was 390 nm while the highest emission was located at 520 nm (Fig. S3 in Supporting information). The facile MXene size as well as efficient nitrogen and sulfur doping help in generating MQDs with robust photoluminescence and reach the highest PLQY of 17.25%. As depicted in Fig. 2b, a peak at 241 nm is detected and indicates the π-π* transition by the surface states. This absorption and the presence of surface states can lead to strong emission features in doped S, N-MQDs. The lifetimes of S, N-MQDs after hydrothermal treatment is 7.12 ns (Fig. 2c). Stable fluorescence can be maintained within a large pH value [27]. Temperature range affects the application range of MQDs [28]. Therefore, we evaluated the pH/temperaturedependent fluorescence (intensity) behavior of S, N-MQDs. Fluorescence emission intensity was excited at 390 nm in solutions with different pH values and temperatures. As shown in Fig. S4 (Supporting information), S, N-MQDs show stable fluorescence intensity at a wide range of pH values (pH 2.0–10.0) and temperatures (20–90 ℃). As shown by XRD (Fig. 2d), the signals at about 33.23°, 50.28° and 58.99° were ascribed to the typical (211), (101) and (421) peaks of Nb2C MXene [29]. The existence of the characteristic peaks suggested that the layer structure of Nb2C MXene is still maintained within the S, N-MQDs. The signal at about 42.35° is ascribed to the formation of Nb2O5 on the surface of the S, N-MQDs.

|
Download:
|
| Fig. 2. (a) Fluorescence emission spectra of the prepared S, N-MQDs at different excitation wavelengths. Inset (top-right): photographs under UV light (365 nm); (b) UV–vis absorption; (c) PL decay spectra and (d) XRD spectra of the S, N-MQDs. | |
In the following, fourier transform infrared spectroscopy (FTIR) and X-ray photoelectron spectroscopy (XPS) were performed to investigate the structure, composition and chemical bonds of the synthesized MQDs. FTIR spectrum is consistent with XPS analysis, providing further evidence for the incorporation of N and S into MQDs. Fig. 3a shows that the MQDs and S, N-MQDs have identical vibrational peaks. The peak at 3470.4 cm-1 is attributed to OH and -NH groups [30]. The peak at 1638.8 cm-1 is ascribed to the C=O stretching vibration [31]. The peak at 1105 cm-1 is assigned to the C–S bonds. The peak at 992 cm-1 is ascribed to the C—F bonds. In particular, the vibration of the Nb-O bond may account for the peak at 832.6 cm-1. The results of FTIR show that the surface modification of nanomaterials with hydroxyl and carbonyl groups is the reason for the good water solubility and light stability of the N–S functionalized nanomaterials.

|
Download:
|
| Fig. 3. (a) FTIR and (b) XPS spectra of the S, N-MQDs. | |
In order to verify the enhancement mechanism of QY in S, N-MQDs, the synthetic products were systematically analyzed by XPS. In the XPS analysis of S, N-MQDs (Fig. 3b), four main peaks at 533.1, 408.1, 286.1, 231.1 and 168.1 eV are ascribed to the elements of O 1s, N 1s, C 1s, Nb 3d and S 2p, respectively. In the highresolution C 1s spectrum (Fig. S5a in Supporting information), the C 1s XPS spectra of Nb2C show four peaks at 281.2, 285.5 and 288.2 eV. The peak centered at 281.2 eV could be assigned to the Nb-C bond [32]. A peak at 285.5 eV is attributed to the "graphitized" nitrogen (C-N-H) group [25], consistent with the FTIR results. The peak centered at 288.2 eV can be assigned to the C=O bond [25]. The presence of the N—H group creates passive surfaces on the S, N-MQDs, responsible for their stability in different pH values (Fig. S4a in Supporting information) and under varying temperatures (Fig. S4b in Supporting information). The O 1s XPS spectrum of layered Nb2C is fit by two peaks at 530.0 eV and 531.8 eV, which are ascribed to the Nb-Ox [33] and NbOH [34] species, respectively (Fig. S5b in Supporting information). Three new peaks are formed at 530.1 eV and 529.8 eV. The peak at 530.1 eV corresponds to Nb-O bands. The Nb 3d spectrum is shown in Fig. S5c (Supporting information). There are three peaks at 208.8, 206.0 and 203.0 eV. The peak at 206.0 eV corresponds to Nb-Ox [29]. The peak at 208.8 eV corresponds to Nb(V)-O [35]. The peak at binding energy of 203.0 eV can be assigned to Nb-N bond after nitrogen doping [33]. The S 2p XPS spectra of S, N-MQDs (Fig. S5d in Supporting information) are fitted by two peaks located at 168.2 eV and 169.3 eV. The peaks at 168.2 eV and 169.3 eV are related to different oxidized sulfur form of SOx (x = 2–4) bond, generally linked on the surface of the Nb2C layers. The carbon connected to sulfate has a high oxidation state (in the oxidized form), as demonstrated by the C 1s XPS (Fig. S5a). In addition, the high QY of S, N-MQDs can be attributed to the strong electron absorption of the sulfate group, which helps stabilize the effective compound pathway of electrons and holes [36]. Meanwhile, the bonding configurations of nitrogen atoms in S, N-MQDs were characterized by high resolution N 1s spectra (Fig. S5e in Supporting information). Two peaks are obtained by peak fitting formed at 399.0 eV and 400.4 eV. These peaks corresponded to the Nb-N band and pyrrolelike nitrogen (C—N), indicating that the functionalized nitrogen is incorporated into the S, N-MQDs as N-Nb and C—N bonds. XPS and FTIR analysis show that the prepared S, N-MQDs have a highly oxidized surface. The doped nitrogen is bound to MQDs by C—N bond, while the sulfur is bound to MQDs by direct C–S bond.
With the excellent PLQY properties of S, N-MQDs, we explore their potential environmental and/or biomedical applications, in particular, adopting S, N-MQDs as probes for the detection of Cu2+. Copper ionplays an important role in physiological and pathological processes. The conventional technologies for Cu2+ detection include ultraviolet-visible spectrometry (UV–vis) and inductively coupled plasma mass spectrometry (ICP-MS). Fluorescence-based technologies can be employed for Cu2+ detection, providing combined merits of increased sensitivity, fast response, and easy operation. In our study, the strong emission of the S, N-MQDs at 520 nm was used for the ultra-trace detection of Cu2+.
In a typical experiment, 300 μL of the S, N-MQDs were diluted to 3 mL with deionized water and then the fluorescence intensity at 520 nm of the S, N-MQDs (excited by 390 nm) was recorded as the initial fluorescence intensity (F0). In the following, different concentrations of Cu2+ were introduced into the above solution. The fluorescence intensity was measured after 5 min and recorded as the fluorescence intensity at the end point (Ft). The change in the fluorescence intensity (∆F) is defined as the difference between F0 and Ft (∆F = F0-Ft).
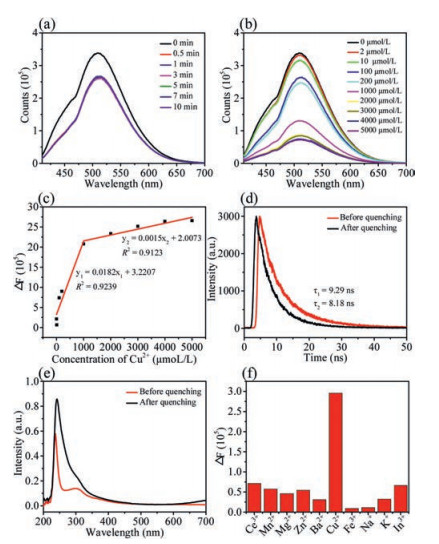
The S, N-MQDs exhibited high efficiency in detecting Cu2+. A significant decrease (near-quenching) in fluorescence is observed upon the addition of 100 μmol/L Cu2+ (Fig. 4a). The fluorescence intensity quickly quenched with the addition of Cu2+ within 0.5 min. Therefore, 0.5 min is defined as the detection time in this experiment for the detection of Cu2+. Fig. 4b illustrates the change in the fluorescence intensity of the S, N-MQDs in the presence of increasing concentrations of Cu2+. Each spectrum was recorded after 5 min equilibration. A good linear relationship is reached between the loss of the PL intensity of the S, N-MQDs and the Cu2+ concentration in the range of 2–1000 μmol/L and 1000–5000 μmol/L. The limit of detection was as low as 2 μmol/L (Fig. 4c), displaying great potential for the trace level detection of Cu2+. This apparent change in the fluorescence intensity can be attributed to the fact that Cu2+ promotes electron/hole recombination annihilation by an alternative and efficient electron transfer process, resulting in the change in the morphology and electron state on the surface of the S, N-MQDs. Moreover, the changes seen in the S, N-MQDs fluorescence lifetime (Fig. 4d) and UV–vis absorption (Fig. 4e) demonstrate that the surface state of the S, N-MQDs is modified by the added Cu2+. In the practical application of ion detection, the selectivity of MQDs quenching is also critical to remove the fast response and detection limit. In order to evaluate the selectivity of the proposed Cu2+ sensor, various univalent, bivalent and trivalent ions were detected. Here, we added 9 different metal ions, including Ce3+, Mn2+, Mg2+, Zn2+, Ba2+, Fe3+, Na+, K+ and In3+, to the S, N-MQDs solution, and recorded the DF of each interfering ion at 390 nm. As can be seen from Fig. 4f, the fluorescence of S, N-MQDs was only largely quenched after the addition of Cu2+, while the effect of other metal ions on the fluorescence quenching of S, N-MQDs was very small. According to previous research [25, 27], Cu2+ exist on the surface of S, N-MQDs in the form of monovalent and divalent, which reduces the degree of surface oxidation and performs an alternative and effective electron transfer process. This coordination interaction promotes the possibility of non-radiative electron/hole recombination, and S, N-MQDs aggregate into a large complex form. Due to the size effect, excitations are lost through photon scattering, and the fluorescence of S, N-MQDs is finally quenched. Therefore, the quenching mechanism can be captured by the amino groups of S, N-MQDs and form complexes on the surface of the quantum dots and the agglomeration of them in the Cu2+ solution, leading to strong quenching of S, N-MQDs through internal filtering. To further explain the mechanism, a schematic mechanism was proposed, as shown in Fig. 5. The specificity and selectivity of S, N-MQDs in Cu2+ detection provides an important contribution to S, N-MQDs' new role in protecting and monitoring the environment.

|
Download:
|
| Fig. 4. (a) Time-dependent fluorescence changes of the S, N-MQDs in the presence of Cu2+ (100 μmol/L). (b) PL emission spectra of the Cu2+ (S, N-MQDs) solution with different concentrations of Cu2+. (c) The ∆F calibration curve of the S, N-MQDs solution versus the concentration of Cu2+. (d) Lifetime and (e) absorption spectra before and after the quenching of the S, N-MQDs by Cu2+. (f) The ∆F at 520 nm for S, N-MQDs in the presence of various metal ions (100 μmol/L). | |

|
Download:
|
| Fig. 5. The proposed quenching mechanism of S, N-MQDs. | |
Before S, N-MQDs was used in biological imaging, cell biocompatibility test of S, N-MQDs was conducted with Caco-2 cells using cell count kit-8 (CCK-8) (Fig. S6 in Supporting information). Exposure to 10 mg/mL and 20 mg/mL S, N-MQDs significantly decreased cellular viability (P < 0.05). At the concentration of 20 mg/mL, the cellular viability was almost completely lost. With the concentrations smaller than 10 mg/mL, all the tested concentrations did not decrease cellular viability. The results showed that S, N-MQDs was modest cytotoxic at low concentrations.
The representative images in (Fig. 6) show that the control cells exhibited low levels of auto-fluorescence, whereas S, N-MQDs-treated cells showed high levels of green fluorescence. The quantitative analysis showed that a marked increase of green fluorescence after S, N-MQDs exposure. Based on the above experiments, we can know that the green S, N-MQDs is capable of lasting cell imaging at nontoxic concentrations.

|
Download:
|
| Fig. 6. The staining of Caco-2 cells by S, N-MQDs. (a) the unstained control cells. (b) Caco-2 cells stained by S, N-MQDs. (c) The changes of S, N-MQDs intensity. | |
In summary, we have synthesized a class of S, N-MQDs derived from 2D Nb2C MXene, utilizing hydrothermal method and nitrogen and sulfur co-doping agent simultaneously. The prepared S, N-MQDs have a quasi-spherical shape, an average size of 3.54 nm. The QY of the modified S, N-MQDs is about 17.25% with photoluminescent wavelength at 520 nm. The obtained S, N-MQDs have great dispersion stability, high quantum yield, green fluorescence, and excellent photostability. Given these unique characteristics, the S, N-MQDs have been successfully applied to Caco-2 cells bioimaging and detect the Cu2+ ion with good linear correlation and a detection limit as low as 2 μmol/L. Therefore, this work not only develops a sensitive ratiometric assay for Cu2+ sensing, but also opens a new and exciting avenue for the development of the S, N-MQDs and many other MXene-derived QDs in solar cells, biosensing and environment monitoring.
Declaration of competing interestThe authors declare that they have no known competing financial interests or personal relationships that could have appeared to influence the work reported in this paper.
AcknowledgmentsWe thank the National Nature Science Foundation of China (No.31340014), the Youth Development Project of Medical Technology in Army (No. 13QNP166), the Key Research and Development Program of Science and Technology Department of Sichuan Province (No. 2019YFS0514), and Funds for the Construction of Master's Degree Granting Units in Guangxi Zhuang Autonomous Region in 2020 for the support.
Appendix A. Supplementary dataSupplementary material related to this article can be found, in the online version, at doi:https://doi.org/10.1016/j.cclet.2020.05.020.
| [1] |
M. Zhang, R. Su, J. Zhong, et al., Nano Res. 12 (2019) 815-821. DOI:10.1007/s12274-019-2293-z |
| [2] |
W. Cai, T. Zhang, M. Xu, et al., J. Mater. Chem. C 7 (2019) 2212-2218. DOI:10.1039/C9TC00274J |
| [3] |
A. Ananthanarayanan, X.W. Wang, P. Routh, et al., Adv. Funct. Mater. 24 (2014) 3021-3026. DOI:10.1002/adfm.201303441 |
| [4] |
T.N. Antsygina, K.A. Chishko, I.I. Poltavsky, J. Low Temp. Phys. 126 (2002) 15-20. DOI:10.1023/A:1013752812509 |
| [5] |
X.C. Cao, J. Wu, C. Jin, et al., ACS Catal. 5 (2015) 4890-4896. DOI:10.1021/acscatal.5b00494 |
| [6] |
X. Chen, X.K. Sun, W. Xu, et al., Nanoscale 10 (2018) 1111-1118. DOI:10.1039/C7NR06958H |
| [7] |
Q. Xu, W. Cai, W. Li, et al., Mater. Today Energy 10 (2018) 222-240. DOI:10.1016/j.mtener.2018.09.005 |
| [8] |
L. Bai, N. Xue, Y. Zhao, et al., Nano Res. 11 (2018) 2034-2045. DOI:10.1007/s12274-017-1820-z |
| [9] |
B. Kong, C. Selomulya, G. Zheng, D. Zhao, Chem. Soc. Rev. 44 (2015) 7997-8018. DOI:10.1039/C5CS00397K |
| [10] |
R. Freeman, I. Willner, Chem. Soc. Rev. 41 (2012) 4067-4085. DOI:10.1039/c2cs15357b |
| [11] |
T.S. Sreeprasad, A.A. Rodriguez, J. Colston, et al., Nano Lett. 13 (2013) 1757-1763. DOI:10.1021/nl4003443 |
| [12] |
X. Wang, G. Sun, N. Li, P. Chen, Chem. Soc. Rev. 45 (2016) 2239-2262. DOI:10.1039/C5CS00811E |
| [13] |
S. Hu, A. Trinchi, P. Atkin, I. Cole, Chem. Angew., Int. Ed. 54 (2015) 2970-2974. DOI:10.1002/anie.201411004 |
| [14] |
L. Wang, B. Li, F. Xu, et al., Biomaterials 145 (2017) 192-206. DOI:10.1016/j.biomaterials.2017.08.039 |
| [15] |
C. Hu, Y. Liu, J. Chen, Q. He, H. Gao, J. Colloid Interface Sci. 480 (2016) 85-90. DOI:10.1016/j.jcis.2016.07.007 |
| [16] |
S. Ruan, B. Zhu, H. Zhang, et al., J. Colloid Interface Sci. 422 (2014) 25-29. DOI:10.1016/j.jcis.2014.02.006 |
| [17] |
W. Xiao, Y. Li, C. Hu, et al., J. Colloid Interface Sci. 497 (2017) 226-232. DOI:10.1016/j.jcis.2017.02.068 |
| [18] |
X.F. Zhang, Y. Guo, Y.J. Li, Y. Liu, S.L. Dong, Chin. Chem. Lett. 30 (2019) 502-504. DOI:10.1016/j.cclet.2018.07.007 |
| [19] |
M. Li, J. Lu, K. Luo, et al., J. Am. Chem. Soc. 141 (2019) 4730-4737. DOI:10.1021/jacs.9b00574 |
| [20] |
Q. Xu, W.J. Yang, Y.Y. Wen, et al., Appl. Mater. Today. 16 (2019) 90-101. DOI:10.1016/j.apmt.2019.05.001 |
| [21] |
Y.L. Wang, S.Y. Liu, L.Y. Zhou, Chin. Chem. Lett. 23 (2012) 359-362. DOI:10.1016/j.cclet.2012.01.012 |
| [22] |
M. Naguib, V.N. Mochalin, M.W. Barsoum, Y. Gogotsi, Adv. Mater. 26 (2014) 992-1005. DOI:10.1002/adma.201304138 |
| [23] |
M. Naguib, J. Halim, J. Lu, et al., J. Am. Chem. Soc. 135 (2013) 15966-15969. DOI:10.1021/ja405735d |
| [24] |
O. Mashtalir, M. Naguib, V.N. Mochalin, et al., Nat. Commun. 4 (2013) 1716.
|
| [25] |
Q. Xu, L. Ding, Y. Wen, et al., J. Mater. Chem. C 6 (2018) 6360-6369. DOI:10.1039/C8TC02156B |
| [26] |
Q. Liu, D.B. Zhu, M.L. Guo, Y. Yu, Y.J. Cao, Chin. Chem. Lett. 30 (2019) 1639-1642. DOI:10.1016/j.cclet.2019.05.058 |
| [27] |
Q. Guan, J. Ma, W. Yang, et al., Nanoscale 11 (2019) 14123-14133. DOI:10.1039/C9NR04421C |
| [28] |
A. Ranjbaran, Front. Opt. 5 (2012) 284-291. DOI:10.1007/s12200-012-0275-9 |
| [29] |
O. Mashtalir, M.R. Lukatskaya, M.Q. Zhao, M.W. Barsoum, Y. Gogotsi, Adv. Mater. 27 (2015) 3501-3506. DOI:10.1002/adma.201500604 |
| [30] |
E.F. Simoes, J.C. da Silva, J.M. Leitao, Anal. Chim. Acta 852 (2014) 174-180. |
| [31] |
M. Boota, B. Anasori, C. Voigt, et al., Adv. Mater. 28 (2016) 1517-1522. DOI:10.1002/adma.201504705 |
| [32] |
M.W. Barsoum, A. Crossley, S. Myhra, J. Phys. Chem. Solids 63 (2002) 2063-2068. DOI:10.1016/S0022-3697(02)00195-6 |
| [33] |
R. Liu, W. Cao, D. Han, et al., J. Alloys. Compd. 793 (2019) 505-511. DOI:10.1016/j.jallcom.2019.03.209 |
| [34] |
A. Darlinski, J. Halbritter, Surf. Interface Anal. 10 (1987) 223-237. DOI:10.1002/sia.740100502 |
| [35] |
C.F. Miller, G.W. Simmons, R.P. Wei, Scr. Mater. 42 (2000) 227-232. DOI:10.1016/S1359-6462(99)00336-X |
| [36] |
Q. Xu, Y. Liu, C. Gao, et al., J. Mater. Chem. C 3 (2015) 9885-9893. DOI:10.1039/C5TC01912E |