 2020, Vol. 31


b Key Laboratory of Clinical and Medical Engineering, Department of Biomedical Engineering, School of Biomedical Engineering and Informatics, Nanjing Medical University, Nanjing 211166, China;
c Department of Clinical Laboratory, The Affiliated Drum Tower Hospital of Nanjing University Medical School, Nanjing 210008, China;
d Hunan Key Laboratory of Biomedical Nanomaterials and Devices, Hunan University of Technology, Zhuzhou 412007, China
The proposed system for the rapid and label-free identification of pathogens is based on the principle of laser scattering from the bacterial microbes. Scattered light intensity depends on the size, shape, and morphology of bacterial microbes. The features of data were extracted by using power spectral characteristics from the acquired time domain signal. SVM trained classifier can classify three different bacterial microbes: Enterococcus faecalis, Escherichia coli and Staphylococcus aureus.
The rapid detection of pathogens that cause foodborne diseases is necessary to provide a safe supply of hygienic food and water. The bacterial contamination in food and drinking water may cause a fatal outbreak among people and can have a significant public health impact, especially in populated areas. In China, foodborne diseases have often been reported, among them, 38%–56% of the cases are referred to pathogenic diseases [1].
Theproposed studydealswith theidentificationof threedifferent pathogenic bacteria, e.g., E. faecalis, E. coli, and S. aureus. These types of bacteria can cause severe diseases to the human body. E. faecalis is capable of producing a variety of infections, including endocarditis, urinary tract infections, wound infections, and so on [2]. The foodborne pathogenic E. coli contamination is widespread for food poisoning outbreaks. The pathogenic E. coli can cause extraintestinal infections, diarrhea, and hemolytic-uremic syndrome [3-5]. S. aureusis the primary causeof skin and soft tissue infections. It can lead to a range of diseases, from minor skin infections to life-threatening conditions, such as skin infection, bloodstream infection, sepsis, pneumonia, and toxic shock syndrome [6]. The early detection of microbial pathogens helps in reducing food contamination and improving food quality [7].
Nowadays, different latest techniques are being used for the identification of the pathogens and considered as the screening test for the identification of diseases. Polymerase chain reaction (PCR) is the remarkable discovery that has revolutionized the field of diagnosis, but PCR product contamination on opening a tube or pipette complicates the results [8-10]. Enzyme-linked immunosorbent assay (ELISA) involves several steps, such as reagent selection, temperature and volumemeasurement. The overall process requires more time, is non-economical, and affects the results if the parameters are not adjusted correctly [11, 12]. The matrix-assisted laser desorption ionization-time of flight mass spectrometry (MALDI-TOF) requires much expensive and complicated equipment and occupies more space [13]. The above-mentioned techniques are laborious, time-taking, non-economicalandneeda skilledpersonfor performing identification procedures. Hence, the givendrawbacksof standard methods preclude their common use for rapid and labelfree identification of pathogenic bacteria [14-16].
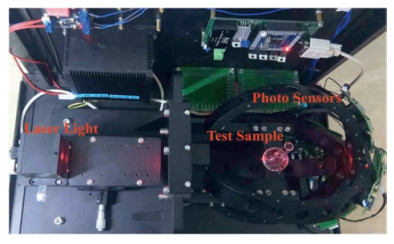
The proposed system for pathogen identification works on the basic principle of laser scattering from the microbes. The intensity of the scattered light increases when the bacterium passes through the center of beam and then decreases as it moves out of the beam. Therefore, different bacterial microbes exhibit their unique patterns of scattered light. The surrounding photodetectors convert the acquired scattered light into a voltage waveform. The assembly of hardware is divided into three parts: (a) laser light, (b) photo-detectors and (c) data acquisition system. The laser light used in the system has a wavelength of 660 nm with a power rating of 150 mW. The wavelength of laser light must be smaller as compared with the sizes of particles. Laser light is horizontally polarized and focused on the center of curvature of the sample flask by adjusting the three-axis positioning system.
After placing a sample inside the chamber, shine the laser through the sample flask. The scattered light received by twelve photo-detectors surrounded by the flask in the forward direction. High-speed silicon photodiode 'FDS100' was used to convert the light signal to an electrical signal (voltage), and an operational amplifier 'AD8675' amplifies the acquired signal. The positioning of photodetectors for collecting the scattered light is based on Mie scattering plot. Mie scattering theory provides a mathematical description of the light scattered by a spherical particle and estimates the intensity of scattered light at different angles [17]. All the bacterial microbes are non-spherical, and their dimensions vary from 1 μm to 4 μm in proposed study. The strength of scattered light depends on the type of bacterial microbes, and different microbes exhibit different scattered light patterns. Mie plot predicts that the maximum intensity of scattered light occurs in the forwarding direction [18, 19]. Therefore, the positioning of twelve photodetectors is adjusted in forward direction. Fig. 1 shows the overall schematic design of the hardware. The national instrument device PCI 6225 was used for data collection with 1 kHz frequency of sampling. PCI-6225 is interfaced with MATLAB software to process the acquired data for developing a classification algorithm for bacterial identification. The internal structure and different components of the prototype are shown in Fig. 2.

|
Download:
|
| Fig. 1. Components and schematic of the rapid bacterial identification system. The system integrates three major components: Laser light, sample and assembly of sensors. | |

|
Download:
|
| Fig. 2. Components and schematic of the rapid bacterial identification system. The system integrates three major components: Laser light, sample and assembly of sensors. | |
The features extraction method based on power spectrum characteristics was developed by Rami et al., and the given technique was adopted for pathogens identification system with some modification [20]. One of the important characteristics of the acquired signal is the variation in waveforms associated with different types of bacteria. The feature extraction technique involves a discrete Fourier transform (DFT) to transform the time-domain signal to a frequency domain signal. A qualitative description of the frequency-domain signal was performed using statistical methods on the acquired signal spectral amplitude and spectral sparsity.
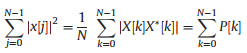
The acquired data were segmented into small parts by the windowing technique. The features were extracted from each segment of data known as the analysis window. The time-domain signal of length N is represented by x[j] with sampling frequency fs, where j represents the time instant. The bacteria information within a time-domain signal is represented by a function of frequency X[k] by taking DFT, where k is the frequency index value. The purpose of derivation from time-domain signal to frequency domain signal is based on Parseval's theorem, which states that the summation of the square of the function is equal to the summation of square of its transform (Eq. 1).
|
(1) |
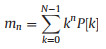
The expression acquired from Parseval's theorem was used to evaluate the phase-excluded power spectrum P[k], given by the multiplication of X[k] by its conjugation X*[k] divided by N. By applying the Fourier transform on the signal, the acquired frequency description of the signal shows symmetric response with respect to zero frequency. Due to the symmetrical response, all the positive and negative frequencies were utilized to estimate the power spectral density. The time-domain signal cannot be used directly to find the power spectral density. The power spectral features were acquired by applying the definition of a moment m of the nthorder of power spectral density P[k] given by Eqs. 2-5 [21]:
|
(2) |
Zero-order moment: This first feature of the waveform is related to the total power in the frequency domain.

|
(3) |
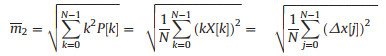
Second and fourth-order moments: The second feature of the waveform is represented by the second moment, and the modified spectrum k2P[k] is related to the product of frequency function X[k] and k, given as (Eq. 4):
|
(4) |
By taking the square of the modified spectrum, give the third feature as the root squared fourth-order moment (Eq. 5):

|
(5) |
A power transformation applied for normalizing the range of mo, m2 and m4m4 and to reduce the noise effect on all features based on moments, where the value of λ is empirically fixed to 0.1 [22]. The three features acquired from the above equations are represented by Eqs. 6-8:

|
(6) |
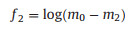
|
(7) |
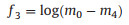
|
(8) |
Sparseness: The fourth feature is defined as the energy of a vector packed into only a few components and represented by Eq. 9:
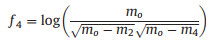
|
(9) |
Waveform length ratio (WLR): The fifth feature of the waveform is the summation of the absolute value of the signal derivative. However, the given function is independent of the scale of amplitude of waveform (Eq. 10).
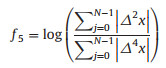
|
(10) |
The proposed system acquired the signal from 12 different photodetectors with a sampling rate of 1 kHz. Five different features were extracted from the received signal by each photodetector and formed a vector represented by f = [f1, f2, f3, f4, f5]. Therefore, the total number of 60 features was created from 12 different channels.
Two different techniques for features selection were applied to the extracted features: Differential evolution based feature selection method (DEFS) and minimal-redundancy-maximal-relevance criterion (mRMR). The DEFS was proposed by Rami et al. to utilize a combination of differential evolution (DE) optimization technique and a statistical repair mechanism. The features selection method was based on features distribution measures for finding a defined size of optimal features [23]. DEFS algorithm uses a classifier to estimate the weight accuracy for evaluating the classification ability. Two different classifiers, k nearest neighbor (KNN) and support vector machine (SVM) were considered to find out the best classification results for features subset selection using DEFS. In mRMR, features selection is dependent on mutual information of maximum dependency, maximum relevance, and minimum redundancy criteria. The mRMR algorithm, the selection of best features, is based on the maximal statistical dependency criterion by using the mutual information [24, 25]. The joint selection of features was used to increase the wrapper selection of features in achieving a higher classification accuracy and fast speed. The above-mentioned techniques were applied to the acquired data features from different experiments for the selection of best features. The features selection method was selected by finding the percentage classification accuracy of each method by applying different classifiers.
SVM is a supervised learning technique and considered to be a robust classification method based on statistical learning theory [26, 27]. In this study, LIBSVM algorithm package was adopted, which is one of the widely known state of the art tool for SVM as machine learning classifier. LIBSVM provides four essential kernel functions: linearity, polynomial, radial basis function, and sigmoid. The sigmoid kernel function was chosen for training a classifier because it shows a better boundary response in given data [28]. The optimal utilization of all information in the training data was achieved by evaluating the cross-validation of the trained model. In cross-validation, the data set was divided into k subsets from which k-1 set was used for training a model and the remaining one was used for evaluation. Repeat cross-validation for all the possible choices of k subsets.
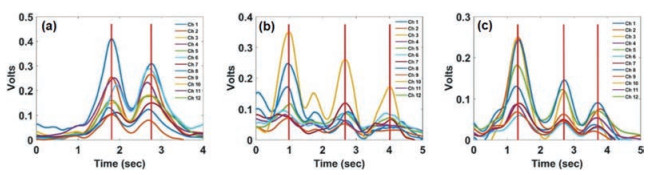
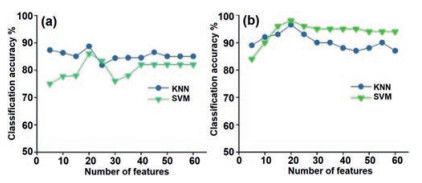
Different experiments were performed to collect the data from bacterial samples for training a classifier. Ten different samples of each bacterium, e.g., E. faecalis, E. coli, and S. aureus were used for collecting data. Fig. 3 shows the acquired signal by the scattering of light from the bacterial microbes at an instant of time. Each waveform shows unique signal patterns due to the distinct shapes and sizes of bacteria, which gives a qualitative approximation of the expected results. In each figure, an instant of time when the bacteria passed through a laser beam is represented by a vertical red line. The features reduction methods were applied to reduce the dimensionality and find the best features. Two different approaches, DEFS and mRMR were used to the extracted features, and one of the methods was selected based on higher classification accuracy. Since the specific size of most predictive features subset is unknown, so the particular number of features was varied from 5 to 60 with an increment size of 5 on each iteration. KNN and SVM classifiers were used for finding the classification accuracy based on particular features subset in both cases of DEFS and mRMR. The classification performance was evaluated with 10-fold crossvalidation on the training set of given datasets. The average classification result for DEFS gave higher accuracy when the features subset size was 20 as shown in Fig. 4a. Overall, the accuracy curve of each classifier shows non-linear behavior. On the other hand, mRMR features selection method also gave higher classification accuracy when the features subset was 20 as shown in Fig. 4b. Hence, both methods were giving a higher efficiency at a subset size of 20, but selected features from both methods were different. Using DEFS with features subset size of 20, classifiers KNN and SVM give classification accuracy of 88.7% and 86%, respectively. While mRMR with classifiers KNN and SVM provides higher accuracy value of 96.5% and 98%. The mRMR method provides higher classification accuracy as compared with DEFS, and the given results validate the application of mRMR with selected subset of 20 features by using SVM.

|
Download:
|
| Fig. 3. The waveform peak values are showing laser light scattering measurements: (a) E. faecalis, (b) S. aureus, and (c) E. coli. | |

|
Download:
|
| Fig. 4. Average classification accuracies obtained from KNN and SVM classifier by means of features selection methods: (a) DEFS (b) mRMR. | |
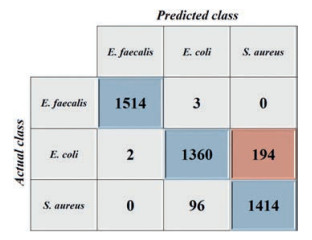
The classification performance was evaluated using a confusion matrix provided in Fig. 5, the columns represent the predicted class of bacterial microbes, while the rows represent the actual class of the microbes. To understand the confusion matrix, the value 1514 in the first row and the first column corresponds to correctly predicted values of E. faecalis out of an actual number of 1517 values of E. faecalis. Similarly, the second row corresponds to the actual class values for E. coli and implies that 1360 values are correctly classified as E. coli. In this way, the classification results for S. aureus can be estimated.

|
Download:
|
| Fig. 5. Confusion matrix for the proposed bacterial identification system using SVM. | |
The overall classification accuracy of the trained model is 93.6%, and the classification accuracies for E. faecalis, E. coli and S. aureus are 99%, 87%, and 94%, respectively. Furthermore, the given results are promising and validate the system for the rapid identification of pathogens. This paper presented an automated bacterial identification based on time-domain features extraction using power spectral of signals and mRMR features reduction method. Furthermore, SVM has been turned out as the more powerful machine learning approach for general-purpose supervised classification [29].
In summary, bacterial microbes were considered as small particles. The different bacterial microbes have a distinct shape, size, and internal characteristics, which result in distinct light patterns when the laser beam passes through microbes. Three different bacterial samples, E. faecalis, E. coli and S. aureus, were investigated, and the scattered light from the bacterial microbes was collected by the surrounding photo-detectors. The overall results show that the system can detect and identify samples with as few as 50–60 microbes in a volume of 10 mL. The rapid bacterial identification method is label-free and does not require any skilled or trained person to operate the system. The system does not require any lengthy sample preparation methods. The overall process for bacterial identification system takes around 30 min from an isolated colony or pure liquid culture. The primary laboratory tools, distilled water, and reusable sample vials are required for performing identification test that makes the system inexpensive as compared with other identification methods. The testing time and cost-effectiveness of the approach may further support its application in medical diagnostics, food safety, and industries seeking rapid identification technology. The given study proves the feasibility of bacterial identification using laser light scattering and SVM.
Declaration of competing interestThe authors declare that they have no known competing financial interests or personal relationships that could have appeared to influence the work reported in this paper.
AcknowledgmentsThis research was financially supported by the National Key Special Science Program (No. 2017YFA0205301), the National Natural Science Foundation of China (Nos. 61527806, 61971187, 61901168, 81902153, 61971216 and 61401217), the Clinical Advanced Technology of Social Development Projects in Jiangsu Province (No. BE2018695), Natural Science Foundation of Jiangsu Province (No. BK20140900), and key project supported by Medical Science and Technology Development Foundation, Nanjing Department of Health (Nos. ZKX18029 and ZKX18016), and the joint fund of Southeast University and Nanjing Medical University.
| [1] |
X.W. Wang, L. Zhang, L.Q, et al., Appl. Microbiol. Biotechnol. 76 (2007) 225-233. DOI:10.1007/s00253-007-0993-x |
| [2] |
A.K. Jha, H.P. Bais, J.M. Vivanco, Infect. Immun. 73 (2005) 464-475. DOI:10.1128/IAI.73.1.464-475.2005 |
| [3] |
S. Wang, Y. Zhang, L. Zhang, et al., Chin. Chem. Lett. 29 (2018) 1513-1516. DOI:10.1016/j.cclet.2018.08.002 |
| [4] |
J.B. Kaper, J.P. Nataro, H.L.T. Mobley, Nat. Rev. Microbiol. 2 (2004) 123-140. DOI:10.1038/nrmicro818 |
| [5] |
Z. Hong, D. Chen, W. Zhou, et al., Nanosci. Nanotechnol. Lett. 10 (2018) 1606-1612. DOI:10.1166/nnl.2018.2809 |
| [6] |
J.R. Johnson, T.A. Russo, J. Lab, Clin. Med. 139 (2002) 155-162. DOI:10.1067/mlc.2002.121550 |
| [7] |
R.A. Weinstein, M.J.M. Bonten, D.J. Austin, M. Lipsitch, Clin. Infect. Dis. 33 (2001) 1739-1746. DOI:10.1086/323761 |
| [8] |
S. Yang, R.E. Rothman, Lancet Infect. Dis. 4 (2004) 337-348. DOI:10.1016/S1473-3099(04)01044-8 |
| [9] |
Y. Yamamoto, Clin. Diagn. Lab. Immunol. 9 (2002) 508-514. DOI:10.1128/CDLI.9.3.508-514.2002 |
| [10] |
D. Zhou, J. Luo, T. Sun, et al., Nanosci. Nanotechnol. Lett. 11 (2019) 136-142. DOI:10.1166/nnl.2019.2861 |
| [11] |
P. Dakrong, H. Yusuke, Nano-Micro Lett. 9 (2017) 113-121. |
| [12] |
W. Li, A. Nie, Q. Li, et al., Mater. Express 9 (2019) 484-491. DOI:10.1166/mex.2019.1511 |
| [13] |
J. Deng, L. Fu, R. Wang, et al., J. Thorac. Dis. 6 (2014) 539-544. DOI:10.3978/j.issn.2072-1439.2014.02.20 |
| [14] |
L.M. Schlecht, B.M. Peters, B.P. Krom, et al., Microbiology 161 (2015) 168-181. DOI:10.1099/mic.0.083485-0 |
| [15] |
L. Wang, Q. Lin, J. Chen, et al., Nanosci. Nanotechnol. Lett. 11 (2019) 998-1003. DOI:10.1166/nnl.2019.2970 |
| [16] |
L. Huang, D. Zhang, L. Jiao, et al., Chin. Chem. Lett. 29 (2018) 1853-1856. DOI:10.1016/j.cclet.2018.11.028 |
| [17] |
D.L. Haavig, K.R. Hollen, A.E. Debruin, et al., J. AOAC Int. 100 (2017) 1836-1847. DOI:10.5740/jaoacint.17-0097 |
| [18] |
M. Hussain, M. Lv, J. Xu, et al., IEEE International Symposium on Medical Measurements and Applications, Istanbul, Turkey, 2019.
|
| [19] |
M. Hussain, M. Lv, X. Dong, et al., J. Nanosci. Nanotechnol. 20 (2020) 4047-4056. DOI:10.1166/jnn.2020.17491 |
| [20] |
R.N. Khushaba, M. Takruri, J.V. Miro, S. Kodagoda, Neural Netw. 55 (2014) 42-58. DOI:10.1016/j.neunet.2014.03.010 |
| [21] |
R.N. Khushaba, L. Shi, S. Kodagoda, IEEE International Symposium on Communications & Information Technologies, Gold Coast, Australia, 2012.
|
| [22] |
A.H. Al-Timemy, R.N. Khushaba, G. Bugmann, J. Escudero, IEEE T. Neur. Sys.Reh. 24 (2016) 650-661. DOI:10.1109/TNSRE.2015.2445634 |
| [23] |
R.N. Khushaba, A. Al-Ani, A. Al-Jumaily, Expert Syst. Appl. 38 (2011) 11515-11526. |
| [24] |
P. Hanchuan, L. Fuhui, C. Ding, IEEE Trans. Pattern Anal. Mach. Intell. 27 (2005) 1226-1238. |
| [25] |
S. Raj, K.C. Ray, IEEE T. Instrum. Meas. 66 (2017) 470-478. DOI:10.1109/TIM.2016.2642758 |
| [26] |
M.A. Aslam, C. Xue, K. Wang, et al., Nano Biomed. Eng. 12 (2020) 1-3. |
| [27] |
W. Yan, K. Wang, H. Xu, et al., Nano-Micro Lett 11 (2019) 7. |
| [28] |
C.C. Chang, C.J. Lin, ACM T. Intel. Syst. Tec. 2 (2011) 27. |
| [29] |
N. Goudarzi, M. Goodarzi, M.A. Chamjangali, et al., Chin. Chem. Lett. 24 (2013) 904-908. |