 2020, Vol. 31


b College of Bioresources and Materials Engineering, Shaanxi University of Science & Technology, Xi'an 710021, China;
c Bioinspired Engineering and Biomechanics Center (BEBC), Xi'an Jiaotong University, Xi'an 710049, China
Fluorescent chemosensors have become powerful tools for applications in various fields [1-6]. They could make detection and identification of certain substrates, while a large number of review articles have been reported, such as detection of enzymes activity [7], transition metal cations [8], pHs [9], chemical warfare [10], reactive oxygen species [11]. In terms of optical detection frequently used nowadays, general spectroscopy measurements utilizing sophisticated instruments such as fluorescence spectroscopy, UV–vis absorption spectroscopy, 96 well plate reader and circularly dichroism spectropolarimetry, are often required. However, the instrumentations are usually costly, not readily field deployable, and operation could be time-consuming. Thus, technologies using simple, efficient, and ideally integrated systems are in great chasing [12]. In 2002, Citterio and co-workers introduced digital color analysis [13]. They utilized digital information of visual colorimetry, which was applied to a lithium ion sensor system with the color matching functions as response to lithium ions. In addition, Bunz et al. utilized digital color analysis to interconvert of photographic emission spectroscopy through the colorimetric changes of pyridine substituted cruciform fluorophores in the presence of carboxylic acids [14, 15]. However, analytical processes in these works were complex for both data extraction and output analysis.
Previously, we developed a new photography technology for differentiation and quantitation of G- and V-nerve agent mimics coupled with fluoride and thiol self-propagating cascades [16]. While in this article, we are aiming to generalize this image analysis pipeline through digital analysis of chromaticity and luminosity via a GitHub to perform fluorescence detection [16]. This approach can be used on general fluorescent probes with fluorometric signal responses towards various targets for qualitative and quantitative analysis. Instead of complex instruments for the signal detection, we monitored the fluorescence images under a self-made dark-box by a common cellular phone camera. Photographic images of each reaction in a 96-well plate are digitally patterned to identify the individual reaction well, and their pixel values are sampled. Chromaticity/luminosity of the pixel for each well are mapped onto the CIE 1931 xyY color space. The photography of calibration wells with known concentrations of analyte formed linear calibration curves against which the unknown samples' chromaticities are then compared. The standard curves are informative for calibration to infer unknown analyte concentration as reflection of the certain chemical reaction. Linear calibration curves and quantitative analysis of unknown samples with low errors through the spectral technology of chromaticity and luminosity demonstrated the reliability of this method which is promising for use in a wide scope of this field.
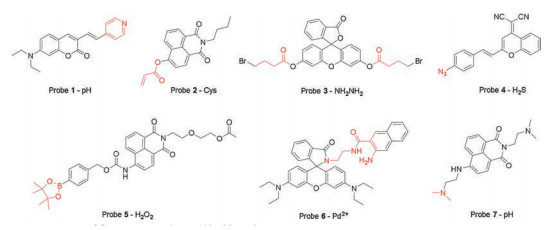
To testify this, we synthesized seven common fluorescent probes with different color distributions, for the evaluation of changes in responses to pH, Cys, NH2NH2, H2S, H2O2 and Pd2+, respectively (Fig. 1) [17-23]. Their emission distribution of the typical fluorescent probes covers the certain ranges of visible light, including fluorescein (λex = 450 nm, λem = 520 nm), naphthalimide (λex = 410 nm, λem = 540 nm), rhodamine (λex = 420 nm, λem = 590 nm), coumarin (λex = 496 nm, λem = 616 nm) and benzopyran (λex = 520 nm, λem = 670 nm). In these examples, probes 1, 2, 5 and 6 generates ratiometric signal changes, while probes 3, 4 and 7 generates singular turn-on signals. In terms of tools and technological process for photo images (Fig. 2), we took an approach, one that would replace a conventional 96-well plate reader, be inexpensive, and portable device could be constructed in the field [16].

|
Download:
|
| Fig. 1. Structures of fluorescence probes used in this study. | |

|
Download:
|
| Fig. 2. Schematic illustration of the general strategy for preparation of samples, photos taken and digital analysis of chromaticity and luminosity through photography. | |
In these approaches, ratiometric signal sensing has the potential to provide higher sensitivity and reliability due to the inherent self-calibration provided through monitoring multiple emissions [24, 25]. Previously, we also demonstrated that chromaticity is more informative than luminosity in measuring ratiometric fluorescence changes [16]. Thus, in analysis of ratiometric signal changes herein, we sought to use information of chromaticity and photographic technique to analyse probes 1 and 2 in response to pH and cysteine, respectively. As can be revealed by Fig. 3A, emission of probe 1 in wells 1–10 shifted from green to red with decreasing of pH changes (pH: 7.82, 6.16, 5.86, 5.58, 5.26, 4.96, 4.66, 4.36, 4.06, 3.39) which can be easily captured by the naked eye. The protonation of pyridine in probe 1 triggered the intramolecular electron transfer (ICT) effect causing the large red-shift of the signals [17]. It should be noted that the fluorometric photos were recorded instantly after pH changes for the samples. The representative chromaticities followed a linear trend in xy space with decreasing pH values. While in photographical analysis of cysteine by probe 2 (Fig. 3B), color of fluorescence images were changed from blue to yellow with increasing doses of Cys triggers (0, 13.3, 26.6, 40.0, 50.0, 63.3, 73.3, 80.0, 86.6, 100.0 μmol/L) in wells 1–10. The electron-withdrawing carbonyl group in probe 2 was cleaved by Cys, which triggered stronger electron-push capacity of oxygen for the optical changes [18]. The images were recorded after 30 min until the reactions complete (Figs. S1 and S6 in Supporting information). The chromaticities also followed a good linear trend in xy space with increasing concentrations of cysteine. Thus, representative chromaticities from our calibration wells tended to be linearly distributed across all experiments and the linearity is a consequence of ratiometric fluorescence which can potentially provide calibration curves for the detection of unknown samples.

|
Download:
|
| Fig. 3. Fluorescence photo images and chromaticities for probe 1 (A) and probe 2 (B); Fluorescence photo images and luminosity for probe 3 (C) and probe 4 (D); Linear relationship between fluorescence luminosities and NH2NH2 in probe 3 (inset in C) and H2S doses in probe 4 (inset in D). (A) pH titrations (1-10 wells): 7.82, 6.16, 5.86, 5.58, 5.26, 4.96, 4.66, 4.36, 4.06, 3.39); (B) Cys titrations (1-10 wells): 0, 13.3, 26.6, 40.0, 50.0, 63.3, 73.3, 80.0, 86.6, 100.0 μmol/L; (C) NH2NH2 titrations (1-10 wells):0, 4.0, 6.0, 8.0, 10.0, 12.0, 16.0, 20.0, 24.0, 28.0 μmol/L; (D) H2S titrations (1-10 wells): 0, 16.6, 33.2, 49.8, 66.4, 83.0, 99.6, 116.2, 132.8, 149.4 μmol/L. | |
In addition to ratiometric signal responses, singular turn-on sensing by fluorescence probes usually generates low detection limit, fast response and high selectivity [26, 27]. Also, turn-on chemosensors are the most common examples owing to the design easiness and structural diversity. In this project, we found out that Y portion in CIE 1931 xyY color space symbols luminosity. Herein, in analysis of turn-on fluorescence changes in probes 3 and 4, we sought to use our luminosity and photographic technique to quantitate NH2NH2 and H2S, respectively. Reaction between probe 3 and hydrazine, transformed fluorophore structure into ring open form, causing the fluorescence turn-on [22]. In Fig. 3C, images brightness from samples of probe 3 increased gradually in a dosedependent manner with NH2NH2 triggers (0, 4.0, 6.0, 8.0, 10.0, 12.0, 16.0, 20.0, 24.0, 28.0 μmol/L) in wells 1–10 while the color compositions keep constant and representative pixels change only in luminosities. The fluorometric photos were taken after 15 min (Fig. S2 in Supporting information). The luminosities from wells 1– 10 followed a good linear trend in Y space with increasing concentrations of hydrazine, with R2 = 0.98 (Fig. 3C inset). Next in analysis of H2S by probe 4 (Fig. 3D), azido moiety in 4 could be converted to amino-group by H2S to recover the electron donating ability [23]. This reactive behaviour results in the fluorescence enhancement after addition of H2S triggers (0, 16.6, 33.2, 49.8, 66.4, 83.0, 99.6, 116.2, 132.8, 149.4 μmol/L) in wells 1–10 (Fig. 3D). The fluorometric changes were recorded after 60 min for fluorescence photo collection (Fig. S3 in Supporting information). As well, luminosities of samples followed a good linear trend in Y space with increasing concentrations of hydrogen sulfide (R2 = 0.99) (Fig. 3D inset). Thus, luminosities from our calibration wells demonstrated a good linear trend across these experiments which can potentially provide standard curves.
We have thus demonstrated that photographic diagnostic methods coupled with ratiometric and turn-on fluorescence probes. The digitally processed chromaticity and luminosity presented good relationships in xy or Y space through photography. On the basis of these results, our methodology for analyzing substances through photography can be used to differentiate and quantitate various analytes. Fluorescence chromaticity and luminosity as a powerful tool for the detection of certain analytes have been testified above. Rapid and precise detection of unknown samples is a critical goal for the in situ detection in real environment.
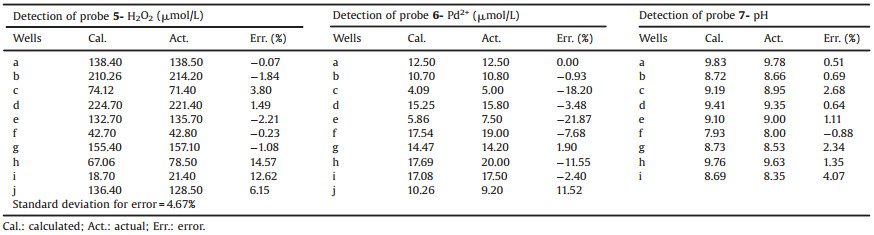
In the next study, we applied our methodology to quantitate unknown samples through calibration curves with standard samples (Fig. 4). Probe 5 and probe 6 were employed in the chromaticity investigation in response to H2O2 and Pd2+, which all output ratiometric fluorescence signals [19, 20]. In Figs. 4A and B, probes 5 and 6 in samples (wells 1–10) were incubated with standards of H2O2 and Pd2+, respectively (Figs. S4 and S5 in Supporting information), across a range of concentrations near the expected concentration of the unknown analyte to generate calibration curves. Unknown samples were juxtaposed in the same 96-well plates for imaging consistency. Chromaticities from the calibration wells (1–10) were used to construct calibration curves: each curve is a piecewise linear interpolation between each successive calibration well's representative chromaticities. Analyte concentrations for each unknown sample (a–j) was inferred and calculated by interpolation of the standard analytes [16]. Next, pHtriggered fluorescence turn-on in probe 7 was to analyse unknown samples through luminosity [21]. In Fig. 4C, pH in samples (1–9) were incubated with standards of probe 7. Good linear relationship formed between luminosity and standard samples to generate a calibration curve with R2 = 0.99. On the basis, all other wells containing unknown analytes were calculated to generate the theoretical doses of sample to compare with input of the actual doses.

|
Download:
|
| Fig. 4. Fluorescence photo images; chromaticity for standard and unknown samples in probes 5 (A) and 6 (B). Luminosity for standard and unknown samples from 7 (C). (A, top) Wells 1-10 are standard samples of known H2O2 concentrations (0, 28.57, 57.14, 85.71, 114.29, 142.29, 171.43, 200.0, 228.57, 257.14 μmol/L); Wells a-j are unknown samples. (B, top) Wells 1-10 are standard samples of known Pd2+ concentrations (0, 6.6, 8.3, 10.0, 11.6, 13.3, 15, 16.6, 18.3, 25 μmol/L); Wells a-j are unknown samples. (A, B, bottom) Chromaticities of randomly sampled pixels from calibration wells 1-10 are represented as color-coded open circles and unknown samples are overlaid as points. (C, top) Wells 1-9 are standard samples of known pH (7.5, 8.5, 8.7, 8.9, 9.1, 9.3, 9.5, 9.7, 9.9); Wells a-i are unknown samples. (C, bottom) Luminosities of randomly sampled pixels from calibration wells 1-9 are represented as color-coded open circles and the unknown samples are overlaid as points. (C, inset) Linear relationship between fluorescence luminosities and pH in probe 7. (D) The structures of probes 5, 6, 7 and react with H2O2, Pd2+ and H+ respectively. | |
As was revealed in Table 1, almost all the errors are below 20% and sample of well (a) in detection of Pd2+ showed zero error. Overall, the calculation of standard deviation for all errors was 4.67%. To further test the reliability of this photographic technology, we monitored and analysed the fluorescence images of probe 2 resulting from different cell phones, including Huawei, Xiaomi and Apple brands, respectively (Fig. S7). The standard deviations for errors were 11.71%, 11.16% and 3.06% respectively (Tables S1–S3 in Supporting information). In addition, we then carried out experiments for the investigation of selectivity for probes 3 and 5 in the presence of other biological substrates (Figs. S8 and S9 in Supporting information). The photographical analysis showed the similar pixels and thus testified the barely interferences to the luminosity and chromaticity from other substances. We have thus demonstrated that our approach of image analysis is reliable for fluorescence signal amplification which has potential for further applications.
|
|
Table 1 Prediction of unknown samples through probes 5, 6 and 7. |
In summary, we generalized an approach which can be employed for the differentiation and quantitation of analytes through fluorescence chromaticity and luminosity. This is to realize a fast, easy-operation and precise way using fluorescence probes to quantify analytes to facilitate detection. Seven representative fluorescent probes were synthesized and tested in the corresponding experiments. A self-made dark-box, a cell phone, and 96-well plates were utilized as portable devices. Photographic images were digitally processed to generate calibration curves between chromaticity/luminosity verse concentrations after mapping to the CIE 1931 xyY standard color space. Good linear calibration curves and quantitative analysis of unknown samples with low errors through the spectral technology demonstrated the reliability of this method. The analytical method of photography coupled with a simple and on-site constructible/portable device can be employed for further applications. The limitations of this method include not real portable device was constructed thus data analysis has to be operated through computer. Additionally, for the detection of unknown samples, standard samples have to be used for calibration each time. The range of the concentrations of standard samples was not easily determined. Furthermore, it is a challenge to apply this photography technology into bio-imaging detection in a complex environment.
Declaration of competing interestThe authors declare no competing financial interest.
AcknowledgmentsThis work is supported by the National Natural Science Foundation of China (No. 21907080), Natural Science Foundation of Shaanxi (No. 2020JM-069), Key Scientific Research Group of Shaanxi Province (No. 2020TD-009) and the Youth Innovation Team of Shaanxi Universities.
Appendix A. Supplementary dataSupplementary material related to this article can be found, in the online version, at doi:https://doi.org/10.1016/j.cclet.2020.07.012.
| [1] |
X. Sun, T.D. James, Chem. Rev. 115 (2015) 8001-8037. DOI:10.1021/cr500562m |
| [2] |
H. Duan, Y. Ding, C. Huang, et al., Chin. Chem. Lett. 30 (2019) 55-57. DOI:10.1016/j.cclet.2018.03.016 |
| [3] |
X. Sun, Q. Xu, G. Kim, et al., Chem. Sci. 5 (2014) 3368-3373. DOI:10.1039/C4SC01417K |
| [4] |
X. Sun, B.M. Chapin, P. Metola, et al., Nat. Chem. 11 (2019) 768-778. DOI:10.1038/s41557-019-0314-x |
| [5] |
L. Ding, Z. Tian, J. Hou, et al., Chin. Chem. Lett. 30 (2019) 558-562. DOI:10.1016/j.cclet.2018.12.013 |
| [6] |
S.H. Park, N. Kwon, J.H. Lee, J. Yoon, I. Shin, Chem. Soc. Rev. 49 (2020) 143-179. DOI:10.1039/C9CS00243J |
| [7] |
D. Chen, W. Qin, H. Fang, et al., Chin. Chem. Lett. 30 (2019) 1738-1744. DOI:10.1016/j.cclet.2019.08.001 |
| [8] |
L. Yu, Y. Qiao, L. Miao, Y. He, Y. Zhou, Chin. Chem. Lett. 29 (2018) 1545-1559. DOI:10.1016/j.cclet.2018.09.005 |
| [9] |
J.T. Hou, W.X. Ren, K. Li, et al., Chem. Soc. Rev. 46 (2017) 2076-2090. DOI:10.1039/C6CS00719H |
| [10] |
Y.J. Jang, K. Kim, O.G. Tsay, D.A. Atwood, D.G. Churchill, Chem. Rev. 115 (2015) PR1-PR76. DOI:10.1021/acs.chemrev.5b00402 |
| [11] |
L. Wu, A.C. Sedgwick, X. Sun, et al., Acc. Chem. Res. 52 (2019) 2582-2597. DOI:10.1021/acs.accounts.9b00302 |
| [12] |
J. Krüger, K. Singh, O'Neill A., et al., J. Micromech. Microeng. 12 (2002) 486-494. DOI:10.1088/0960-1317/12/4/324 |
| [13] |
K. Suzuki, E. Hirayama, T. Sugiyama, et al., Anal. Chem. 74 (2002) 5766-5773. DOI:10.1021/ac0259414 |
| [14] |
T. Schwaebel, S. Menning, U.H.F. Bunz, Chem. Sci. 5 (2012) 1422-1428. |
| [15] |
T. Schwaebel, O. Trapp, U.H.F. Bunz, Chem. Sci. 4 (2013) 273-281. DOI:10.1039/C2SC21412A |
| [16] |
X. Sun, A.A. Boulgakov, L.N. Smith, et al., ACS Cent. Sci. 4 (2018) 854-861. DOI:10.1021/acscentsci.8b00193 |
| [17] |
L. Long, X. Li, D. Zhang, et al., RSC Adv. 3 (2013) 12204-12209. DOI:10.1039/c3ra41329b |
| [18] |
B. Zhu, B. Guo, Y. Zhao, B. Zhang, B. Du, Biosens. Bioelectron. 55 (2014) 72-75. DOI:10.1016/j.bios.2013.11.068 |
| [19] |
D. Srikun, E.W. Miller, D.W. Dornaille, C.J. Chang, J. Am. Chem. Soc. 130 (2008) 4596-4597. DOI:10.1021/ja711480f |
| [20] |
S. Sun, B. Qiao, N. Jiang, et al., Org. Lett. 16 (2014) 1132-1135. DOI:10.1021/ol500284p |
| [21] |
J. Xie, Y. Chen, W. Yang, D. Xu, K. Zhang, J. Photochem. Photobiol. A:Chem. 223 (2011) 111-118. DOI:10.1016/j.jphotochem.2011.08.006 |
| [22] |
S. Goswami, K. Aich, S. Das, et al., RSC Adv. 4 (2014) 14210-14214. DOI:10.1039/c3ra46663a |
| [23] |
W. Sun, J. Fan, C. Hu, et al., Chem. Commun. (Camb.) 49 (2013) 3890-3892. DOI:10.1039/c3cc41244j |
| [24] |
M.H. Lee, J.S. Kim, J.L. Sessler, Chem. Soc. Rev. 44 (2015) 4185-4191. DOI:10.1039/C4CS00280F |
| [25] |
H. Xiong, L. He, Y. Zhang, et al., Chin. Chem. Lett. 30 (2019) 1075-1077. DOI:10.1016/j.cclet.2019.02.008 |
| [26] |
Y. Xia, X. Liu, D. Wang, et al., Chin. Chem. Lett. 29 (2018) 1517-1520. DOI:10.1016/j.cclet.2018.01.054 |
| [27] |
X. Sun, T.D. James, E.V. Anslyn, J. Am. Chem. Soc. 140 (2018) 2348-2354. DOI:10.1021/jacs.7b12877 |