 2020, Vol. 31


b State Key Laboratory of Oral Diseases, West China Hospital of Stomatology, Sichuan University, Chengdu 610041, China;
c State Key Laboratory of Hydraulics and Mountain River Engineering, College of Water Resource & Hydropower, Sichuan University, Chengdu 610065, China
For efficiently quantitative nucleic acid detection, noncovalent binding "light up" probes, i.e., nucleic acid fluorescent stains, are the most popular tools. Due to their specificity in recognizing different structures of nucleic acid (such as double-stranded DNA(dsDNA) and single-stranded DNA (ssDNA)), high signal to noise ratio, and simple operation, such stains have been widely used in DNA quantitative analysis (e.g., RT-PCR) [1, 2], gel electrophoresis [3, 4], fluorescent biosensors [5-8], and etc.
Ethidium bromide (EB) is the most classic DNA dye [9, 10], but suffers from high carcinogenicity. Therefore, scientists have been devoting to develop safer and more efficient DNA stains [11], such as the well-known commercial SYBR series from Invitrogen.Interestingly, many of the commercial stains that are claimed to be highly efficient for DNA analysis contain the core structure of benzothiazole ring, such as thiazole orange (TO) [12-14], SYBR Green Ⅰ (SG) [15-20], PicoGreen (PG) [21-25], SYBR Safe (SS)[26, 27], and thioflavine-T (ThT) [28-30]. Although the fluorescent performances of some SYBR dyes were studied [3, 31], the relationship between the structure and the DNA detection performance was not illustrated, which may frustrate the selection of dyes in practical DNA analysis.
Therefore, in this work, the sensitivity of the above benzothiazole-based dyes was compared for DNA quantitative analysis, with particular focus on the structure-performance relationship. The mechanism of the DNA-induced fluorescence lighting was attributed to efficient inhibition of the nonradiative transitions (e.g., rotations). Then, the fluorescent performance was evaluated through direct fluorescence DNA detection and gel electrophoresis. SG and PG exhibited the highest sensitivity with detection limit of ~0.2 nmol/L for direct fluorescence DNA detection and 0.61 ng for gel electrophoresis (20 bp, dsDNA). Through both experimental and theoretical investigations, the origin for the different fluorescent performance of the benzothiazole-based dyes was underlined. The results in this work may provide a reference for the selection of nucleic acid dyes in DNA analysis and future DNA-staining dye developments.
To study the sensitivity of the benzothiazole-based dyes for DNA detection, a protocol of probe DNA and target DNA was designed (Table S2 in Supporting information). Upon hybridization, dyes can bindwith theformeddsDNA (Scheme S1 in Supporting information). It has been reported that binding with dsDNA could result in inhibition of the non-radiative processes (e.g., vibration and rotation). To explain the mechanism of fluorescence lighting of the benzothiazole dyes (Fig. 1A), first theoretical calculation was explored. Structurally, SG, PG, SS and TO have the same core structure (Fig. 1A), which contain the benzothiazole (electron accepter) and 1, 4-dihydroquinoline (electron donor) moieties, showing a typical molecular motor feature. Therefore, such core structure was taken as a simplified computing model.

|
Download:
|
| Fig. 1. (A) Structures of benzothiazole-based DNA fluorescent dyes. (B) Scheme of the rotational mobility between dihedral angle of 90° and 0° (180°), with Jablonski diagram of the plausible mechanism showing inset. (C) Potential energy scan of ground state (black) and excited state (red) vs. dihedral angle (θ). (D) Oscillator strength vs. dihedral angle (θ). | |
Density functional theory (DFT) and time-dependent density functional theory (TD-DFT) calculations [32] verified the OFF/ON fluorescence of these stains after binding with dsDNA (Fig. 1B). As shown in Fig. 1C, coordinate-driving potential surface scanning of both ground and excited states indicated the existence of a dihedral angle (θ) between the benzothiazole and the dihydroquinoline moieties. A relaxation process along with the rotation began until the dihedral angle reached 90° (S1', the most-stable excited state) when excited. Under such vertical condition, fast non-radiative process would occur (such as twisted intramolecular charge transfer, TICT) due to the smallest energy gap (S1'→S0'). The oscillator strength (f) at such point is almost zero (Fig. 1D). As a result, the radiative process, i.e., fluorescence, is off under such condition. However, after binding with dsDNA, the rotation is expected to be hindered, resulting in suppressed nonradiative transitions (S1→S1'→S0') and enhanced f. Therefore, fluorescence transition (S1→S0) is activated. Although the structure of ThT is different from the above core structure, the fluorescence enhancement mechanism upon binding with dsDNA is expected to be similar [5, 33, 34].
Next, the spectroscopic features of the benzothiazole-based dyes before and after binding with dsDNA were investigated to support the dsDNA-induced inhibition of non-radiative transitions. For fluorescence, in the case of PG, the fluorescence of PG enhanced significantly with the increase of dsDNA concentration, with saturation point of over 1300 fold (Fig. 2A). Similar phenomena were also observed for the rest benzothiazole-based dyes (Figs. S2–S5 in Supporting information). Besides, the fluorescence lifetime of the dyes was also prolonged (Fig. 2B), with varying degrees for different dyes (Table 1).

|
Download:
|
| Fig. 2. (A) Fluorescent spectra of PG upon titrated with different concentration of dsDNA. (B) Corresponding lifetime titration of PG. (C) Comparison of the analytical performances of five dyes for dsDNA quantitative detection. (D) Calibration curve for DNA detection by varying the concentration of target DNA. nM: nmol/L. | |
|
|
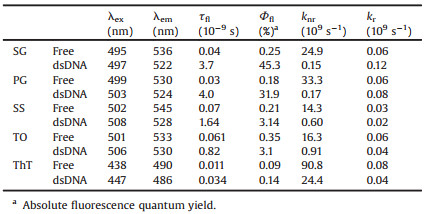
Table 1 Photophysical constants before and after binding with DNA. |
In order to directly reflected the change of radiative and nonradiative process before and after binding with dsDNA, the radiative (kr) and non-radiative transition constants (knr) were further calculated through following equations (Eqs. 1–3):
|
(1) |

|
(2) |

|
(3) |
Here, Φ is the quantum yield and τ is the fluorescence lifetime. Table 1 shows the kr and knr values of the benzothiazole-based dyes before and after binding with dsDNA. Although kr values increased somewhat, much more dramatically suppressed non-radiative transitions could be identified (up to 200 fold). Therefore, the fluorescence light up of these dyes can be ascribed to decreased non-radiative transitions upon binding with dsDNA.
Next, the analytical performances of the five dyes in DNA quantitative detection were compared. To maximize the sensitivity, the working concentration of the five dyes was optimized (Fig. S6 in Supporting information). Fig. 2C showed the fluorescence intensity change of the five dyes under the same concentration of dsDNA (100 nmol/L). Among these dyes, SG and PG showed the highest signal-to-noise ratios. To further compare the analytical sensitivity, the limits of detection (LOD) for DNA detection were evaluated. Calibration curves were firstly constructed (Fig. 2D), and LODs (3σ) were therefore obtained. As shown in Table S5 (Supporting information), SG and PG still gave the lowest LODs.
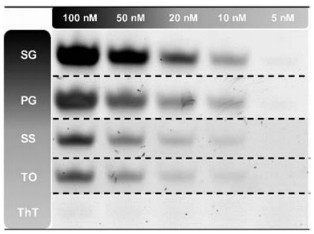
Besides fluorescence quantification, gel electrophoresis is another common method that can achieve qualitative and semiquantitative analysis of DNA. In order to compare the analytical sensitivity, dsDNA solutions (20 bp) with different concentration gradients (5-100 nmol/L) were added to different gel lines (Fig. 3). From the imaging results, SG showed the clearest fluorescent contrast. With dsDNA concentration of 5 nmol/L (0.61 ng), very weak band image could be still seen for SG or PG staining. Further grayscale quantitative analysis also confirmed the above results (Table S3 and Fig. S7 in Supporting information). As a result, the analytical performance for DNA quantitative analysis can be sorted as SG > PG > SS > TO > ThT.

|
Download:
|
| Fig. 3. Gel electrophoresis imaging of five dyes under different concentration gradients of 20 bp dsDNA. nM: nmol/L. | |
Besides the fluorescent performance comparison, the prices of these dyes were also taken into consider (Table S4 in Supporting information). For example, the fluorescence intensity of SG after binding with dsDNA was ~7 fold higher than that of SS (Fig. 2C), but the price of SG was just ~2 fold higher. For TO, though the sensitivity was ~2 fold lower than that of SS, its price is much lower. In fact, TO has been reported as an everyday replacement for costly DNA dyes in electrophoresis [35]. Therefore, upon compromising the analytical performances and prices (100×, 1 mL, 81.33 CNY), SG is the best choice for DNA detection. For gel electrophoresis analysis, SS and TO are the preferable choices.
Generally, such varied performances can be originated from two parts: the binding affinity to dsDNA and their intrinsic structural properties. First, the dsDNA binding constants (Ka) of the five dyes were evaluated via fluorescence titrations (see method details in Supporting information) [36]. As shown in Table S5, the values of Ka are positively correlated to their fluorescent performances (SG and PG the largest). The difference in binding constants may be originated from their structural diversity and also their interaction models with dsDNA. For example, TO is a typical base intercalator [37], while PG and SG are generally recognized as groove binders [15, 38]. Therefore, higher binding constants permit better DNA detection performances.
To illustrate the intrinsic structural properties of the benzothiazole-based dyes, theoretical calculation was carried out. Here the calculation was set at the dihedral angle of 0° as a hypothetical state after binding with dsDNA. The Egap between HOMO and LUMO and the relevant oscillator strength (f) were thus obtained (Fig. 4). The value of f relates to the allowance of radiation transition (larger oscillator strength reflects higher fluorescence lighting up) [39, 40], while Egap is directly associated with the absorption. As can be seen from Fig. 4, the Egap value of each dye correlates well with their absorption/excitation, indicating that the calculation here is reasonable. SG and PG exhibits similar oscillator strength, which agrees well with their fluorescence performances. For others, although the allowance of radiation transition is higher than SG and PG, their binding constants are significantly lower. Considering that the calculation was set at the dihedral angle of 0°, SG and PG with higher binding constants are expected to be more approaching the theoretical states over the rest dyes. Therefore, the practical oscillator strengths of SS, TO, and ThT will be much lower, thus resultingin lower performances.Overall, the theoretical results also confirmed the privilege of these dyes in DNA analysis.

|
Download:
|
| Fig. 4. The structures and HOMO and LUMO orbitals of the molecules. All the orbital information and oscillator strength (f) was calculated at the b3lyp/6-31 g (d) level based on the 0° dihedral angle between benzothiazole and quinoline ring at S1 states (vertical excitation). | |
In summary, the performances of five commercial benzothiazole-based dyes were compared for DNA detection. Upon both theoretical and photophysical investigations, the lighting up mechanism of these dyes were ascribed to efficient inhibition of non-radiative transition upon binding with dsDNA. For performance comparison, both fluorescence detection and gel electrophoresis were explored. It turned out that SG was the best choice for DNA detection, from both the analytical performance and commercial price point of view. The reasons for different fluorescence performances of the benzothiazole-based dyes were ascribed to their DNA binding affinity and intrinsic structural properties. The results in this work not only underlined the best choice for DNA analysis at the present stage, but also would be helpful for future development of efficient DNA-staining dyes.
Declaration of competing interestThe authors declare no competing financial interest.
AcknowledgmentsFinancial support from the Major Scientific and Technological Application Program of Chengdu (No. 2019-YF09-0081-SN), the Major Scientific and Technological Special Program of Sichuan Province (No. 2018SZDZX0027), and the Fundamental Research Funds for Central Universities (No. 2018SCUH0075), are greatly acknowledged.
Appendix A. Supplementary dataSupplementary material related to this article can be found, in the online version, at doi:https://doi.org/10.1016/j.cclet.2020.01.023.
| [1] |
C. Ramakers, J.M. Ruijter, R.H.L. Deprez, et al., Neurosci. Lett. 339 (2003) 62-66. DOI:10.1016/S0304-3940(02)01423-4 |
| [2] |
T.Y. Dong, G.A. Wang, M.W. Li, et al., Anal. Methods 11 (2019) 5376-5380. DOI:10.1039/C9AY01383K |
| [3] |
A.M. Haines, S.S. Tobe, H.J. Kobus, et al., Electrophoresis 36 (2015) 941-944. DOI:10.1002/elps.201400496 |
| [4] |
F. Vitzthum, G. Geiger, H. Bisswanger, et al., Anal. Biochem. 276 (1999) 59-64. DOI:10.1006/abio.1999.4298 |
| [5] |
X.Y. Luo, B.B. Xue, G.F. Feng, et al., J. Am. Chem. Soc. 141 (2019) 5182-5191. DOI:10.1021/jacs.8b10265 |
| [6] |
Y.S. Ding, X.T. Liu, J. Zhu, et al., Talanta 125 (2014) 393-399. DOI:10.1016/j.talanta.2014.03.032 |
| [7] |
P.J. Zhu, Y.Y. Zhang, S.X. Xu, et al., Chin. Chem. Lett. 30 (2019) 58-62. DOI:10.1016/j.cclet.2018.02.003 |
| [8] |
G.Y. Park, S.K. Chakkarapani, S. Ju, et al., Chin. Chem. Lett. 29 (2018) 505-508. DOI:10.1016/j.cclet.2017.08.018 |
| [9] |
J.B. Lepecq, C. Paoletti, Anal. Biochem. 17 (1966) 100-107. DOI:10.1016/0003-2697(66)90012-1 |
| [10] |
J.B. Lepecq, C. Paoletti, J. Mol. Bio. 27 (1967) 87-106. DOI:10.1016/0022-2836(67)90353-1 |
| [11] |
A.N. Glazer, H.S. Rye, Nature 359 (1992) 859-861. DOI:10.1038/359859a0 |
| [12] |
L.G. Lee, C.H. Chen, L.A. Chiu, Cytometry 7 (1986) 508-517. DOI:10.1002/cyto.990070603 |
| [13] |
H.S. Rye, M.A. Quesada, K. Peck, et al., Nucleic Acids Res. 19 (1991) 327-333. DOI:10.1093/nar/19.2.327 |
| [14] |
D.L. Boger, B.E. Fink, S.R. Brunette, et al., J. Am. Chem. Soc. 123 (2001) 5878-5891. DOI:10.1021/ja010041a |
| [15] |
H. Zipper, H. Brunner, J. Bernhagen, et al., Nucleic Acids Res. 32 (2004) e103. DOI:10.1093/nar/gnh101 |
| [16] |
X. Jin, S. Yue, K.S. Wells, et al., FASEB J. 8 (1994) 1266. |
| [17] |
W. Ma, S. Lu, D. Zhu, et al., Chin. Chem. Lett. 25 (2014) 482-484. DOI:10.1016/j.cclet.2013.12.013 |
| [18] |
H. Hu, J.Y. Zhang, Y. Ding, et al., Anal. Chem. 89 (2017) 5101-5106. DOI:10.1021/acs.analchem.7b00666 |
| [19] |
X.F. Zhang, C.P. Huang, S.X. Xu, et al., Chem. Commun. 51 (2015) 14465-14468. DOI:10.1039/C5CC06105A |
| [20] |
X.Y. Fan, Y.Y. Wang, L. Deng, et al., Anal. Chem. 91 (2019) 9407-9412. DOI:10.1021/acs.analchem.9b01675 |
| [21] |
X.S. Ren, Q.H. Xu, Langmuir 25 (2009) 43-47. DOI:10.1021/la803430g |
| [22] |
V.L. Singer, L.J. Jones, S.T. Yue, et al., Anal. Biochem. 249 (1997) 228-238. DOI:10.1006/abio.1997.2177 |
| [23] |
S.J. Ahn, J. Costa, J.R. Emanuel, Nucleic Acids Res. 24 (1996) 2623-2625. DOI:10.1093/nar/24.13.2623 |
| [24] |
A. Dragan, E. Bishop, Casas-Finet J.R., et al., Anal. Biochem. 396 (2010) 8-12. DOI:10.1016/j.ab.2009.09.010 |
| [25] |
D. Marie, D. Vaulot, F. Partensky, Appl. Environ. Microbiol. 62 (1996) 1649-1655. DOI:10.1128/AEM.62.5.1649-1655.1996 |
| [26] |
C. Martineau, L.G. Whyte, C.W. Greer, J. Microbiol.Methods 73 (2008) 199-202. DOI:10.1016/j.mimet.2008.01.016 |
| [27] |
W.E. Evenson, L.M. Boden, K.A. Muzikar, et al., J.Org.Chem. 77 (2012) 10967-10971. DOI:10.1021/jo3021659 |
| [28] |
G.T. Westermark, K.H. Johnson, P. Westermark, Thioflavin Stains, in:R. Wetzel (Ed.), Methods in Enzymology, Academic Press, Amsterdam, 1999, pp. 3-25.
|
| [29] |
X.H. Li, L.J. Gan, Q.S. Ou, et al., Biosens. Bioelectron. 66 (2015) 399-404. DOI:10.1016/j.bios.2014.11.049 |
| [30] |
J. Mohanty, N. Barooah, V. Dhamodharan, et al., J. Am. Chem. Soc. 135 (2013) 367-376. DOI:10.1021/ja309588h |
| [31] |
H. Hilal, J. Taylor, Dyes Pigment. 75 (2007) 483-490. DOI:10.1016/j.dyepig.2006.06.032 |
| [32] |
M.J. Frisch, G.W. Truck, H.B. Schlegel, et al., Gaussian 09, Revision D.01, Gaussian, Inc., Wallingford CT, 2013.
|
| [33] |
D. Su, C.L. Teoh, L. Wang, et al., Chem. Soc. Rev. 46 (2017) 4833-4844. DOI:10.1039/C7CS00018A |
| [34] |
N. Amdursky, Y. Erez, D. Huppert, Acc. Chem. Res. 45 (2012) 1548-1557. DOI:10.1021/ar300053p |
| [35] |
O'Neil C.S., J.L. Beach, T.D. Gruber, Electrophoresis 39 (2018) 1474-1477. DOI:10.1002/elps.201700489 |
| [36] |
K. Hirakawa, S. Kawanishi, T. Hirano, Chem. Res. Toxicol. 18 (2005) 1545-1552. DOI:10.1021/tx0501740 |
| [37] |
H.S. Rye, M.A. Quesada, P. Konan, et al., Nucleic Acids Res. 19 (1991) 327-333. DOI:10.1093/nar/19.2.327 |
| [38] |
A.I. Dragan, R. Pavlovic, J.B. McGivney, et al., J. Fluoresc. 22 (2012) 1189-1199. DOI:10.1007/s10895-012-1059-8 |
| [39] |
Z.Z. Shao, C. Zhang, X.H. Zhu, et al., Chin. Chem. Lett. 30 (2019) 2169-2172. DOI:10.1016/j.cclet.2019.06.023 |
| [40] |
S.S. Long, W.J. Chi, L. Miao, et al., Chin. Chem. Lett. 30 (2019) 601-604. DOI:10.1016/j.cclet.2018.12.008 |