 2020, Vol. 31


b Department of Radiology, Jiangsu Province Hospital, First Affiliated Hospital of Nanjing Medical University, Nanjing 210029, China
Zinc, as the second most abundant transition metal, is one of the indispensable trace elements in the human body [1]. A large amount of zinc bind to proteins, enzymes and other low molecular weight ligands in mammalian cells, but only picomolar zinc is free within cells [2-6]. However, free zinc ions participate in numerous crucial physiological and pathological processes. In cells, the concentrations of zinc ions is regulated by three main protein families: metallothioneins (MTs), zinc transport proteins (ZnT), and Zrt/Irt-like proteins (ZIPs) [7, 8]. MTs, which function as binding proteins and Zn2+ donors, not only bind Zn2+ with high affinity but can also release self-binding Zn2+ under the induction of nitrosation [9-11]. ZnT and ZIPs are two kinds of important zinc transporters, which are responsible for the input and output of intracellular zinc ions, respectively [12]. ZnT8, one of the ZnT families, is responsible for the transport of zinc in β cells, thus would affect the production, secretion and metabolism of insulin [13]. Scott et al. had reported that the concentration of zinc in diabetic cadavers is only half of that in non-diabetic cadavers [14]. Moreover, loss of zinc homeostasis has been associated with several neurological diseases, including Alzheimer's disease, Parkinson disease, amyotrophic lateral sclerosis, and prostate cancer [15, 16]. Notably, prostate cancer is the leading cause of cancer death in men, and causes no symptoms in its early curable stage. Considerable literatures indicate that the level of zinc ion in healthy prostate is ten times higher than other soft tissues. Moreover, the zinc content in peripheral zone of prostate would drastically reduce in the early stage of malignant prostate and the decreasing of zinc content precedes cancerization [17-21]. Based on these, the development of a powerful tool for the real time monitoring of Zn2+ distribution, uptake, and trafficking in living system is highly demanded.
Fluorescent techniques, which have been widely used in imaging various kinds of analytes in living cells and tissues, have some unique advantages, such as non-invasive, higher sensitivity, and excellent temporal-spatial resolution [22-26]. For a recent example, Xiao et al. designed a FRET based probe to research pH changes in lysosomes of macrophages during inflammation [27]. It is known that naphthalimide has been applied in the construction of various fluorescent probes [28]. To date, a wide variety of naphthalimide-based fluorescent probes and their biological applications have been developed as an efficiency labelling approach. For example, Guo et al. reported a highly selective and sensitive fluorescent chemosensor for Hg2+ [29]. Wang et al. developed a pH-resistant Zn2+ sensor derived from 4-aminonaphthalimide [6]. Cui et al. reported a ratiometric fluorescent probe for direct detection of N-acetyltransferase [30]. However, the naphthalimide-based fluorescent probes are still not widely used in intracellular labelling and imaging owing to its solvatochromism, and poor fluorophore brightness in aqueous solution [31]. By fusing a twisted water-soluble heterocycle onto naphthalimide scaffold, we have constructed a novel nonplanar and rigid fluorophore structures, which not only enhanced the rigidity, but also confirmed the nonplanarity of the fluorophore, and thus decreased the aggregation of the fluorogenic molecules [32]. Inspired by this work, herein, we designed a highly sensitive fluorescent probe for tracking intracellular zinc ions and direct imaging of prostatic tissue in mice by using this novel naphthalimide-based fluorophore and N, N-bis(2-pyridylmethyl)ethylenediamine (BPEN) as the receptor for zinc ions.
Probe ZnDN can be readily synthesized as we previously reported [6, 32] (Scheme S1 in Supporting information). Based on the fluorescent recognition mechanism of photo-induced electron transfer (PET), BPEN was introduced into the imide moiety of the naphthalimide fluorophore as the receptor of Zn2+.
We first conducted the pH-titration of the probe ZnDN and its Zn(Ⅱ) complex. The pH value of the test system was adjusted by HCl and NaOH solution. As shown in Fig. S4 (Supporting information), probe ZnDN emits very weak fluorescence at pH 4.0–9.0, which can be attributed to the PET processes from the aniline nitrogen to the fluorophore. While ZnDN–Zn(Ⅱ) complex exhibits the enhanced fluorescence and is not subject to interference induced by pH changes in the range of pH 4.0-9.0. Therefore, the subsequent experiments will be carried out in the PBS buffer (10-2 mol/L, pH 7.4).
The fluorescence titration of Zn2+ was then examined in PBS buffer (10-2 mol/L, pH 7.4). With addition of 10-3–10-2 mol/L (0–1 equiv.) Zn2+, the fluorescence intensity at 525 nm increased gradually, and reached the maximum with the addition of 1 equiv. Zn2+ (Fig. S5A in Supporting information). Upon addition of Zn2+, the biggest intensity could reach 17 times and fluorescence quantum yield enhanced almost 10 times from 0.08 to 0.8. According to Job's plot (Fig. S6 in Supporting information), ZnDN formed the 1:1 complex with Zn2+, and the association constant of the complex was 7.04 ×10⁸ L/mol. The detection limit of ZnDN for Zn2+ was calculated to be 4.0 × 10⁻⁹ mol/L based on LOD = 3σ/s.
The selectivity and competitiveness of ZnDN toward different metal ions (Zn2+, Ca2+, K+, Mn2+, Na+, Ag+, Cr3+, Co2+, Fe3+, Pb2+, Ni2+ with perchlorate anions) were further investigated in PBS buffer (10-2 mol/L, pH 7.4). Upon addition of 3 equiv. different metal ions, negligible changes were observed in the fluorescence emission spectra (Fig. S8 in Supporting information). However, the fluorescence intensity was significantly enhanced after Zn2+ was added. Even in the presence of 3 equiv. of other metal ions, the fluorescence intensity exhibited similar enhancement when Zn2+ was added. Therefore, probe ZnDN should have the potential in imaging intracellular zinc ions.
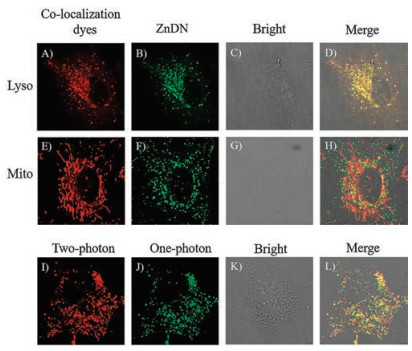
The biocompatibility and subcellular localization ability of probe ZnDN were evaluated before living cell imaging. MTT assay was used to determine the cytotoxicity of ZnDN in MCF-7 cells and A549 cells. The cells viability was above 80% with the concentration of ZnDN ranging from 0 to 2 × 10⁻⁵ mol/L after 24 h incubation (Fig. S9 in Supporting information), which indicated that ZnDN had low toxicity and could be used for imaging in living cells. Then we investigated the subcellular location of ZnDN in A549 cells with Lyso Tracker® Red DND-99 L-7528, a commercial lysosome marker. As shown in Fig. 1, the fluorescence imaging of ZnDN (Fig. 1B) was overlapped well with Lyso Tracker® Red DND-99 L-7528 (Fig. 1A), with the Pearson's correlation coefficient at 0.94 (Fig. 1D), which indicated that ZnDN was mainly localized in lysosome. Since this novel fluorescent skeleton had an application in two-photon microscope (TPM) imaging [32], we also investigated the TMP imaging ability of ZnDN. The fluorescence signal of ZnDN with one-photo excitation (Fig. 1J) showed excellent overlap with that of two-photo excitation (Fig. 1I), indicating that ZnDN could be used for TPM imaging of zinc ions in living cells.

|
Download:
|
| Fig. 1. (A–H) Co-localization images of ZnDN (5 ×10⁻⁶ mol/L) with commercial dyes (10-7 mol/L, 30 min) in living A549 cells. Red channel (λex = 561 nm, λem = 590–650 nm) for Lyso-Tracker (A) and Mito-Tracker (E). (B, F) Green channel (λex=476 nm, λem = 500–550 nm) for ZnDN. (C, G) Bright field image. (D) Overlay of (A), (B) and (C). (H) Overlay of (E), (F) and (G). (I-J) Fluorescence imaging of ZnDN (5 ×10⁻⁶ mol/L) in living A549 cells with two-photon microscopy and one-photon microscopy. (I) Red channel (λex = 900 nm, λem = 500–550 nm) was two-photon microscopy. (J) Green channel (λex = 476 nm, λem = 500–550 nm) was one-photon microscopy. (K) Bright field image. (L) Overlay of (I), (J) and (K). | |
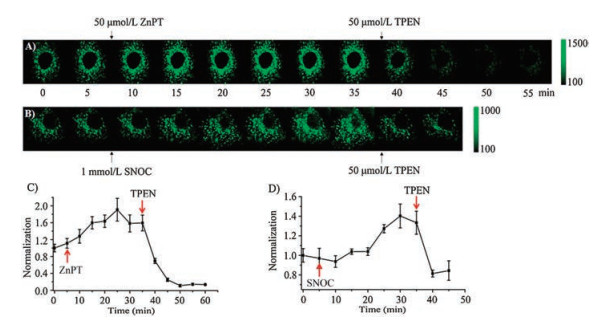
Then we explored the imaging of Zn2+ in living cells using confocal microscopy. A549 cells stained with 5 ×10⁻⁶ mol/L of ZnDN displayed weak green fluorescence because of the low level of intracellular free zinc (Fig. 2A). Upon addition of Zn2+/pyrithione (1:2) (ZnPT, 5 ×10⁻⁵ mol/L), the fluorescence intensity gradually increased and reached maximum at 25 min. After the subsequent addition of 2.5 ×10⁻⁴ mol/L of membrane-permeable Zn2+ chelator, N, N, N', N'-tetrakis(2-pyridylmethyl)ethylenediamine (TPEN), the green fluorescence signal gradually decreased, indicating that the green fluorescence is originated from the binding of ZnDN with free Zn2+. Similar results were observed in the flow cytometer experiment (Fig. S10 in Supporting information). In order to detect endogenous Zn2+, we applied SNOC, a NO donor, which could induce free Zn2+ release from MTs [33, 34], to treat the cells. Similarly, the fluorescence signal also enhanced and reached maximum at 30 min when treated with 1 mmol/L SNOC. Upon addition of 5 ×10⁻⁵ mol/L of TPEN, the fluorescence decrease was observed again (Fig. 2B), implying that the NO-induced fluorescence enhancement was attributed to the release of intracellular zinc. In the A549 cells, a 1.91-fold and a 1.40-fold enhancement in the fluorescence intensity of exogenous and endogenous Zn2+ were observed (Figs. 2C and D), respectively. These results indicated that ZnDN is a sensitive fluorescent probe for the real-time monitoring of intracellular exogenous and endogenous Zn2+.

|
Download:
|
| Fig. 2. Confocal fluorescence imaging of Zn2+ in A549 cells. (A) Real-time imaging of exogenous Zn2+, incubation of A549 cells with ZnDN (5 ×10⁻⁶ mol/L, 30 min), followed by addition ZnPT (5 ×10⁻⁵ mol/L, 35 min), then addition TPEN (5 ×10⁻⁵ mol/L, 20 min). (B) Real-time imaging of endogenous Zn2+, incubation of cells with ZnDN (5 ×10⁻⁶ mol/L, 30 min), followed by addition SNOC (10-3 mol/L, 35 min), then addition TPEN (5 ×10⁻⁵ mol/L, 10 min). Normalized of the change in fluorescence intensity of ZnDN treated with exogenous (C) and endogenous (D) Zn2+. λex = 476 nm, λem = 500–550 nm. | |
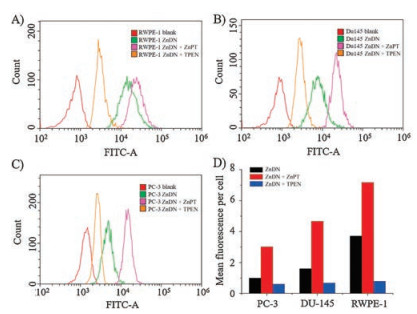
It has been reported that the prostate contains higher concentration of zinc than any other soft tissue in the body, and the content of zinc in cancerous prostate tissue will decrease sharply [35]. By using the probe ZnDN, we next assessed the zinc level in different prostate epithelial cell lines, including cancerous cells (PC-3 and DU-145) and normal cells (RWPE-1). As shown in Fig. 3, flow cytometry measurements of ZnDN confirmed the presence of free zinc in normal prostate cells (RWPE-1) and the reduced zinc in malignant cells (PC-3 and DU-145). After treated with ZnDN (5 ×10⁻⁶ mol/L) under the same conditions, the mean fluorescence intensity in PC-3 and DU-145 cells were reduced 2-fold compared with RWPE-1 cells. And the addition of 5 ×10⁻⁵ mol/L TPEN reduced the fluorescence intensity in all prostate cell lines to background levels. After addition of 5 ×10⁻⁵ mol/L of Zn/pyrithione (ZnPT), 7.2-fold and 3.0-fold/4.6-fold enhancement in the fluorescence intensity were observed in the normal prostate cells and malignant cells, respectively. These results suggested that normal prostate cells have more endogenous Zn2+ than cancerous and can accumulate more exogenous Zn2+ in normal cells.

|
Download:
|
| Fig. 3. Flow cytometry raw histogram of RWPE-1 cells (A), DU-145 cells (B) and PC- 3 cells (C) following sham treatment, incubation with ZnDN (5 ×10⁻⁶ mol/L) in the absence of zinc, incubation with ZnDN in the presence of added zinc (ZnPT, 5 ×10⁻⁵ mol/L), and incubation with ZnDN in the presence of a labile zinc chelator (TPEN, 5 ×10⁻⁵ mol/L). (D) Quantitative analysis of the results illustrated in (A), (B) and (C) to distinguish cancerous prostate cells (PC-3 cells and DU-145 cells) from normal prostate cells (RWPE-1 cells). | |
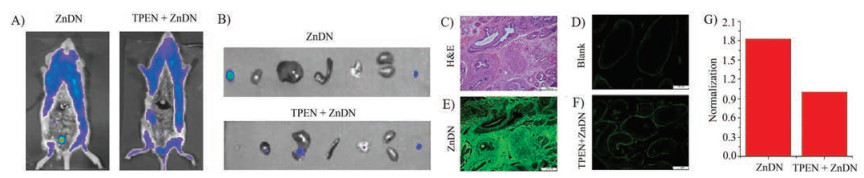
After a series of successful fluorescence imaging for zinc ions in different prostate cells, we performed in vivo imaging of Zn2+ using the LPS-induced mouse inflammation model. As shown in Figs. 4A and B, after tail intravenous injection with 200 μL of ZnDN (10-5 mol/L), a bright fluorescence signal was observed in the area of prostate. After co-injection of ZnDN and the zinc chelator TPEN, the fluorescence signal decreased remarkably, which indicated that the signal was zinc specific. Because of the very small size of mice prostate, we performed H & E-staining experiment and confirmed that excised tissue was from the prostate of mouse (Fig. 4C). Then we investigated the fluorescence microscopy of frozen prostate sections. As shown in Fig. 4D, the frozen prostate section from mouse without any treatment displayed very weak autofluorescence, and the frozen prostate section from mouse injected with ZnDN displayed a bright green fluorescence (Fig. 4E). As expected, the frozen prostate section derived from the mouse injected with ZnDN and TPEN exhibited very weak fluorescence signal (Fig. 4F), and the fluorescence intensity of the former is 1.83 times that of the latter (Fig. 4G). All these results suggest that the high sensitivity probe ZnDN has a potential to visualize the zin-crich prostate by fluorescence imaging technique.

|
Download:
|
| Fig. 4. (A) Fluorescent imaging of mice prostate after i.v. injection of ZnDN (left) and ZnDN plus TPEN chelator (right) in vivo. (B) Fluorescent optical imaging of the excised tissues of mice: prostate, heart, liver, spleen, lung, kidney, bladder. (C, D) H & E staining and fluorescence microscopy of frozen prostatic tissue sections derived from noninjected ICR mice. (E, F) Fluorescence microscopy of frozen prostatic tissue sections derived from ICR mice injected with ZnDN alone and ZnDN plus TPEN. Scale bar: 200 μm. (G) Quantitative evaluation of the fluorescence intensity of excised prostate tissues. | |
In summary, based on the novel seven-membered heterocycle fused 1, 8-naphthalimide skeleton, we have designed a highly sensitive fluorescent probe ZnDN for zinc, with a limit of detection of 4.0 × 10⁻⁹ mol/L. Living cells imaging indicated that the probe was specifically localized in lysosome and could image mobile zinc level in different kinds of cell lines. Imaging of prostate cells revealed that normal prostate cells have higher concentration of Zn2+ than cancerous ones, and could accumulate more exogenous Zn2+. Moreover, ZnDN was successfully used to image Zn2+ in the prostate tissue of mouse. So it is anticipated that ZnDN has a potential to visualize the zinc-rich prostate by fluorescence imaging technique.
Declaration of competing interestThe authors declare that they have no known competing financial interests or personal relationships that could have appeared to influence the work reported in this paper.
AcknowledgmentsWe thank the National Natural Science Foundation of China (Nos. 21878088, 81701760, 21476077), Key Project of the Shanghai Science and Technology Committee (No. 18DZ1112703), and Science and Technology Project of Jiangsu Province of China (No. BK20171086) for financial support.
Appendix A. Supplementary dataSupplementary material related to this article can be found, in the online version, at doi:https://doi.org/10.1016/j.cclet.2020.05.028.
| [1] |
Y. Chen, Y. Bai, Z. Han, W. He, Z. Guo, Chem. Soc. Rev. 44 (2015) 4517-4546. DOI:10.1039/C5CS00005J |
| [2] |
W. Maret, Y. Li, Chem. Rev. 109 (2009) 4682-4707. DOI:10.1021/cr800556u |
| [3] |
Y. Qin, P.J. Dittmer, J.G. Park, K.B. Jansen, A.E. Palmer, Proc. Natl. Acad. Sci. U. S. A. 108 (2011) 7351-7356. DOI:10.1073/pnas.1015686108 |
| [4] |
C.E. Outten, O'Halloran T.V., Science 292 (2001) 2488-2492. DOI:10.1126/science.1060331 |
| [5] |
A. Changela, K. Chen, Y. Xue, et al., Science 301 (2003) 1383-1387. DOI:10.1126/science.1085950 |
| [6] |
J. Wang, Y. Xiao, Z. Zhang, et al., J. Mater. Chem. 15 (2005) 2836-2839. DOI:10.1039/b500766f |
| [7] |
L.A. Lichten, R. Cousins, Annu. Rev. Nutr. 29 (2009) 153-176. DOI:10.1146/annurev-nutr-033009-083312 |
| [8] |
W. Maret, J. Nutr. 130 (2000) 1455-1458. DOI:10.1093/jn/130.5.1455S |
| [9] |
Bossy-Wetzel E., M.V. Talantova, W.D. Lee, M.N. Schölzke, S.A. Lipton, Neuron 41 (2004) 351-365. DOI:10.1016/S0896-6273(04)00015-7 |
| [10] |
E. Aizenman, A.K. Stout, K.A. Hartnett, et al., J. Neurochem. 75 (2000) 1878-1888. |
| [11] |
C.J. Frederickson, W. Maret, M.P. Cuajungco, Neuroscientist 10 (2004) 18-25. DOI:10.1177/1073858403255840 |
| [12] |
R.J. Cousins, J.P. Liuzzi, L.A. Lichten, J. Biol. Chem. 281 (2006) 24085-24089. DOI:10.1074/jbc.R600011200 |
| [13] |
C.J. Frederickson, J.Y. Koh, A.I. Bush, Nat. Rev. Neurosci. 6 (2005) 449-462. DOI:10.1038/nrn1671 |
| [14] |
D.A. Scott, A.M. Fisher, J. Clin. Invest. 17 (1938) 725-728. DOI:10.1172/JCI101000 |
| [15] |
A.I. Bush, W.H. Pettingell, G. Multhaup, et al., Science 265 (1994) 1464-1467. DOI:10.1126/science.8073293 |
| [16] |
M.P. Cuajungco, G.J. Lees, Neurobiol. Dis. 4 (1997) 137-169. DOI:10.1006/nbdi.1997.0163 |
| [17] |
S.K. Ghosh, P. Kim, X.A. Zhang, et al., Cancer Res. 70 (2010) 6119-6127. DOI:10.1158/0008-5472.CAN-10-1008 |
| [18] |
W. Chyan, D.Y. Zhang, S.J. Lippard, R.J. Radford, Proc. Natl. Acad. Sci. U. S. A. 111 (2014) 143-148. DOI:10.1073/pnas.1310583110 |
| [19] |
L.C. Costello, R.B. Franklin, J. Biol. Inorg. Chem. 16 (2011) 3-8. DOI:10.1007/s00775-010-0736-9 |
| [20] |
A. Banas, W.M. Kwiatek, K. Banas, et al., J. Biol. Inorg. Chem. 15 (2010) 1147-1155. DOI:10.1007/s00775-010-0675-5 |
| [21] |
C.G. Taylor, Biometals 18 (2005) 305-312. DOI:10.1007/s10534-005-3686-x |
| [22] |
X. Qian, Y. Xiao, Y. Xu, et al., Chem. Commun. 46 (2010) 6418-6436. DOI:10.1039/c0cc00686f |
| [23] |
L. Zhou, Z. Jin, X. Fan, et al., Chin. Chem. Lett. 29 (2018) 1500-1502. DOI:10.1016/j.cclet.2018.07.018 |
| [24] |
J. Zhu, X. Liu, J. Huang, L. Xu, Chin. Chem. Lett. 30 (2019) 1767-1774. DOI:10.1016/j.cclet.2019.08.027 |
| [25] |
C.B. Huang, L. Xu, J.L. Zhu, et al., J. Am. Chem. Soc. 139 (2017) 9459-9462. DOI:10.1021/jacs.7b04659 |
| [26] |
J. Zhu, P. Jia, N. Li, et al., Chin. Chem. Lett. 29 (2018) 1445-1450. DOI:10.1016/j.cclet.2018.09.002 |
| [27] |
Y. Yan, X. Zhang, X. Zhang, et al., Chin. Chem. Lett. 31 (2020) 1091-1094. DOI:10.1016/j.cclet.2019.10.025 |
| [28] |
L. Zhou, L. Xie, C. Liu, Y. Xiao, Chin. Chem. Lett. 30 (2019) 1799-1808. DOI:10.1016/j.cclet.2019.07.051 |
| [29] |
X. Guo, X. Qian, L. Jia, J. Am. Chem. Soc. 126 (2004) 2272-2273. DOI:10.1021/ja037604y |
| [30] |
L. Cui, Y. Zhong, W. Zhu, Y. Xu, X. Qian, Chem. Comm. 46 (2010) 7121-7123. DOI:10.1039/c0cc01000f |
| [31] |
H. Duan, D. Yu, C. Huang, et al., Chin. Chem. Lett. 30 (2019) 55-57. DOI:10.1016/j.cclet.2018.03.016 |
| [32] |
J. Zhang, C. Wang, L. Zhang, et al., RSC Adv. 6 (2016) 71624-71627. DOI:10.1039/C6RA13226J |
| [33] |
L. Xue, G. Li, D. Zhu, Q. Liu, H. Jiang, Inorg. Chem. 51 (2012) 10842-10849. DOI:10.1021/ic301307v |
| [34] |
E. Casero, J.A.M. Gago, F. Pariente, E. Lorenzo, Eur. Biophys. J. 33 (2004) 726-731. DOI:10.1007/s00249-004-0418-z |
| [35] |
W. Chyan, D.Y. Zhang, S.J. Lippard, R.J. Radford, Proc. Natl. Acad. Sci. U. S. A. 111 (2014) 143-148. DOI:10.1073/pnas.1310583110 |