 2020, Vol. 31


b School of Chemistry and Chemical Engineering, Anhui University of Technology, Ma'anshan 243032, China;
c Institute of Pharmaceutical Analysis, College of Pharmacy, Jinan University, Guangzhou 510632, China;
d Second Clinical Medical College (Shenzhen People's Hospital), Jinan University, Shenzhen 518020, China
Uranyl (UO22+) ions, as an important component of nuclear fuel, have attracted significant attention due to their extreme radioactive and chemical toxicity for ourselves and our environment [1, 2]. For example, the inappropriate exposure of human body to UO22+ ions can lead to serious DNA damage and health problems, such as nephrotoxicity, congenital malformations, childhood leukemia, and lung carcinoma [3-6]. Although various laboratory instruments have been used for highly sensitive and accurate UO22+ ions assays, such as atomic absorption spectrometry [7], X-ray fluorescence spectrometry [8], inductively coupled plasma mass spectroscopy [9], surface enhanced Raman spectroscopy [10], ion chromatography and cathodic stripping voltammetry [11, 12], these sensing techniques are expensive, time-consuming, require sophisticated instrument system, well-trained personnel, and complex pretreatments and/or enrichment processes. Meanwhile, possible sudden public nuclear leakage safety (such as Fukushima nuclear leak) has also raised higher requirements for UO22+ ions measurement. Consequently, from a public health perspective, it is essential to develop a reliable, sensitive yet simple, inexpensive and portable UO22+ ions detection method for improving and protecting ourselves and our living environment safe.
Owing to the outstanding advantage of could observe the color change by our naked eye to identify the target analyte, fluorescent colorimetric methods is widely used in the fields of clinical diagnosis, environmental pollution monitoring, food safety testing, and other fields [13-19]. For example, Ye et al. reported a waterstable anionic terbium(Ⅲ) metal-organic framework-based fluorescent colorimetric test paper, which serve as naked-eyes practical responsive detectors for UO22+ ions assay [15]. However, these methods can only realize semi-quantitatively detection at most, because our eyes are insensitive to distinguish the slight color change for revealing the trace amounts of analytes [20]. Therefore, to further improve the accuracy and sensitivity of color changes discrimination is the key to achieve the on-site and rapid determination of UO22+ ions concentration by fluorescent colorimetric method.
Recently, the cellphone has become more and more important as an optical sensing platform for its incomparable data computing, display, and storage capabilities [21-23]. One interesting strategy is to use the high-pixel resolution cameras integrated in the cellphone, after taking a suitability fluorescent imaging, these images can be easily converted into the related color information by the build-in application, which directly displays as RGB (red, green and blue) [24, 25], HSV (hue, saturation and value) [26] or CMYK (cyan, magenta, yellow and black) values [27] for determining the analyte concentration [28]. The major advantage of this strategy is the perfect combination the merits of fluorescent colorimetric method and cellphone-based optical platform [24]. The fluorescent colorimetric method could allow for rapid preliminary screening of UO22+ ions by our naked eye, and cellphone-based optical platform would greatly improve the accuracy of the assay. Therefore, here we propose a simple and effective ratiometric fluorescence imaging method for the visualizing and accurate detection UO22+ ions by field-portable cellophane-based optical platform.
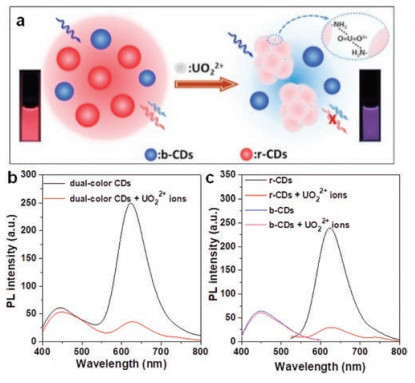
The architecture of ratiometric fluorescence sensing mechanism based of dual-color label-free carbon dots (CDs) for visually detecting UO22+ ions have briefly illustrated in Fig. 1a. The labelfree red carbon dots (r-CDs) and blue carbon dots (b-CDs) were prepared by the reported solvothermal method with a slight modification [29, 30]. The detail of synthetic experimental procedures can be found in Supporting information. The ratiometric fluorescence sensing system was obtained with simply mixing the r-CDs and b-CDs solution together. Due to the excellent water solubility and non-specific recognition group on the surface of b-CDs (Fig. S1 in Supporting information), the fluorescence of b-CDs remains unchanged, thus providing a reliable reference signal for the ratiometric detection of UO22+ ions (Figs. 1b and c). Meanwhile, the amino group of r-CDs play a crucial role in donating the reactive sites for UO22+ ions discrimination. Because of the coordination of UO22+ ions with the amino group leads to the formation of r-CDs/UO22+ complexes, which induced the remarkable quenching to the fluorescence from the r-CDs (Fig. 1c) [31-33]. The different response of dual-color CDs sensing solution induced the photoluminescence color continually changes from deep red to dark purple under a 365 nm ultraviolet (UV) lamp, which can be conveniently distinguished by our naked eyes (Fig. 1a).

|
Download:
|
| Fig. 1. (a) Schematic illustration of the ratiometric fluorescent sensing mechanism for visually detecting UO22+ ions. (b) The fluorescence spectra of dual-color CDs sensing system with absence or presence of UO22+ ions. (c) The fluorescence spectra of r-CDs and b-CDs with absence or presence of UO22+ ions. | |
The hypothesis of complexation coordination has been demonstrated by the measurements of UV–vis absorption spectra as shown in Fig. 2a. Upon the addition of UO22+ ions into r-CDs aqueous solution, the 486 nm absorbance peak gradually disappeared and a new absorbance band at 578 nm appeared and become stronger. With the increasing addition of UO22+ ions, the color of the r-CDs eventually changed from light orange to blue-violet. Similar color changes were also observed on adding UO22+ ions into the pure p-phenylenediamine (p-PDA) solution (Fig. S2 in Supporting information). On the other hands, TEM images directly showed the monodisperse r-CDs turn into the aggregate situation after the addition of UO22+ ions (Figs. 2e and f). The dynamic light scattering (DLS) measurements clearly showed that the average hydrodynamic diameter of r-CDs in the presence and absence of UO22+ ions are ~43.82 nm and ~531.2 nm, respectively (Fig. S3 in Supporting information). It is a little surprising that the particle sizes of r-CDs and the aggregated r-CDs are much larger than those measured by TEM, however these results are in accordance with a previous report which revealed the excellent hydrophilicity of r-CDs [33]. All results illustrate that the UO22+ ions cause the aggregation of rCDs, and then the aggregation determines the fluorescence quenching of r-CDs solution from another point of view. In contrast, the UV–vis spectrum and TEM images of b-CDs have litter change even after the addition of UO22+ ions (Figs. 2b-d). Therefore, the ratiometric fluorescence spectra and color evaluation can be attributed to the aggregate-caused fluorescence quenching effect (ACQ) due to the coordinated interaction of the amino ligand of p-PDA on the surface of r-CDs to UO22+ ions.

|
Download:
|
| Fig. 2. Evolutions of UV-vis spectra of r-CDs (a) and b-CDs (b) after the addition of UO22+ ions. The inset photos show the corresponding colors under daylight. TEM images of b-CDs (c, d) and r-CDs (e, f) before and after the addition of 250.0 μmol/L UO22+ ions. | |
To optimize the analytical performance of the ratiometric fluorescence sensing system, effect of pH was careful studied (Figs. S4 and S5 in Supporting information). As showed in Fig. S4, the photoluminescence intensities ratios of the ratiometric fluorescence sensing system keep stable in pH range from 6.00 to 9.50. When the pH is less than 6.00 or higer than 9.50, the fluorescence of b-CDs and r-CDs decreased obviously, which can be attributable to the result of protonation or deprotonation of —COOH, —OH, -NH2 and -NHR groups on the surface of carbon dots. Meanwhile, the uranium can exist in various chemical forms which depending on the pH values of the medium [16]. Uranium primarily exists as UO22+ ions at pH 4.00. At higher pH, the detection of UO22+ ions were not possible to achieve due to the uranium mainly exists in the insoluble form of UO2(OH)2 and UO2(OH)3-, which do no coordinated with the amine groups to quench the fluorescence of r-CDs (Fig. S5). Therefore, in this ratiometric fluorescence sensing system, the UO22+ ions detection should be conducted using the medium at pH 7.00 and UO22+ ions at pH 4.00.
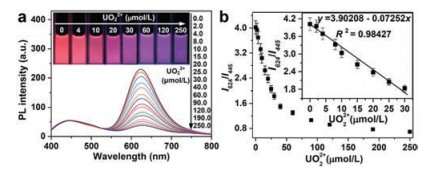
In order to obtain of the widely fluorescence color changes for visually detecting UO22+ ions, the response of different fluorescence intensity ratios of r-CDs and b-CDs to UO22+ ions were tested and the related color changes was recorded in Figs. S6 and S7 (Supporting information). When the fluorescence intensity ratios of r-CDs and b-CDs (I624/I445) was adjusted to 4/1, an extremely noticeable fluorescence color change from deep red to dark purple was obtained. In Fig. 3, the fluorescence intensity ratios (I624/I445) were continuously decreased with the amount of UO22+ ions increasing. Even if the amount of UO22+ ions was as low as 2.00 μmol/L, the value of I624/I445 was still decreased ~3.45% by compared with the absence of UO22+ ions. With the further increasing UO22+ ions concentration to 30.0 μmol/L, the value of I624/I445 was decreased by ~55.21%. In the range from 0 μmol/L to 30.0 μmol/L, there was a good linear relationship with a correlation coefficient of 0.98427. The limit of detection (LOD) was estimated to be 0.73 μmol/L based on the definition of three times to the standard deviation of the blank signal. Upon the addition of 250.0 μmol/L UO22+ ions, the fluorescence intensity ratio was decreased by ~82.62% and reached the maximum in 5 min (Fig. S8 in Supporting information), indicating that the interaction between UO22+ ions and r-CDs rapidly achieved an equilibrium. Meanwhile, a series of noticeable color changes from deep red to red, deep magenta, dark magenta, deep purple, and dark purple were observed under a UV lamp, which is more sensitive and reliable than the single-fluorescence r-CDs quenching method (Fig. S6). These fluorescence color change have been confirmed by Commission Internationale de L'Eclairage (CIE) coordinates (Fig. S9 in Supporting information). The ratiometric fluorescence sensing system without UO22+ ions had dark red emission with CIE coordinates of (0.4978, 0.3212). As the UO22+ ions concentrations increased, a substantial blue-shift tendency in the CIE coordinate was observed from red (0.4665, 0.3064; 10.0 μmol/L) to deep magenta (0.4384, 0.2940; 20.0 μmol/L), dark magenta (0.4066, 0.2814; 30.0 μmol/L, deep purple (0.360, 0.2649; 60.0 μmol/L), and dark purple (0.2875, 0.2427; 250.0 μmol/L). These results indicated that the reliable of color variations in our ratiometric fluorescence sensing system from another aspect.

|
Download:
|
| Fig. 3. (a) Fluorescence spectra of the ratiometric fluorescent sensing system with the increasing of the concentrations of UO22+ ions. The inset photos show the corresponding fluorescence color changes under 365 nm UV illumination. (b) The simulated correlation between the fluorescence intensity ratio I624/I445 and UO22+ ions concentration. The inset is the linear relationship of I624/I445 versus UO22+ ions in the range from 0 μmol/L to 30.0 μmol/L. | |
To further evaluate the reliable of the ratiometric fluorescence sensing system, a series of selectivity and anti-interference experiments were conducted on the effect of different ions to the fluorescence intensity under the same condition. As shown in gray bars in Fig. S10 (Supporting information), no significantly change in the ratio (< 5.50%) was detected with the addition of 1.0 mmol/L Na+, Zn2+, Pb2+, Ba2+, Cu2+, Mg2+, Ni2+, Cl-, CO32–, HCO3–, NO3- and SO42– into the system. The fluorescence response was not influenced even if 4-fold excesses of the interfering ions coexisted (blank bars in Fig. S10). It should be noted that the addition of Fe3+ and Al3+ also causes serious quenching to the ratiometric fluorescence sensing system (~80%), and thus bring interferences for detecting UO22+ ions in real water samples. However, Fe3+ and Al3+ influence can be easily eliminated by a simple pretreatment with sodium citrate for the formation of 1 + 1 complex. After the simple pretreatment, the fluorescence responses of the sensing system to the UO22+ ions were nearly the same. These data indicated that the ratiometric fluorescence sensing system had an excellent selectivity and anti-interference ability for UO22+ ions detection.
The above series of color changes also provided a possible way for the field-portable determination of UO22+ ions by a cellphonebased optical platform device as the fluorescent signal reader (Figs. 4a and b). The more detail of the internal structure of the cellphone-based optical platform was shown in Fig. S11 (Supporting information). After warming for ~2 min, the ultraviolet light from the 365 nm LED excited the sample solution in the quart cuvette to produced fluorescence. After a suitability fluorescent imaging, the built-in Colorpicker APP could directly analysis these digital images (Fig. 4c) and quickly output the Red, Green and Blue (RGB) channel values of these images within one second (Fig. S12 in Supporting information). Fig. 4d shows the ratio of red channel to blue channel is closely related to UO22+ ions concentration from 0 μmol/L to 250.0 μmol/L. A correlation can be established between the R/B and UO22+ ions concentration from 0 μmol/L to 30 μmol/L, and the coefficient is calculated to be 0.92804 with LOD of 8.15 μmol/L based on three times deviation (3δ/slope). This method displayed a broader linear range and its response time is comparable to or even much lower than the most of the existed fluorescence methods listed in Table S1 (Supporting information). Though its LOD performance was not as excellent as the semiconductor-type quantum dots sensing system, our method provided a wider range of fluorescent color variations and avoided the use of highly toxic semiconductor-type quantum dots. Moreover, the low-cost, portable, easy-operation advantage of our constructed cellphone-based optical sensing platform is more attractive than previously reported nanosensors without the need of elaborate equipment.

|
Download:
|
| Fig. 4. (a) The structure and the light path diagram of the cellphone-based optical platform device. (b) The picture of the assembled cellphone-based optical sensing platform device. (c) The luminescent images of the sensing system upon additions of different amounts of UO22+ ions, which were directly taken by the cellphone digital camera. (d) The simulated correlation between the ratio of R/B values versus UO22+ ions concentration. The inset is the linear relationship of R/B versus UO22+ ions in the range from 0 μmol/L to 30.0 μmol/L. | |
To further assess its adaptability of field-portable cellphonebased optical platform in real water sample, the concentration of UO22+ ions was detected by spiking a known concentration of UO22+ ions to tap water and river water. The river water samples were first filtered to remove any particulate suspension. Tap water sample were directly applied without any pretreatment. The estimated recoveries of the measurements and the relative standard deviation (RSD) are shown in Table S2 (Supporting information). At low concentration, the recoveries and RSD for river water are much higher than tap water. This positive interferences for detecting UO22+ ions could be attributable to the complicated interfering cations in real river water, such as Fe3+ and Al3+ ions. Reversely, the recoveries and the RSD exhibit satisfactory results at high concentration. Therefore, cellphone-based sensing system has been demonstrated to perform well in relatively clean water for the field-potable detection of UO22+ ions.
In this paper, a simple and effective ratiometric fluorescence imaging method was developed for the visualizing and quantitative detection UO22+ ions by cellophane-based optical platform. The ratiometric fluorescence sensing system showed an obvious color change from dark red to dark purple with the concentration of UO22+ ions gradually increased to 250.0 μmol/L, which could be directly observed by our naked eyes. Most interestingly, the color change of the sensing system can be digital identified by our cellphone-based optical platform for the accurate and quantitative detection of UO22+ ions within ~5 min. The detection limit was found to be as low as 8.15 μmol/L in aqueous solution. All these distinguished properties greatly improve the accessibility of UO22+ ions detection even in resource-limited areas.
Declaration of competing interestThe authors declare that they have no known competing financial interests or personal relationships that could have appeared to influence the work reported in this paper.
AcknowledgmentsThis work is supported by the National Natural Science Foundation of China (Nos. 21976002, 21675158, 21507134, 61603001, 61705239 and 81773684), Natural Science Foundation of Anhui Province (Nos.1908085MB41, 1908085QB75), Guangdong Natural Science Funds for Distinguished Young Scholars (No. 2018B030306033), Pearl River S&T Nova Program of Guangzhou (No. 201806010060) and Pearl River Talent Program (No. 2017GC010363).
Appendix A. Supplementary dataSupplementary material related to this article can be found, in the online version, at doi:https://doi.org/10.1016/j.cclet.2020.05.004.
| [1] |
G. Bjørklund, O. Christophersen, S. Chirumbolo, O. Selinus, J. Aaseth, Environ. Res. 126 (2017) 526-533. |
| [2] |
D. Brugge, de Lemos J.L., B. Oldmixon, Rev. Environ. Health 20 (2005) 177-193. |
| [3] |
X.M. Wu, Q.X. Huang, M. Yu, et al., Trac-trend Anal. Chem. 118 (2019) 89-111. DOI:10.1016/j.trac.2019.04.026 |
| [4] |
E.S. Craft, Abu-Qare A.W., M.M. Flaherty, et al., J. Toxicol. Environ. Health B:Crit. Rev. 7 (2004) 297-317. DOI:10.1080/10937400490452714 |
| [5] |
A. Bleise, P.R. Danesi, W. Burkart, J. Environ. Radioactiv. 64 (2003) 93-112. DOI:10.1016/S0265-931X(02)00041-3 |
| [6] |
C. Vidaud, Gourion-Arsiquaud S., Rollin-Genetet F., et al., Biochemistry 46 (2007) 2215-2226. DOI:10.1021/bi061945h |
| [7] |
S.A. Abbasi, Int. J. Environ. Anal. Chem. 36 (1989) 163-172. DOI:10.1080/03067318908026869 |
| [8] |
S. Dhara, N.L. Misra, S.K. Aggarwal, Spectrochim. Acta B 63 (2008) 1395-1398. DOI:10.1016/j.sab.2008.10.033 |
| [9] |
A. Lorber, Z. Karpas, L. Halicz, Anal. Chim. Acta 334 (1996) 295-301. DOI:10.1016/S0003-2670(96)00278-4 |
| [10] |
O. Averseng, A. Hagège, T. Frédéric, C. Vidaud, Anal. Chem. 82 (2010) 9797-9802. DOI:10.1021/ac102578y |
| [11] |
L. Yang, D.W. Fan, Y. Zhang, et al., Anal. Chem. 91 (2019) 7145-7152. DOI:10.1021/acs.analchem.9b00325 |
| [12] |
J.C. Veselsky, C.A. Degueldre, Analyst 111 (1986) 535-538. DOI:10.1039/an9861100535 |
| [13] |
P.W. Wu, K. Hwang, T. Lan, Y. Lu, J. Am. Chem. Soc. 135 (2013) 5254-5257. DOI:10.1021/ja400150v |
| [14] |
P.J. Zhu, Y.Y. Zhang, S.X. Xu, X.F. Zhang, Chin. Chem. Lett. 30 (2019) 58-62. DOI:10.1016/j.cclet.2018.02.003 |
| [15] |
J.W. Ye, R.F. Bogale, Y.W. Shi, et al., Chem. Eur. J. 23 (2017) 7657-7662. DOI:10.1002/chem.201700713 |
| [16] |
R.K. Dutta, A. Kumar, Anal. Chem. 88 (2016) 9071-9078. DOI:10.1021/acs.analchem.6b01943 |
| [17] |
W.Y. Lv, M. Lin, R.S. Li, et al., Chin. Chem. Lett. 30 (2019) 1410-1414. DOI:10.1016/j.cclet.2019.04.011 |
| [18] |
R.H. Zhou, X.M. Lu, Q. Yang, P. Wu, Chin. Chem. Lett. 30 (2019) 1843-1848. DOI:10.1016/j.cclet.2019.07.062 |
| [19] |
X.M. Lu, J.Y. Zhang, Y.N. Xie, et al., Anal. Chem. 90 (2018) 2939-2945. DOI:10.1021/acs.analchem.7b05365 |
| [20] |
H.Q. Wang, L. Yang, S.Y. Chu, et al., Anal. Chem. 91 (2019) 9292-9798. DOI:10.1021/acs.analchem.9b02297 |
| [21] |
K. Yang, J.D. Wu, S. Santos, et al., Biosens. Bioelectron. 124 (2019) 150-160. |
| [22] |
Y.J. Wang, M.M.A. Zeinhom, M.M. Yang, et al., Anal. Chem. 89 (2017) 9339-9346. DOI:10.1021/acs.analchem.7b02139 |
| [23] |
Y.M. Park, Y.D. Han, H.J. Chun, H.C. Yoon, Biosens. Bioelectron. 93 (2017) 205-211. DOI:10.1016/j.bios.2016.09.007 |
| [24] |
J. Zhang, J.J. Qian, Q.S. Mei, et al., Biosens. Bioelectron. 128 (2019) 61-67. DOI:10.1016/j.bios.2018.12.044 |
| [25] |
X.F. Chen, Q.S. Mei, L. Yu, et al., ACS Appl. Mater. Inter. 10 (2018) 42225-42232. DOI:10.1021/acsami.8b13765 |
| [26] |
Lopez-Ruiz N., C.F. Curto, M.M. Erenas, Benito-Lopez F., D. Diamond, A.J. Palma, Capital-vallvey L.F., Anal. Chem. 86 (2014) 9554-9562. DOI:10.1021/ac5019205 |
| [27] |
C.K. Kuşçuoglu, H. Güner, M.A. Söylemez, O. Güven, M. Barsbay, Sens. Actuators B-Chem. 296 (2019) 126653-126664. DOI:10.1016/j.snb.2019.126653 |
| [28] |
M. Xu, W. Huang, D.K. Lu, C.Y. Huang, J.J. Deng, T.S. Zhou, Anal. Methods 11 (2019) 4267-42673. DOI:10.1039/C9AY01235D |
| [29] |
K. Jiang, S. Sun, L. Zhang, et al., Angew. Chem. Int. Ed. 54 (2015) 5360-5363. DOI:10.1002/anie.201501193 |
| [30] |
S. Sun, L. Zhang, K. Jiang, G. Wu, H.W. Lin, Chem. Mater. 28 (2016) 8659-8668. DOI:10.1021/acs.chemmater.6b03695 |
| [31] |
P. Arnold, A.J. Blake, C. Wlson, J.B. Love, Inorg. Chem. 43 (2004) 8206-8208. DOI:10.1021/ic0487070 |
| [32] |
Z. Zhang, D. Zhang, C. Shi, et al., Environ. Sci.-Nano 6 (2019) 1457-1465. DOI:10.1039/C9EN00148D |
| [33] |
C. Liu, D. Ning, C. Zhang, et al., ACS Appl. Mater. Inter. 9 (2017) 18897-18903. DOI:10.1021/acsami.7b05827 |