 2020, Vol. 31


b Shaanxi Institute of Flexible Electronics (SIFE), Northwestern Polytechnical University (NPU), Xi'an 710072, China;
c Hunan Provincial Key Laboratory of Controllable Preparation and Functional Application of Fine Polymers, Hunan University of Science and Technology, Xiangtan 411201, China
Mitochondria, known as one of the most important organelles, can provide energy for cell life activities and involve a variety of cellular metabolic processes, such as central metabolism, ATP production and apoptosis [1, 2]. The stability and quality of mitochondria is critical for the normal functions of live cells at the subcellular organelle level [3, 4]. As a key microenvironmental parameter, mitochondrial viscosity can govern the status and function of the organelle and is closely associated with mitochondria state [5-7]. The abnormal viscosity in mitochondria can lead to mitochondrial damage and a series of cells dysfunction [8, 9]. Normally, as mitochondrial damage occurs, an autophagy program named as mitophagy is activated to optimize mitochondrial number and reproduce cellular energy requirements via cleaning up the superfluous or dysfunctional mitochondria. During mitophagy process, mitochondria is firstly sequestered into double-membrane autophagosome vesicles and then fused with lysosomes to form autolysosomes, thus resulting in the removal of malfunctioning mitochondria in a lysosome-dependent manner [10-12]. The disorder of mitophagy is closely related to mitochondrial dysfunction and various diseases, such as diabetes, cardiovascular diseases, Parkinson's disease, and Alzheimer's disease [13]. Thus, real-time monitoring the dynamic process of mitophagy resulted from the changes of mitochondrial viscosity and the subsequent degradation of mitochondria in living cells could provide an effective way to in-depth understand mitochondrial metabolism.
Due to possessing high sensitivity, visualization, non-invasion, as well as high spatial and temporal resolution, many well-known fluorescent probes based on the rotation restriction of the molecular rotor have been designed for detecting mitochondrial viscosity [14-29]. However, the directly monitoring mitophagyspecific dynamic with viscosity-induced degradation of mitochondria in live cells is rarely reported. Recently, Zou et al. have successfully designed a fluorescent viscosimeter based on the molecular rotor rotation for imaging viscosity variation during mitophagy [14]. We hypothesized that other mechanism such as intramolecular plane vibration should be more sensitive to mitochondrial viscosity changes.
As one of the fluorescence mechanisms newly discovered by Tian's group, vibration-induced emission (VIE) is found in intramolecular configuration that can be altered through a bentto-planar motion [30, 31]. The fluorophores with VIE intrinsically emit weak orange-red fluorescence in free state, while abnormally display strong blue fluorescence in constrained state owing to the limitation of intramolecular vibrations [31]. Obviously, the VIE fluorophores exhibit more responsive sensitivity to the changes in a microenvironment than conventional dyes. Furthermore, some other intrinsically features [32, 33], such as intramolecular planarity-induced fluorescence change, large Stokes shift, and instantaneously fluorescence response within femtosecond scale that could capture the dynamic process, enable this specific mechanism is quite suitable for real-time monitoring the changed stimuli, such as biomarker detection [34, 35], environmental response sensors [36], low-molecular-weight gelator [37], hole transport materials [38] and mechanosensitive membrane probes [39].
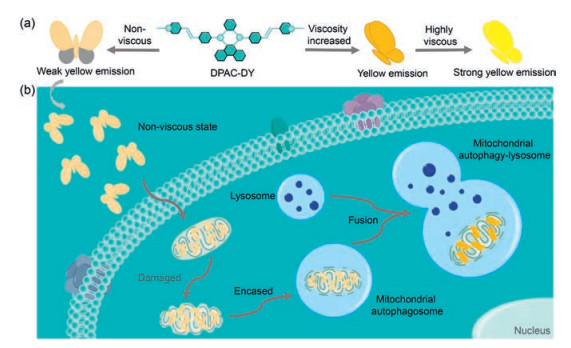
Herein, we developed a novel fluorescent probe DPAC-DY based on VIE mechanism that can be used to monitor the dynamic changes of mitochondrial viscosity during mitochondrial autophagy. In this study, we used N, N'-diphenyl-dihydrodibenzo[a, c] phenazine (DPAC) as the VIE scaffold and modified the pyridinium cations at both sides of DPAC for mitochondria target. Owing to the excellent membrane permeability and the ability of targeting mitochondria in a short time, pyridine cations have been widely used in the function of fluorescent probes [40, 41]. In addition, this portion could also enhance the water solubility of the probe DPAC-DY. As shown in Scheme 1a, the spatial configuration of the core portion DPAC is adjusted by the viscosity changes in the external environment. In non-viscous environments, DPAC-DY is free to vibrate like a flying butterfly and shows weak yellow fluorescence. While in high viscosity environment, the vibration of DPAC-DY is suppressed, and subsequently leading to strong yellow fluorescence emission. As expected in Scheme 1b, this probe could specifically locate in mitochondria and display high sensitivity for monitoring the changes of mitochondrial viscosity in living cells. Importantly, by the continuous fluorescence changes of DPAC-DY, we could directly observe the fusion of impaired mitochondria with lysosomes to form autolysomes during mitophagy process. Therefore, we herein, for the first time, exploited a promising strategy based on VIE for in situ and real-time monitoring the mitochondrial lesion process.

|
Download:
|
| Scheme 1. (a) The fluorescence changes of DPAC-DY response to viscosity by suppressing vibration. (b) Schematic diagram of DPAC-DY for monitoring viscosity change during mitochondrial autophagy. | |
The probe DPAC-DY is composed of the DPAC (VIE core) and 1-methyl-4-vinylpyridium cations (mitochondria target). As shown in Scheme 1a, the pyridinium moieties were coupled to both sides of DPAC core according to our previously work [42]. In this rational design, the probe DPAC-DY could enter into the mitochondria rapidly with the assistance of pyridinium moieties. In non-viscous mitochondrial microenvironment, the free intramolecular vibrations enabled the hydrophenazine unit in stable planar state, and thus displaying the weak fluorescence emission. However, with the mitochondrial viscosity increasing, the restriction of the intramolecular vibrations occurred owing to the steric hindrance along the N, N'-disubstituent units. Therefore, the fluorescence emission was significantly enhanced in proportion to the mitochondrial viscosity. The synthetic route of DPAC-DY was shown in Scheme S1 (Supporting information) and its structure was fully characterized by NMR and mass spectrum (Figs. S1-S3 in Supporting information).
We firstly evaluated the response of DPAC-DY to viscosity changes via determining the absorption/emission spectra in PBS buffer with different volume ratios of glycerol. As shown in Fig. 1a, the maximum absorption peak appears around 420 nm, which is virtually insensitive to viscosity changes. Meanwhile, the fluorescence intensity at 564 nm increases gradually as the viscosity increases under the excitation at 420 nm (Fig. 1b). In the ForsterHoffmann plot, a good linear relationship is achieved between the logarithm of the fluorescence intensity at 564 nm and the viscosity values (1.01–89.02 cP, R2 = 0.97691; 89.02–945.00 cP, R2 = 0.99909) (Fig. 1c) [43, 44]. Under the UV irradiation, the brightness of the yellow fluorescence visible to the naked eye is gradually enhanced (Fig. 1d), which indicates that DPAC-DY can realize the visual detection of viscosity through fluorescence changes. In addition, the limit of detection (LOD) of DPAC-DY was calculated to be 0.2133 cP based on the calibration curve of the viscosity from 1.01 cP to 89.02 cP (Fig. S4 and Table S1 in Supporting information), indicating highly sensitive response to viscosity changes was achieved with the VIE-based probe.

|
Download:
|
| Fig. 1. (a) The absorption spectra of DPAC-DY (10 μmol/L) in PBS/glycerol mixtures with different fractions of glycerol. (b) The fluorescence spectra of DPAC-DY (10 μmol/L) in PBS/glycerol mixtures with different fractions of glycerol. (c) Forster-Hoffmann plot of the DPAC-DY in different viscosity values. (d) The corresponding fluorescence photographs of DPAC-DY (20 μmol/L) in PBS/glycerol mixtures with different fractions of glycerol (viscosity values: 1.01-945.00 cP, from left to right) under 365 nm UV light illumination. | |
Fluorescence lifetime is another key parameter to assess the detection performance of the probe in real samples. We next measured the fluorescence lifetime changes at different viscosities. Similarly, the fluorescence lifetime of DPAC-DY exhibits a prolonged tendency from 0.69 ns to 1.06 ns with the viscosity increasing (Fig. S5 in Supporting information).
To further illustrate that the change in fluorescence intensity is indeed caused by viscosity, not aggregation effects, we next determined the absorption spectra of different concentrations of DPAC-DY in glycerol (Fig. S6 in Supporting information). A good linear relationship between the absorption intensity and the concentration of DPAC-DY was achieved (R2 = 0.99931), which is consistent with Lambert-Beer law. The above result indicates that the probe molecule is highly homodisperse at a sufficiently high viscosity, thus eliminating the aggregation effect on the fluorescence change.
In addition, we furtherexplored fluorescence profilesofDPAC-DY by changing the viscosity of the solvent with different temperature. Obviously, the viscosity of glycerol gradually decreases with increasing the temperature, thus revealing a gradual decrease in fluorescence intensity as expected (Fig. S7 in Supporting information). The potential influencing factors in complex cellular environments such as pH and biological interference species (including ions and amino acids) were also investigated by determining the fluorescence changes in different pH buffer solution (Fig. S8 in Supporting information) and co-exist of 48 biologically relevant substances (Fig. S9 in Supporting information), respectively. Both of the effects on the characteristic of DPAC-DY are negligible, further confirming the feasibility and specificity of the probe DPAC-DY response to viscosity alteration in complex physiological environments. The photophysical properties of DPAC-DY in solvents with different polarities were also studied. In comparison to the strong fluorescence emission in 99% glycerol, the probe DPAC-DY has almost no fluorescence in other good solvents, indicating the probe is inert to solvent polarities (Fig. S10 in Supporting information).
Next, confocal laser scanning microscopy (CLSM) was performed on DPAC-DY for monitoring the viscosity changes during the mitophagy process in living cells. The cytotoxicity of DPAC-DY on HeLa and HepG2 cells was firstly evaluated by standard MTT assay (Figs. S11 and S12 in Supporting information). After 24 hincubation with DPAC-DY at the concentration of up to 30 μmol/L, the cells still survived more than 85%, suggesting the probe DPAC-DY has low cytotoxicity and good biocompatibility.
Subsequently, we investigated subcellular distribution of the probe DPAC-DY in living cells with CLSM. As shown in Fig. 2, the quantitative co-localization analysis of the internalized DPAC-DY with both MitoTracker (a mitochondria stain) and LysoTracker (a lysosome stain) clearly shows the superiority of DPAC-DY targeting mitochondria in HeLa cells. In addition, similar intracellular distribution is also observed in HepG2 cells (Fig. S13 in Supporting information). The results showed that DPAC-DY could specifically enter mitochondria in different living cells.

|
Download:
|
| Fig. 2. Co-localization experimental images of HeLa cells incubated with DPAC-DY (5 μmol/L) for 2 h and then stained with (a) MitoTracker and (b) LysoTracker. (c) Fluorescence intensity correlation plots for DPAC-DY channel and MitoTracker channel in (a) along the white line in merged images. (d) Fluorescence intensity correlation plots for DPAC-DY channel and LysoTracker channel in (b) along the white line in merged images. Scale bar = 20 μm | |
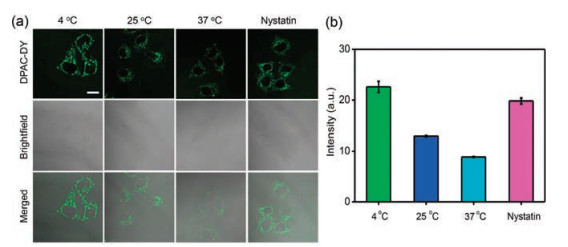
To further elucidate the ability of DPAC-DY to detect mitochondrial viscosity, we regulated intracellular mitochondrial viscosity by adjusting the ambient temperature [45, 46]. HeLa cells were incubated with DPAC-DY for 2 h at 37 ℃ and then further incubated for 30 min at different temperatures (37 ℃, 25 ℃ and 4 ℃) before imaging. As shown in Fig. 3, the fluorescence of DPAC-DY decreases gradually with the incubation temperature increasing. In addition, we pretreated the cells with nystatin, which acts as an ionophore to induce mitochondrial viscosity enhanced by blocking ionic balance [15, 28, 47], and then incubated with the probe DPAC-DY. As expected, the fluorescence intensity in the nystatin-treated cells is obviously enhanced in comparison with the control (cells incubated with DPAC-DY only at 37 ℃). These above results indicate that DPAC-DY could monitor the changes of mitochondrial viscosity under different conditions. Interestingly, the cells pretreated with nystatin for different periods of time (0 h, 2 h and 4 h) show time-dependent fluorescence enhancement in the probe DPAC-DY channel (Fig. S14 in Supporting information). The same result is observed in HepG2 cells (Fig. S15 in Supporting information), which further demonstrates that DPAC-DY has excellent sensitivity in detecting mitochondrial viscosity changes.

|
Download:
|
| Fig. 3. (a) Confocal images of HeLa cells incubated with DPAC-DY (5 μmol/L) for 2 h at 37 ℃ and then further incubated for 30 min at different temperatures or nystatin before imaging. (b) The intensity of (a) images in HeLa cells. Scale bar = 20 μm | |
Having successfully demonstrated the good performance for detecting viscosity changes in vitro and in cells, we next used the probe DPAC-DY to visibly monitor the autophagy process. During mitochondrial autophagy, viscosity increases with the formation of mitochondrial autophagosomes and their fusion with lysosomes [14]. In this study, we used carbonyl cyanide 3-chlorophenylhydrazone (CCCP) as inductive agent to adjust the mitochondrial viscosity in cells. CCCP is a membrane-potential uncoupler, which could disrupt mitochondrial membrane potential to change the viscosity and subsequently resulting in mitochondrial autophagy [48]. The change of mitochondrial membrane potential was detected by a commercial kit (JC-1) after incubating HeLa cells with CCCP for 30 min in serum-free medium (Fig. S16 in Supporting information), which is necessary for the next occurrence of mitochondrial autophagy. To further verify the establishment of the mitochondrial autophagy model, we next monitored the aggregation of GFP-labeled Parkin (Parkin-GFP) in HeLa cells that contained overexpressed Parkin-GFP (Fig. S17 in Supporting information). After mitochondria are damaged, its membrane potentials are depolarized, and Parkin in the cytoplasm is activated by PINK1 and next recruited to mitochondrial autophagosomes. Thus, the aggregation of Parkin-GFP can be observed during the fusion between mitochondrial autophagosomes and lysosomes [49, 50]. As shown in Fig. S17, Parkin starts to aggregate as CCCP coincubates with cells for 2 h. With the time prolonging, significant aggregation of Parkin is observed due to the formation of mitochondrial autophagosomes. Meanwhile, the localization of LysoTracker dynamically changes and gradually gathers around the mitochondrial autophagosome in the enlarged merged Fig. S18 (Supporting information), further indicating the gradual fusion process of mitochondrial autophagosome and lysosome. Clearly, the mitochondrial autophagy in live cells was successfully induced by CCCP in serum-free medium.
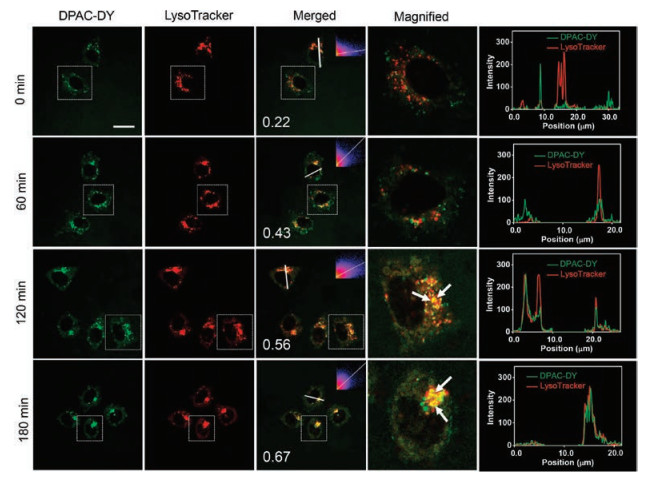
To monitor the process of mitochondrial autophagy, HeLa cells were firstly incubated with DPAC-DY for 2 h and then further incubated with CCCP for another 0.5-3 h in serum-free medium. As shown in Fig. 4, the green fluorescence signal from DPAC-DY channel gradually enhances with the extension of CCCP incubation time, indicating the viscosity is increased with the formation of mitochondrial autophagosomes during mitochondrial autophagy. Importantly, the green fluorescence is gradually aggregated and overlapped with the red fluorescent signal of the lysosomal tracer. After colocalization analysis, the Pearson's R value increases from 0.22 (without CCCP) to 0.67 (180 min after CCCP addition), further suggesting the fluorescence distribution of DPAC-DYand lysosomal tracer tends to be consistent (Fig. 4, right column). The above results indicate that the viscosity increases from mitochondria to mitochondrial autophagosomes, finally to the fusion with lysosomes during mitochondrial autophagy.

|
Download:
|
| Fig. 4. Co-localization experimental images of DPAC-DY (5 μmol/L) and LysoTracker (2 μmol/L) in HeLa cells with CCCP (10 μmol/L) treatment for different time. HeLa cells were incubated with DPAC-DY for 2 h at 37 ℃, 5% CO2, and then incubated with LysoTracker for 30 min before using CCCP (10 μmol/L) in live cell workstations. Right column: fluorescence intensity correlation plots for DPAC-DY channels and LysoTracker channels along the white line in merged images. The white arrow indicates the overlaps. Scale bar =20 μm | |
To further validate this process, we performed an autophagy inhibition assay on HeLa cells using the mitochondrial autophagy inhibitor chloroquine (CQ). Previous studies showed that CQ prevents the fusion of autophagosomes and lysosomes [51]. Herein, we firstly pretreated HeLa cells with CQ for 4 h, and then maintained in serum-free medium with DPAC-DY and CCCP incubation under CQ conditions. As shown in Fig. S19 (Supporting information), CQ displays a significant inhibitory effect on mitochondrial autophagy. The intensity and distribution of green fluorescence signal from DPAC-DY channel change slightly. Furthermore, the Pearson's R value is kept below 0.5 between the fluorescence distribution of DPAC-DY and lysosomal tracer even for 3 h-CCCP induction, which is below the threshold of >0.5 required for correlation [52, 53]. Meanwhile, by comparing the fluorescence intensity and co-localization Pearson coefficient with/without CQ treatment, it can be clearly seen that CQ could inhibit the fusion of mitochondrial autophagosomes and lysosomes during mitochondrial autophagy (Fig. S20 in Supporting information). The above results further demonstrate that our probe could visibly detect mitochondrial autophagy by monitoring the viscosity changes.
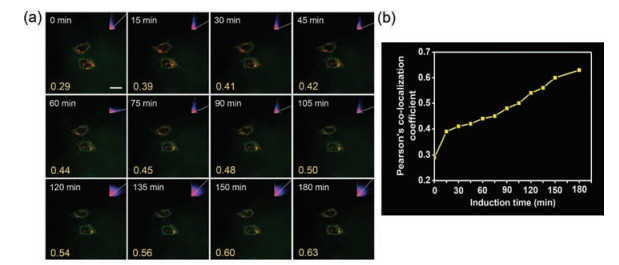
For further in-depth visualization of the dynamics of mitochondrial autophagy, we performed the real-time and in situ imaging experiments with CLSM to assess subcellular distribution of DPAC-DY under the CCCP induction in serum-free medium. As the prolonging of incubation time, the green fluorescence of the probe DPAC-DY gradually overlapped with the lysosomal tracer (red channel) (Fig. 5a), which is also confirmed by increased colocalization coefficient (Fig. 5b). In addition, the aggregated signal of DPAC-DY enhanced with incubation time increasing (Fig. S21 in Supporting information). Thus, the probe DPAC-DY could serve as an excellent platform for real-time and in situ monitor the dynamic change of viscosity during mitochondrial autophagy.

|
Download:
|
| Fig. 5. (a) Co-localization experimental images of HeLa cells incubated with DPAC-DY (5 μmol/L) and LysoTracker (2 μmol/L) for real-time monitoring of viscosity changes during mitochondrial autophagy. (b) Trends in Pearson's co-localization coefficient in (a) images. Scale bar = 20 μm | |
In summary, we have developed a novel VIE-based environment-responsive fluorescent probe DPAC-DY that can be used to directly monitor the dynamics of mitochondrial viscosity in living cells. The probe was designed with the pyridinium salt at both ends of DPAC, which enables it possess good solubility in water and specifically anchor in mitochondria. The excellent sensitivity of DPAC-DY response to mitochondrial viscosity in cells also allows for further in-depth monitoring viscosity changes during mitochondrial autophagy. By induction of CCCP in serum-free medium, the probe reveals viscosity increases from mitochondria to mitochondrial autophagosomes, and in following fusion with lysosomes after mitochondria damage. This work provides an effective way for VIE-based fluorescent probes to target mitochondria and detect changes in mitochondrial viscosity.
Declaration of competing interestAll the contributing authors have reviewed this paper and approved the submission. The authors declare no competing financial interest.
AcknowledgmentsThis work was financially supported by the National Natural Science Foundation of China (Nos. 81672508 and 61601218), Key University Science Research Project of Jiangsu Province (No. 19KJA520005), Jiangsu Provincial Foundation for Distinguished Young Scholars (No. BK20170041), Natural Science Basic Research Program of Shaanxi (No. 2019JM-016), China-Sweden Joint Mobility Project (No. 51811530018) and Fundamental Research Funds for the Central Universities.
Appendix A. Supplementary dataSupplementary material related to this article can be found, in the online version, at doi:https://doi.org/10.1016/j.cclet.2020.03.037.
| [1] |
Y.P. Ow, D.R. Green, Z. Hao, T.W. Mak, Nat. Rev. Mol. Cell Biol. 9 (2008) 532-542. |
| [2] |
S.A. Detmer, D.C. Chan, Nat. Rev. Mol. Cell Biol. 8 (2007) 870-879. DOI:10.1038/nrm2275 |
| [3] |
L. Guarente, Cell 132 (2008) 171-176. DOI:10.1016/j.cell.2008.01.007 |
| [4] |
J. Xu, F. Zeng, H. Wu, et al., Small 10 (2014) 3750-3760. DOI:10.1002/smll.201400437 |
| [5] |
G. Deliconstantinos, V. Villiotou, J.C. Stavrides, Biochem. Pharmacol. 49 (1995) 1589-1600. DOI:10.1016/0006-2952(95)00094-G |
| [6] |
S.J. Singer, G.L. Nicolson, Science 175 (1972) 720-731. DOI:10.1126/science.175.4023.720 |
| [7] |
L.P. Katherine, Int. Rev. Cytol. 192 (1999) 189-221. |
| [8] |
S.X. Lee, H.N. Lim, I. Ibrahim, et al., Biosens. Bioelectron. 89 (2017) 673-680. DOI:10.1016/j.bios.2015.12.030 |
| [9] |
O. Nadiv, M. Shinitzky, H. Manu, et al., Biochem. J. 298 (1994) 443-450. DOI:10.1042/bj2980443 |
| [10] |
J.J. Lemasters, Rejuvenation Res. 8 (2005) 3-5. DOI:10.1089/rej.2005.8.3 |
| [11] |
C.W. Wang, D.J. Klionsky, Mol. Med. 9 (2003) 65-76. DOI:10.1007/BF03402040 |
| [12] |
M.B. Azad, Y. Chen, E.S. Henson, et al., Autophagy 4 (2008) 195-204. DOI:10.4161/auto.5278 |
| [13] |
K. Kiselyov, J.J. Jennings Jr., Y. Rbaibi, C.T. Chu, Autophagy 3 (2007) 259-262. DOI:10.4161/auto.3906 |
| [14] |
Z. Zou, Q. Yan, S. Ai, et al., Anal. Chem. 91 (2019) 8574-8581. DOI:10.1021/acs.analchem.9b01861 |
| [15] |
Z. Yang, Y. He, J.H. Lee, et al., J. Am. Chem. Soc. 135 (2013) 9181-9185. DOI:10.1021/ja403851p |
| [16] |
Y. Chen, L. Li, W. Chen, H. Chen, J. Yin, Chin. Chem. Lett. 30 (2019) 1353-1360. DOI:10.1016/j.cclet.2019.02.003 |
| [17] |
H. He, T. He, Z. Zhang, X. Xu, Y. Yang, Chin. Chem. Lett. 29 (2018) 1497-1499. DOI:10.1016/j.cclet.2018.08.019 |
| [18] |
W. Qin, C. Xu, Y. Zhao, C. Yu, W. Huang, Chin. Chem. Lett. 29 (2018) 1451-1455. DOI:10.1016/j.cclet.2018.04.007 |
| [19] |
Y. Wu, W. Shu, C. Zeng, et al., Dyes Pigm. 168 (2019) 134-139. DOI:10.1016/j.dyepig.2019.04.049 |
| [20] |
Y. Baek, S.J. Park, X. Zhou, et al., Biosens. Bioelectron. 86 (2016) 885-891. DOI:10.1016/j.bios.2016.07.026 |
| [21] |
H. Wang, B. Fang, L. Xiao, et al., Part A 203 (2018) 127-131. DOI:10.1016/j.saa.2018.05.121 |
| [22] |
D. Yue, M. Wang, F. Deng, W. Yin, Z. Xu, Chin. Chem. Lett. 29 (2018) 648-656. DOI:10.1016/j.cclet.2018.01.046 |
| [23] |
M. Wu, Q. Lai, J. Zhou, et al., Mater. Rep. 33 (2019) 48-55. |
| [24] |
Y. Chen, T. Wei, Z. Zhang, W. Zhang, X. Chen, Chin. Chem. Lett. 28 (2017) 1957-1960. DOI:10.1016/j.cclet.2017.05.010 |
| [25] |
R. Guo, J. Yin, Y. Ma, Q. Wang, W. Lin, J. Mater. Chem. B 6 (2018) 2894-2900. DOI:10.1039/C8TB00298C |
| [26] |
S.J. Li, Y. Li, H.W. Liu, et al., Anal. Chem. 90 (2018) 9418-9425. DOI:10.1021/acs.analchem.8b02068 |
| [27] |
H. Li, C. Xin, G. Zhang, et al., J. Mater. Chem. B 7 (2019) 4243-4251. DOI:10.1039/C9TB00576E |
| [28] |
M. Ren, B. Deng, K. Zhou, et al., Anal. Chem. 89 (2016) 552-555. |
| [29] |
Y. Chen, T. Zhang, X. Gao, W. Pan, B. Tang, Chin. Chem. Lett. 28 (2017) 1983-1986. DOI:10.1016/j.cclet.2017.08.024 |
| [30] |
Z. Zhang, Y.S. Wu, K.C. Tang, et al., J. Am. Chem. Soc. 137 (2015) 8509-8520. DOI:10.1021/jacs.5b03491 |
| [31] |
W. Huang, L. Sun, Z. Zheng, J. Su, H. Tian, Chem. Commun. 51 (2015) 4462-4464. DOI:10.1039/C4CC09613D |
| [32] |
J. Wang, X. Yao, Y. Liu, et al., Adv. Optical Mater. 6 (2018) 1800074. DOI:10.1002/adom.201800074 |
| [33] |
Y. Hong, J.W.Y. Lam, B.Z. Tang, Chem. Commun (2009) 4332-4353. |
| [34] |
H. Zhou, J. Mei, Y.A. Chen, et al., Small 12 (2016) 6542-6546. DOI:10.1002/smll.201600731 |
| [35] |
Q. Gong, W. Qin, P. Xiao, et al., Chem. Commun. 56 (2019) 58-61. |
| [36] |
J. Chen, Y. Wu, X. Wang, et al., Phys. Chem. Chem. Phys. 17 (2015) 27658-27664. DOI:10.1039/C5CP04400F |
| [37] |
G. Sun, H. Zhou, Y. Liu, et al., ACS Appl. Mater. Interfaces 10 (2018) 20205-20212. DOI:10.1021/acsami.8b06461 |
| [38] |
Z. Zheng, Q. Dong, L. Gou, J. Su, J. Huang, J. Mater. Chem. C 2 (2014) 9858-9865. DOI:10.1039/C4TC01965B |
| [39] |
H.V. Humeniuk, A. Rosspeintner, G. Licari, et al., Angew. Chem. Int. Ed. 130 (2018) 10719-10723. DOI:10.1002/ange.201804662 |
| [40] |
Z. Zhang, W. Song, J. Su, H. Tian, Adv. Funct. Mater. 30 (2019) 1902803. |
| [41] |
L. Wang, W. Du, Z. Hu, et al., Angew. Chem. Int. Ed. 58 (2019) 14026-14043. DOI:10.1002/anie.201901061 |
| [42] |
N. Wang, C. Xin, Z. Li, et al., Dye. Pigment. 163 (2019) 425-432. DOI:10.1016/j.dyepig.2018.12.027 |
| [43] |
M.A. Haidekker, E.A. Theodorakis, Org. Biomol. Chem. 5 (2007) 1669-1678. DOI:10.1039/B618415D |
| [44] |
M.A. Haidekker, T.P. Brady, S.H. Chalian, et al., Bioorg. Chem. 32 (2004) 274-289. DOI:10.1016/j.bioorg.2004.04.002 |
| [45] |
X. Wang, F. Song, X. Peng, Dye. Pigment. 125 (2016) 89-94. DOI:10.1016/j.dyepig.2015.10.012 |
| [46] |
P. Ning, P. dong, Q. Geng, et al., J. Mater. Chem. B 5 (2017) 2743-2749. DOI:10.1039/C7TB00136C |
| [47] |
W. Feng, M. Li, Y. Sun, G. Feng, Anal. Chem. 89 (2017) 6107-6113. |
| [48] |
G. Zhang, Y. Ni, D. Zhang, et al., Spectrochim. Acta, Part A 214 (2019) 339-347. DOI:10.1016/j.saa.2019.02.068 |
| [49] |
S. Geisler, K.M. Holmstrom, D. Skujat, F.C. Fiesel, O.C. Rothfuss, P.J. Kahle, W. Springer, Nat. Cell Biol. 12 (2010) 119-131. DOI:10.1038/ncb2012 |
| [50] |
S. Rodriguez-Enriquez, L. He, J.J. Lemas ters, Int. J. Biochem. Cell Biol. 36 (2004) 2463-2472. DOI:10.1016/j.biocel.2004.04.009 |
| [51] |
M. Li, A. Lee, K.L. Kim, et al., Angew. Chem. Int. Ed. 57 (2018) 2120-2125. DOI:10.1002/anie.201711629 |
| [52] |
W. Yang, C. Yu, C. Wu, S.Q. Yao, S. Wu, Polym. Chem. 8 (2017) 4043-4051. DOI:10.1039/C7PY00666G |
| [53] |
C. Yu, L. Qian, J. Ge, et al., Angew. Chem. Int. Ed. 55 (2016) 9272-9276. DOI:10.1002/anie.201602188 |