 2020, Vol. 31

b School of Water Conservancy and Architectural Engineering, Shihezi University, Shihezi 8320001, China;
c College of Environment and Ecology, Chongqing University, Chongqing 400001, China
Polyvinyl alcohol (PVA) is commonly used as a binder and sizing agent for textiles. It is obtained from the hydrolysis of polyvinyl acetate [1, 2]. It has excellent characteristics such as good stability, low cost and cheap processing [3]. Therefore, in the printing and dyeing industry, PVA is widely used as a sizing slurry [4]. Hundreds of tons of PVA are used worldwide each year [5]. When PVA-containing wastewater accumulates in the environment, the surface foam and the viscosity of the contaminated water body is increased, the activity of aerobic microorganisms is affected, and the migration of heavy metals in the water body is intensified, resulting in a more serious environment problem [6, 7]. Organic pollutant as PVA is not biodegradable to an extent due to its high molecular weight [8]. Traditional biological wastewater treatment methods are difficult to degrade PVA, so abiotic biological pretreatment must be performed before it is released into biological treatment equipment. Thus, more and more people are exploring a new method to remove PVA.
In recent years, many techniques have been developed for degradation of PVA. Photochemistry is a popular method for researchers [5, 7-10]. Other PVA removal techniques focus on methods such as partial oxidation by dimensional stable anode (DSA) [11], the Fenton process [12] or wet oxidation [13]. Most of these approaches require complex equipment or have some restrictions. Hence, it is difficult to use them in the actual treatment of dyeing wastewater [14].
Recently, electrocoagulation (EC), is a potential alternative to the traditional chemical coagulation [15, 16], which is to immerse two metal electrodes in the polluted water and apply direct current between the two metal electrodes [17], could generates odorless, clear, and colorless water. Among PVA treatment technologies, EC technology is thought to be easy to be operate ascribe to its large volume handling ability, avoidance of chemical use, low sludge generation, fast reaction rate, lower capital and operation costs. In addition, it is deemed as environmentally friendly and nontoxicity too [18]. Previously, Chou et al. have used EC to degrade PVA and received a satisfactory result [4, 19, 20]. However, in these studies, the detail mechanism for PVA degradation are still not clarified. The EC process directly or through the electronic Fenton process generates ·OH to crack organic compounds, or generates flocs of Fe(OH)n to adsorb organic compounds [21]. It should be noticed that other electrochemical reactions still occur in the EC process, such as the contribution of the anode and cathode and the degradation of PVA by other free radicals. To date, the contribution of anodes oxidation, cathodes reduction, flocculation, and free radicals to the system has not been discussed in detail during the EC process. This paper would focus on describing all electrochemical reactions during the EC process that degrades PVA and each reaction's contribution for PVA degrading.
The purpose of this study is to investigate the efficiency of EC systems for PVA degradation. The procedural mechanism of PVA degradation in the EC system is systematically investigated. Effects of cell voltage, pH, electrolyte concentration and interelectrode distance on the removal efficiency of PVA are investigated. The contribution of flocculation, anode oxidation, cathode reduction and free radicals oxidation to PVA degradation are discussed. And a degradation pathway for PVA is obtained.
All chemicals used in this study were analytical grade or higher and used as received. The detailed information is listed in Text S1 (Supporting information).
The EC systems are shown in Fig. S1 (Supporting information). The experiment is performed in a 500 mL beaker. In the experiments, the same PVA solution is added to the reactor and diluted to a 500 mL graduation line to ensure that the initial PVA concentration is 200 mg/L each time. A magnetic stir bar is added to the reactor. The speed of the magnetic stirrer is appropriate to ensure that the solution is mixed uniformly and the floc is not broken. For the EC experiments, the anode is a stainless steel electrode (0.6 cm × 12 cm), and the cathode is a graphite rod electrode (0.6 cm × 12 cm). For the electrochemical oxidation (EO) trials, a DSA electrode (1 cm × 12 cm) is used as the anode and the graphite rod electrode (0.6 cm × 12 cm) is used as cathode. All electrolytic experiments are completed within 60 min. Diluted HCl and NaOH solution is added to adjust the pH value of the solutions. The cathode and anode are immersed in the polyvinyl alcohol aqueous solution to a depth of 10 cm, and the distance between the two electrodes is 3 cm. The above experiments are carried out under normal temperature conditions. To verify the efficiency of electrochemical oxidation degradation of PVA, a salt bridge is added (Fig. S1b). In this experiment, the stainless steel electrode and graphite rod electrode are immersed in two cells, and the two cells are connected with a salt bridge. All other experimental conditions have been adjusted based on the optimal experimental parameters.
The concentration of the PVA solution is determined by UV–vis spectrophotometry after the PVA solution is mixed with the I2/KI-iodine solution [22]. 0.1 g PVA is added with appropriate amount of deionized water, dissolved by heating, and diluted to 100 mL after cooling to obtain 1 g/L PVA standard solution. Other standard concentration solutions are formulated by analogy [23]. Configuration method of color development solution: 4 g Boric acid is placed in a 100 mL volumetric flask to volume; 2.5 g KI is placed in a 100 mL brown volumetric flask, dissolved in deionized water, and 0.65 g of iodine is added to the volume, and then mixed the I2/KI and H3BO3 solutions in a 1:5 ratio. Eight flasks are prepared, with each containing 5 mL of standard PVA solution, 6 mL of color development solution, and then the deionized water is added to make up to 30 mL. Then 3 mL of the solutions are placed in cuvettes, and the absorbance spectra are measured at 690 nm via a spectrophotometer (DR6000 HACH, American). The measured absorbance values are used to construct a calibration curve. In subsequent experiments, the absorbance value of the sample is measured in the same way, and the measured value is substituted into the standard curve to determine the sample concentration [5].
Morphological and elemental analysis of the flocs are performed by scanning electron microscopy (SEM) and energy dispersive X-ray spectroscopy (EDS) (FEI Quanta 650, FEI Company, U. S. A.) analysis. The thermal decomposition performance of the floc is measured by a thermogravimetric analyzer (TGA) (PE Pyris 1, Perkinelmer, U. S. A.) instrument heated from room temperature to 700 ℃ at a heating rate of 10 ℃/min under a nitrogen atmosphere. The floc is powdered after drying and prepared as KBr discs for characterization by Fourier transform infrared spectrometry (FTIR) (Thermo Scientific Nicolet 6700, Thermo Fisher Scientific, U. S. A.). 110-Phenanthroline spectrophotometric method (λmax, 510 nm) [24] is used to measure the concentrations of total iron and ferrous, the concentration of Fe3+ is calculated as the Fe2+ ion concentration subtracted from the total iron concentration.
The molecular weight and distribution of the raw and processed PVA solution is determined by Gel Permeation Chromatography (GPC) (Waters 1515, Waters ltd., U. S. A.) with a Waters 1515 isocratic HPLC pump and a Waters 2414 refractive index detector. The PVA solution (0.30 g) is added to a 5 mL sample bottle, and ultrapure water containing 0.1 mol/L sodium nitrate is added to the scale line. This mixed solution is ultrasonically dispersed and ready for testing. A water linear column of ULTRAHYDROGEL 120 PKGD, ULTRAHYDROGEL 250 PKGD and ULTRAHYDROGEL 500 PKGD are chosen. The mobile phase is ultrapure water containing 0.1 mol/L NaNO3, and the flow rate is 1 mL/min. The relative molecular weight of Polymer Standards Service-U.S.A. Inc. 430-330, 000 is used to construct a standard curve.
The intermediates of EC-treated PVA solution is identified by Agilent GC–MS system (Agilent 7890B-5977B-GC/MS, Agilent Technologies Inc., U. S. A.). Prior to GC–MS analysis, the 10 mL sample solution is placed in a 15 mL headspace bottle. The aged 100 μm PDMS extraction head is inserted into the headspace of the sample vial and adsorbed at 60 ℃ for 120 min. After the adsorption, the extraction head is taken out and inserted into the gas chromatograph. The sample is desorbed at 250 ℃ for 3 min. The GC–MS is equipped with a DB-5MS column (30 mm × 250 mm × 0.25 μm), and the GC column is operated in a temperature programmed mode at 60 ℃ for 1 min, raised to 200 ℃ at 12 ℃/min, and then raised to 325 ℃ at 5 ℃/min, and finally held at 325 ℃ for 8 min.
In the electrochemical treatment process, energy consumption is a very important indicator, which directly determines the treatment cost in industrial implementation. Therefore, in laboratory-scale processing, the electrical energy per order (EEO) is an important indicator that can provide preliminary information about energy consumption during processing [25]. Eq. 1 is used to calculate EEO values refer to previous work conducted by Zhu et al. [26].
|
(1) |
where P is the rated power (kW), V is the volume of the reaction solution (L), C0 and Ct are the initial and final concentration of PVA, respectively (mg/L).
The progress of the electrochemical reaction is directly affected by the applied cell voltage, so the optimal cell voltage is determined by the value of the PVA removal efficiency [11]. The effect of applied cell voltage in the range of 7 V to 11 V on the removal efficiency is investigated, which is as revealed in Fig. S2a (Supporting information). The initial solution pH is 7.0, the supporting electrolyte is 0.02 mol/L NaCl. At 7 V, 9 V and 11 V, the degradation efficiency is 74.58%, 93.94% and 96.18%, respectively. Obviously, the greater the applied cell voltage, the higher the degradation efficiency in the range of 7 V to 11 V. As is well-known that the voltage determines the formation of coagulant and the rate of hydrogen bubble generation, which determines the efficiency of the EC and the size and growth of the floc. As the cell voltage increases, the rate of formation of coagulant (Fe2+ or Fe3+ ions) on the anode is increased. Under the same conditions, the experimental amount of stainless steel electrodes dissolution is 0.126 g, 0.161 g and 0.214 g when the cell voltage is 7 V, 9 V and 11 V, respectively. However, when the cell voltage is increased from 9 V to 11 V, the removal efficiency only increases from 93.94%–96.18% in increments of 2.24%. It can be revealed in insert Fig. S2a that the EEO is the lowest at 9 V (2.55 KWh/m3), so the 9 V is considered to be the optimum cell voltage.
Effect of the initial pH on the PVA removal efficiency is shown in Fig. S2b (Supporting information). At initial pH 3, 7, 11, the degradation efficiency is 76.46%, 93.94% and 88.93%, respectively. Under acidic conditions, Fe3+ exists in the solution as Fe(OH)2+, Fe(OH)2+ and Fe2(OH)24+. These substances are beneficial to the EC system [27]. In addition, when pH < 6.0, soluble Fe(Ⅲ) and Fe(Ⅱ) are relatively stable. And ascribe to the generated OH- being neutralized by the H+ in the solution, the iron floc formed in the solution is negligible [28]. Under the condition of pH 11, the main reason for poor performance may be the presence of Fe(OH)4- and Fe(OH)63- ions at high pH [29, 30]. Moreover, in insert Fig. S2b, the EEO is the lowest at pH 7 (2.55 KWh/m3). According to the analysis of the above results, the optimal pH value of EC-treated PVA is 7. It is worth noting that the pH is changing as the reaction goes on, in Fig. S3 (Supporting information). This is because the hydrogen produced is dominant under acidic conditions. The oxygen generated under alkaline conditions is dominant. But the change of pH has little effect on the removal efficiency of PVA. From the scientific and economic point of view, the average pH of 7 is the optimum condition for the treatment of PVA by EC.
The anode is accelerated to dissolve under the condition of sodium chloride as the supporting electrolyte. Therefore, in this experiment, NaCl is used as the supporting electrolyte for PVA treatment. As shown in Fig. S2c (Supporting information), PVA removal efficiency is increased with increasing support electrolyte concentration. At initial supporting electrolyte 0.01, 0.02 and 0.03 mol/L, the removal rate of PVA reach 61.21%, 93.94% and 98.63%, respectively. When there are few electrolytes, the mass transfer rate of the reaction system is low and the formation of active radicals is less. This phenomenon will reduce the removal efficiency of PVA [27]. It is worth noting that when the electrolyte concentration in the solution is greater than 0.02 mol/L, the PVA removal rate increases slowly. This may mean that when the conductivity of the solution reaches a certain value, side reactions may occur, such as electrolytic water. As shown in insert Fig. S2c, the EEO is 3.86, 2.55 and 2.27 KWh/m3, respectively. Under the same conditions, the experimental amount of stainless steel electrodes dissolution is 0.104, 0.161 and 0.208 g when the initial supporting electrolyte is 0.01, 0.02 and 0.03 mol/L, respectively. This shows that as the electrolyte concentration increases, the stainless steel anode is accelerated to dissolve, and the life of the electrode is affected. Therefore, the most suitable electrolyte concentration in this reaction system is 0.02 mol/L.
The distance between electrodes is also studied as an important condition. In Fig. S2d (Supporting information), the removal rate of PVA is no amelioration at 1.0, 2.0 and 3.0 cm, reached 97.21%, 94.47% and 93.94%, respectively. However, it can be found that the removal rate of PVA is gradually reduced as the distance between the plates increases. This may be because when other conditions are constant, the electric field strength will be weakened by the increase of the plate spacing, and the mass transfer efficiency in the electrochemical system will be affected, so that the removal efficiency of PVA is reduced [31]. Although the contaminant removal rate is increased as the plate spacing is reduced, the energy consumption in the reaction system is increased at a smaller plate spacing. As shown in insert Fig. S2d, the EEO is 3.23, 3.10 and 2.55 KWh/m3, respectively. In addition, if the plate spacing is too small, the electric field is too strong, which may cause the risk of instantaneous discharge, so that the electrode plate is worn out. Under the same conditions, the experimental amount of stainless steel electrodes dissolution is 0.268 g, 0.223 g and 0.161 g when the interelectrode distance is 1.0, 2.0 and 3.0 cm, respectively. In summary, setting the plate spacing to 3.0 cm is the most suitable for removing PVA.
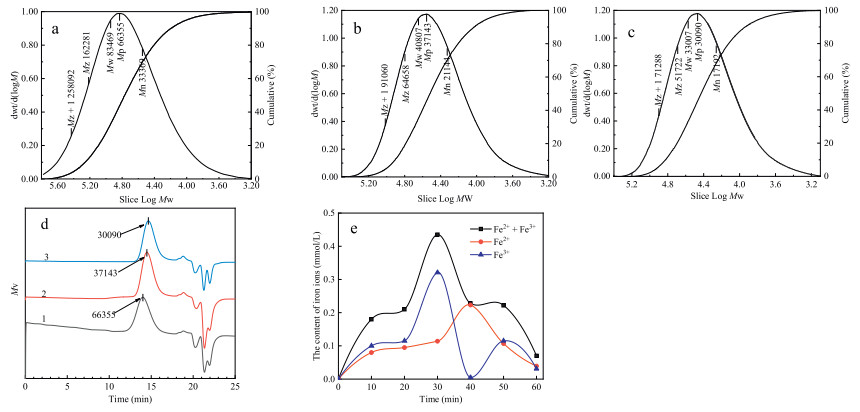
Possible contributions of each process are discussed. It is speculated that the possible degradation pathways of PVA in the system are: Direct oxidation of the anode, reduction of the cathode, oxidation of ·OH and ·Cl, and removal of PVA by flocs. In order to test the contribution of free radicals to the system, experiments are performed with the addition of benzoic acid and i-PrOH [32, 33]. ·OH can be quenched by both benzoic acid and i-PrOH, while ·Cl can be quenched only by benzoic acid. However, it is worth noting that benzoic acid is weakly acidic in solution and will affect the formation of iron hydroxide flocs in the EC system. In order to identify the contribution of direct oxidation and cathodic reduction to PVA removal, a DSA electrode is introduced as the anode, 0.02 mol/L Na2SO4 is used as the electrolyte for the electrode oxidation experiment, and other conditions are unchanged. At the same time, in order to verify the contribution of the anode and cathode to the system, the salt bridge is used to degrade PVA. The result is shown in Fig. 1a. As shown in Fig. 1a, the addition of isopropanol had basically no effect on the degradation of PVA. However, it should be noticed that this does not mean that there are almost no ·OH radicals in the EC system. ·OH will be destroyed under conditions of excess iron cations [34]. And from the reaction of the first 20 min, it can be inferred that hydroxyl radicals contribute to the reaction system. After the excess benzoic acid is added, no flocs are produced in the solution, and the degradation ratio of PVA is 22.65%. Therefore, the degradation ratio of PVA by the iron hydroxide and radical in the system is 71.29%, and the degradation ratio of the electrode is 22.65%. As an inert electrolyte, sodium sulfate has little effect on the electrochemical system [35]. In the electrochemical oxidation system (EO/Na2SO4), DSA is used as the anode, graphite is used as the cathode, and 0.02 mol/L Na2SO4 is used as an electrolyte to verify the ratio of the anionanodic degradation of PVA, and the result is 25.38%. Compared with EO/Na2SO4, the removal rate of PVA by EO/NaCl is 30.61%. Therefore the degradation effect of ·Cl on PVA is estimated to be 5.23%. To verify the efficiency of electrochemical oxidation degradation of PVA, a salt bridge is added. As shown in Fig. 1a, the removal effects of the anode and cathode are 12.76% and 8.02%, respectively. This is basically consistent with the previous calculation.

|
Download:
|
| Fig. 1. (a) Removal efficiency of PVA in six different systems. EC/NaCl +10 mg/L i-PrOH and EC/NaCl +10 mg/L benzoic acid system capturing ·OH and ·Cl. Conditions: 9 V, initial pH 7.0, 0.02 mol/L support electrolyte, interelectrode distance 3 cm; The anode degradation and cathode degradation are measured by a salt bridge. Conditions: I =170 mA, initial pH 7.0, 0.02 mol/L support electrolyte, interelectrode distance 3 cm. (b) Influence of different experimental factors on current efficiency. | |
To speculate the respective contributions of radical and flocs to PVA degradation, an excess of HCl is added to the EC-treated solution in order to desorb PVA in the flocs. Finally, it is found that the removal of PVA by flocs is 51.27%. Therefore, it can be inferred that the degradation ratio of radicals to PVA is 20.02%. This result can also be confirmed in the experiments conducted by Abdoulaye Thiam et al. [34]. This means that the production of ·Cl may be small and cannot be accumulated, but its content is sufficient to react with PVA. Under the action of reactive free radicals, the main chain of PVA is induced to break, as will be later demonstrated.
It can be observed from Fig. 1b that the current efficiency changed under various factors. A very interesting finding is that the current efficiency is closest to 100% only under the best experimental conditions: Cell voltage 9 V, pH 7, electrolyte concentration of 0.02 mol/L and interelectrode distance of 3 cm. Under other experimental conditions, the difference between the measured loss of stainless steel electrode and the theoretical amount, in addition to the dissolution of the anode, can also be attributed to the corrosion chemical dissolution of the stainless steel electrode [15, 36].
The efficiency of the electrocoagulation wastewaters treatment mainly depends on the amount and speciation of metal dissolved during the treating process [37]. In order to calculate the dissolution of stainless steel electrodes during electroflocculation, the weight (Mexp) of the electrodes before and after electrolysis is measured and compared with the theoretical dissolution (Mth). Then the dissolution of stainless steel electrodes could be calculated using Faraday's law as follows [28, 38] (Eqs. 2 and 3):

|
(2) |
|
(3) |
Where Mth is the theoretical amount of iron dissolution, Mexp is the experimental amount of iron dissolution, M is relative atomic mass, F is the Faraday constant (96, 487 C/mol), I is the current (A), t is the electrolysis time (s), n is number of electrons transferred, CE is the current efficiency.
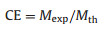
It can be seen on Figs. 2a and b that the floc is composed of Fe, Cr, Cl, Na, O and C. It is worth noting that since a certain amount of Cr is present in the stainless steel electrode, Cr is oxidized to Cr3+ during electrolysis. In a neutral or alkaline environment, Cr3+ exists mainly in the form of Cr(OH)3 colloid or precipitate, so it also plays a role in the flocculation process. In the floc, the ratio of Fe to Cr in the floc is 4:1. Therefore, in Eq. 2, M = 0.4/0.5 × 56 + 0.1/0.5 × 52 = 55.2; n = 0.4/0.5 × 2 + 0.1/0.5 × 3 = 2.2. The electric current will fluctuate slightly during the reaction due to the changing of some intermediates in the degradation reaction. Therefore, the average value of the current is calculated according to the instantaneous value of the current at different times in the electrolysis process.

|
Download:
|
| Fig. 2. (a) EDS of the floc, (b) elements contained in the floc, (c-e) SEM image of the floc, (f) TGA of the floc. | |
The SEM results are indicated in Figs. 2c–e. As can be seen from Fig. 2c, it is obvious that the surfaces of the partial particle sections are smooth and regular, and some seem to be sticky and crosslinked, which can be more clearly shown in Figs. 2d and e. It can be proved that there is a large amount of PVA in the floc. The thermogravimetric analysis (TGA) for the floc at 10 ℃/min heating rate with N2 is shown in Fig. 2f. The nature of the TGA trace shows PVA decomposition and other components up to a temperature of 244.01 ℃, losing about 29.52% of its weight. This also verified the presence of a large amount of PVA in the floc. Between 390 ℃ and 500 ℃, the main occurrence is the Cr(OH)3 oxidizes, losing about 7.68% of its original weight.
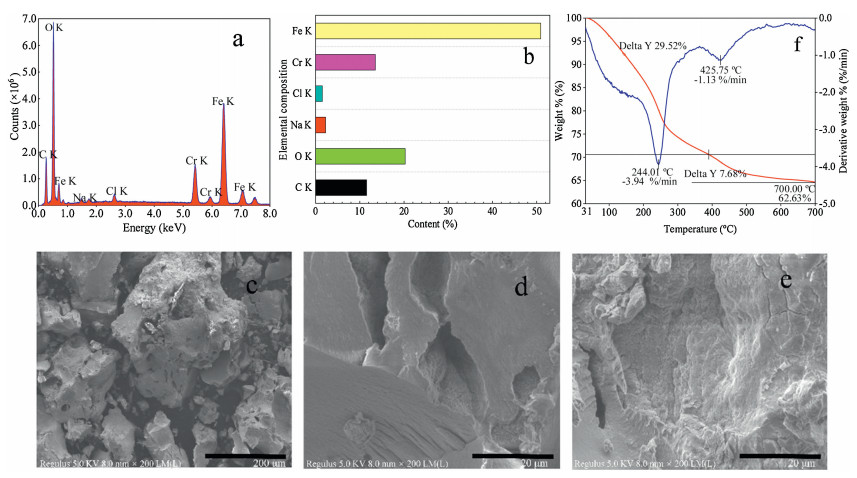
The molecular weights and distributions of initial, 30 min treated and 60 min treated PVA samples that analyzed by GPC are presented in Figs. 3a–c. It can be observed that the number average molecular weight decreased from original 33, 369 to 21144, and the weight average molecular weight from 83, 469 to 40, 807 after 30 min. It can also be seen from Fig. 3d that the GPC relative molecular mass of the solution is greatly reduced after 30 min of reaction, which also indicated that the relatively high molecular weight relative molecular mass PVA is degraded into substances with small molecular weight by electrochemical oxidation. Additionally, the polydispersity index (PDI) (measurement of broadness of a molecular weight distribution of a polymer sample) is taken into consideration. The molecular weight distribution is to the polydispersity index [8]. The number average molecular weight, the weight average molecular weight, and the polydispersity index did not change substantially during the period of 30 min–60 min.

|
Download:
|
| Fig. 3. GPC spectrum of PVA: (a) original, (b) oxidized 30 min and (c) oxidized 60 min (Mw is weight average molecular weight, Mp is maximum peak molecular weight). (d) Molecular weight distribution of PVA: (a) original, (b) oxidized 30 min and (c) oxidized 60 min. (e) Iron ion content changes with time in EC. | |
Since the generation of the flocs are mainly due to the role of iron ions, it is important to investigate the variation tendency of Fe2+ and the total iron ion content in solution. As shown in Fig. 3e, 0-30 min, as the ferric iron is continuously formed by oxidation, flocculation is also constantly occurring. The ferric iron is accumulated to the maximum until the reaction for 30 min, after which the ferric iron ions formed a lot of flocs, and at this time, the ferric ion content in the solution is drastically lowered. The ferric ion in the solution is completely flocculated until 40 min. Subsequently, ferric ions continue to be generated because the ferrous ions generated by the anode are oxidized, and thus the PVA in the solution is continuously flocculated.
Therefore, it can be inferred that 0-30 min, the removal of PVA is mainly caused by electrochemical oxidation and flocculation; from 30 min to 60 min, the removal of PVA is mainly caused by flocculation. According to this phenomenon, it can be speculated that the end degradation products carbon dioxide is transformed under alkaline conditions, and then accumulated in the species of bicarbonate and carbonate ions. These products could actually inhibit PVA oxidation by quenching hydroxyl radicals [11]. Also, the oxidizing capability of hydrogen peroxide and other related oxidants could be reduced with the increasing of the solution pH. Therefore, in the later 30 min, the degradation of PVA by ·OH is basically negligible [39], which is basically consistent with the analysis of Fig. 1 that mentioned above.
In order to identify PVA oxidation performance during the electrochemical oxidation process, FTIR spectra is employed. FTIR spectra of the PVA solution before and after electrochemical oxidation are revealed in Fig. 4a. It can be seen that the peak intensities of stretching vibrations at 3313.3 cm-1 (nO-H), 2941.0 cm-1 (nC–H), and 1094.7 cm-1 (nC–O) is significantly reduced after 60 min. The nC–C associated with the PVA crystallization at 1143.6 cm-1 is significantly reduced, indicating that the crystal structure of the PVA is destroyed. The peak at 1094.7 cm-1 almost disappears, indicating that the C–O bond in PVA changes and may be oxidized to C=O. A new adsorption peak appeared at 1710 cm-1 (nC = O), which showed that carbonyl bonds formed in the degradation products. Aromatic cyclic groups are observed by the intensity of the band at 1544.2 cm-1 [5, 40-42].

|
Download:
|
| Fig. 4. (a) FT-IR spectrums of PVA solution during different reaction stage; (b) GC–MS spectrum of PVA solution with treatment; (c) Reaction mechanism of EC; (d) The possible removal pathway of PVA by EC. | |
The intermediates by EC process detected by GC–MS are listed in Fig. 4b and Table S1 (Supporting information). Obviously, the characterization results of GC–MS are consistent with the characterization of FTIR. The main component of untreated polyvinyl alcohol wastewater is PVA. After EC treatment, the type and number of organic substances in the solution are increased, which also corresponded to the CGP test results. The components retrieved mainly include esters, aldehydes, alkanes and aromatic hydrocarbons. It was shown that under the action of strong oxidant, the unsaturation of PVA is increased, the carbon chain is broken, and it is degraded into a small molecular substance with simple structure and good biodegradability. These small molecules are finally transformed into CO2 and H2O.
Fig. 4c showed the possible mechanism of PVA removal by EC. And the PVA removal pathway by EC coupling with catalytic oxidation is proposed based on the above identification, which is revealed on Fig. 4d. It is suggested that distinct pathway might occur during the removal of PVA by free radicals oxidation (·OH and ·Cl) and the hydrogenation in EC [28, 43]. In this pathway, on the one hand, active free radicals attack the carbon atom attached to the hydroxyl group, which leads to random chain scission. Electron rearrangement and hydrogen group transfer result in oxidization of the chain scission products to carbonyl compounds [5]. On the other hand, the PVA molecular chain would form an olefin chain after dehydration during oxidization. However, due to the hydroxyl group in the polyol, it can be condensed and grafted with various substances. Therefore, aromatic hydrocarbon compounds such as benzene, naphthalene, anthracene, and so forth are produced.
In conclusion, when EC is used for PVA degradation, the direct oxidation of the anode, reduction of the cathode, oxidation of ·OH and ·Cl and flocculation work in synergy for effective degradation. The optimum experimental conditions obtained are as follows: cell voltage 9 V, pH 7, NaCl concentration 0.02 mol/L, and interelectrode distance 3.0 cm. By contrast, electroflocculation had made an outstanding contribution to the removal of PVA. Free radicals, especially ·OH and ·Cl, are equivalent to the contribution of the electrodes in the degradation of PVA under EC. After 30 min, the relative molecular weight of PVA decreased obviously due to chain scission. In 30-60 min, the removal of PVA is mainly the contribution of flocculation. The intermediates identified by GC–MS could indicate that reactions occur in this electrochemical system are mainly containing the free radical oxidation and the hydrogenation. This type of electrochemical system provides an efficient and cost-effective approach for PVA wastewater pretreatment.
Declaration of competing interestThe authors declare that they have no known competing financial interests or personal relationships that could have appeared to influence the work reported in this paper.
AcknowledgmentsThis work is partially supported by the National Natural Science Foundation of China (No. 21906011) and the Postdoctoral Science Foundation of China (No. 2018M643412).
Appendix A. Supplementary dataSupplementary material related to this article can be found, in the online version, at doi:https://doi.org/10.1016/j.cclet.2020.03.051.
| [1] |
M. Roohani, Y. Habibi, N.M. Belgacem, et al., Eur. Polym. J. 44 (2008) 2489-2498. DOI:10.1016/j.eurpolymj.2008.05.024 |
| [2] |
J. Zhang, S. Wang, Y. Guo, et al., J. Environ. Sci. China 25 (2013) 1583-1591. DOI:10.1016/S1001-0742(9)60193-4 |
| [3] |
J. Veres, S. Ogier, G. Lloyd, D. de Leeuw, Chem. Mater. 16 (2004) 4543-4555. DOI:10.1021/cm049598q |
| [4] |
W.L. Chou, C.T. Wang, K.Y. Huang, Desalination 251 (2010) 12-19. DOI:10.1016/j.desal.2009.10.008 |
| [5] |
B. Ye, Y. Li, Z. Chen, et al., Water Res. 124 (2017) 381-387. DOI:10.1016/j.watres.2017.05.059 |
| [6] |
Y.F. Su, Y.Y. Li, M.J. Li, M.Q. Ge, Text. Res. J. 88 (2018) 2464-2474. DOI:10.1177/0040517517725119 |
| [7] |
Y. Zhang, W. Rong, Y. Fu, X. Ma, J. Polym. Environ. 19 (2011) 966-970. DOI:10.1007/s10924-011-0350-0 |
| [8] |
D. Hamad, R. Dhib, M. Mehrvar, Environ. Technol. 37 (2016) 2731-2742. DOI:10.1080/09593330.2016.1160959 |
| [9] |
C.C. Lin, L.T. Lee, J. Ind. Eng. Chem. 21 (2015) 569-574. DOI:10.1016/j.jiec.2014.03.020 |
| [10] |
C.C. Lin, M.S. Wu, Chem. Eng. Process. 85 (2014) 209-215. DOI:10.1016/j.cep.2014.08.012 |
| [11] |
G.T. Li, W.Y. Zhu, X.Q. Chai, L.F. Zhu, X.W. Zhang, J.Ind.Eng. Chem. 31 (2015) 55-60. DOI:10.1016/j.jiec.2015.05.042 |
| [12] |
S.F. Kang, C.H. Liao, M.C. Chen, Chemosphere 46 (2002) 923-928. DOI:10.1016/S0045-6535(01)00159-X |
| [13] |
Y.S. Won, S.O. Baek, J. Tavakoli, Ind. Eng. Chem. Res. 40 (2001) 60-66. DOI:10.1021/ie000658l |
| [14] |
L.S. Thakur, P. Mondal, J. Environ. Manage. 190 (2017) 102-112. DOI:10.1016/j.jenvman.2016.12.053 |
| [15] |
M.Y.A. Mollah, R. Schennach, J.R. Parga, D.L. Cocke, J. Hazard. Mater. 84 (2001) 29-41. DOI:10.1016/S0304-3894(01)00176-5 |
| [16] |
A.E. Yilmaz, R. Boncukcuoǧlu, M.M. Kocakerim, J. Hazard. Mater. 149 (2007) 475-481. DOI:10.1016/j.jhazmat.2007.04.018 |
| [17] |
S. Chellam, M.A. Sari, J. Hazard. Mater. 304 (2016) 490-501. DOI:10.1016/j.jhazmat.2015.10.054 |
| [18] |
C.C. He, C.Y. Hu, S.L. Lo, Sep. Purif. Technol. 165 (2016) 107-113. DOI:10.1016/j.seppur.2016.03.047 |
| [19] |
W.L. Chou, J. Hazard. Mater. 177 (2010) 842-850. DOI:10.1016/j.jhazmat.2009.12.110 |
| [20] |
W.L. Chou, C.T. Wang, C.W. Hsu, K.Y. Huang, T.C. Liu, Desalination 259 (2010) 103-110. DOI:10.1016/j.desal.2010.04.025 |
| [21] |
O. Abdelwahab, N.K. Amin, E.S.Z. El-Ashtoukhy, J. Hazard. Mater. 163 (2009) 711-716. DOI:10.1016/j.jhazmat.2008.07.016 |
| [22] |
J.H. Finley, Anal. Chem. 33 (1961) 1925-1927. DOI:10.1021/ac50154a044 |
| [23] |
S. Cui, Z. Wang, X. Qiang, Y. Guo, J. Xi'an Polytech. Univ. 28 (2014) 68-71. |
| [24] |
L.H. Zhang, J.H. Cheng, X. You, X.Y. Liang, Y.Y. Hu, Environ. Sci. Pollut. R. 23 (2016) 13531-13542. DOI:10.1007/s11356-016-6539-y |
| [25] |
L. Bilinska, K. Blus, M. Gmurek, S. Ledakowicz, Chem. Eng. J. 358 (2019) 992-1001. DOI:10.1016/j.cej.2018.10.093 |
| [26] |
Y. Zhu, X. Wang, J. Zhang, et al., Environ. Sci. Technol. 53 (2019) 9063-9072. DOI:10.1021/acs.est.9b01510 |
| [27] |
D.G. Bassyouni, H.A. Hamad, E.-S.Z. El-Ashtoukhy, N.K. Amin, M.M. Abd El-Latif, J. Hazard. Mater. 335 (2017) 178-187. DOI:10.1016/j.jhazmat.2017.04.045 |
| [28] |
G.B. Ren, M.H. Zhou, P. Su, et al., Chem. Eng. J. 343 (2018) 467-476. DOI:10.1016/j.cej.2018.02.115 |
| [29] |
S. Garcia-Segura, M.M.S.G. Eiband, J.V. de Melo, C.A. Martinez-Huitle, J. Electroanal. Chem. Lausanne 801 (2017) 267-299. DOI:10.1016/j.jelechem.2017.07.047 |
| [30] |
Z. Qiang, J.H. Chang, C.P. Huang, Water Res. 37 (2003) 1308-1319. DOI:10.1016/S0043-1354(02)00461-X |
| [31] |
E. Bocos, E. Brillas, M.A. Sanroman, I. Sires, Environ. Sci. Technol. 50 (2016) 7679-7686. DOI:10.1021/acs.est.6b02057 |
| [32] |
M.J. Watts, K.G. Linden, Water Res. 41 (2007) 2871-2878. DOI:10.1016/j.watres.2007.03.032 |
| [33] |
H. Zhao, Y. Wang, Y. Wang, T. Cao, G. Zhao, Appl. Catal. B:Environ. 125 (2012) 120-127. DOI:10.1016/j.apcatb.2012.05.044 |
| [34] |
A. Thiam, M. Zhou, E. Brillas, I. Sires, Appl. Catal. B:Environ. 150- 151 (2014) 116-125. |
| [35] |
M. Gineys, R. Benoit, N. Cohaut, F. Béguin, S. Delpeux-Ouldriane, Chem. Eng. J. 310 (2017) 1-12. DOI:10.1016/j.cej.2016.10.018 |
| [36] |
P.K. Holt, G.W. Barton, C.A. Mitchell, Chemosphere 59 (2005) 355-367. DOI:10.1016/j.chemosphere.2004.10.023 |
| [37] |
K. Mansouri, A. Hannachi, A. Abdel-Wahab, N. Bensalah, Ind. Eng. Chem. Res. 51 (2012) 2428-2437. DOI:10.1021/ie202188m |
| [38] |
N. Daneshvar, A. Oladegaragoze, N. Djafarzadeh, J. Hazard. Mater. 129 (2006) 116-122. DOI:10.1016/j.jhazmat.2005.08.033 |
| [39] |
I.M. Sasidharan Pillai, A.K. Gupta, J. Environ. Manage. 176 (2016) 45-53. DOI:10.1016/j.jenvman.2016.03.021 |
| [40] |
A. Awadhia, S.L. Agrawal, Solid State Ion. 178 (2007) 951-958. DOI:10.1016/j.ssi.2007.04.001 |
| [41] |
S. Kayal, R.V. Ramanujan, Mat. Sci. Eng. C-Mater. 30 (2010) 484-490. DOI:10.1016/j.msec.2010.01.006 |
| [42] |
H.Y. Rong, B.Y. Gao, M. Dong, et al., J. Hazard. Mater. 252 (2013) 330-337. |
| [43] |
O. Legrini, E. Oliveros, A.M. Braun, Chem. Rev. 93 (1993) 671-698. DOI:10.1021/cr00018a003 |