 2020, Vol. 31

b Research Center for Environmental Quality Management, Kyoto University, Otsu 5200811, Japan
The recent development of new quantitative chemical analytical methods combined with the utilization of liquid chromatography tandem mass spectrometry (LC–MS/MS) has enabled the detection and determination of pharmaceuticals in wastewater and river water at trace levels (ng-μg/L) [1-11]. These latest advancements have revealed that pharmaceuticals, which are intentionally biologically active and occur in environmental waters [12], are of concern for aquatic species. For example, it has been reported that zebrafish shares around 80% of human pharmaceutical targets [13]. Among these biological active pharmaceuticals, it has been estimated that around 40% of them acted on G proteincoupled receptors (GPCRs) [14, 15], the largest membrane receptor families in humans. GPCR targeted pharmaceuticals have been widely used for health care and are largely consumed in many countries. A practical example is the use of valsartan to treat hypertension. In 2012, in England and Germany alone, the consumption of valsartan was estimated at around 6484 kg [8] and 39, 400 kg [16], respectively. In addition, in aging societies, large amounts of GPCR targeted pharmaceuticals are prescribed, especially for beta-blockers or antihypertensive pharmaceuticals [16, 17]. Despite this increasing use of GPCR targeted pharmaceuticals, the current water quality monitoring system does not entirely consider the occurrence of GPCR targeted pharmaceuticals, and a very limited number of GPCR targeted pharmaceuticals have been chemically detected in environmental waters [4-8, 18-26].
Monitoring GPCR targeted pharmaceuticals chemically inwaters can reveal their environmental concentrations. However, their pharmaceutical activities can rarely be sufficiently assessed [27]. One method to assess the biological activities of pharmaceuticals is the in vitro transforming growth factor-α (TGFα) shedding assay, which is a high-throughput assay to detect both agonistic and antagonistic activities of GPCRs [28]. In our previous works, we successfully applied this assay to the effluents of Japanese and English wastewater treatment plants (WWTPs) [29, 30]. Our studies showed a strong antagonistic activity against GPCR classes including angiotensin (AT1), muscarinic acetylcholine (M1), dopamine (D2), histamine (H1) and adrenergic family members (β1), at the level of microgram-antagonist-equivalent quantity (EQ)/L. Although our previous work revealed the important biological activities and occurrence of these GPCR classes, to our best knowledge, no other study has reported the occurrence of these GPCR targeted pharmaceuticals in different areas.
In recent years, China has rapidly increased the production of active pharmaceutical ingredients. In 2011, the production of pharmaceuticals in China was estimated to be more than 2.5 million tons, which is twice the amounts in 2003 [31, 32], suggesting that China is the greatest producer of active pharmaceutical ingredients in the world [32]. Besides, the consumption of pharmaceuticals is also huge due to the development of the Chinese economy and its huge population [32]. Because of the estimated high production and usage volumes of pharmaceuticals in China, it is highly anticipated that the aquatic environments contained high concentrations of pharmaceuticals. Therefore, it is important to evaluate the behaviors of biologically active pharmaceuticals, including their concentrations and the biological toxicity in Chinese environmental waters.
The aim of this study was to investigate the pharmaceutical activities of GPCR targeted pharmaceuticals in Chinese wastewaters. For this purpose, secondary effluent samples of four WWTPs in a northern city in China were collected. The samples were pre-treated and concentrated by solid-phase extraction (SPE). The TGFα shedding assay was applied to evaluate the pharmaceutical activities of GPCRs (i.e., AT1, D2, M1, β1, and H1) in concentrated extracts. Detected activities were quantified as equivalent quantities (EQs) of corresponding reference agonist or antagonist including valsartan-EQ, sulpiride-EQ, pirenzepineEQ, propranolol-EQ and diphenhydramine-EQ for antagonistic activities for AT1, D2, M1, β1, and H1 receptors, respectively. Concentrations of several GPCR targeted pharmaceuticals responding AT1 (valsartan, irbesartan, losartan), D2 (sulpiride), M1 (pirenzepine), β1 (propranolol, atenolol, metoprolol) and H1 (diphenhydramine) receptors were measured by LC–MS/MS in parallel, and we investigated the contribution of these known GPCR targeted pharmaceuticals to measured pharmaceutical activities from the TGFα shedding assay.
The effluent samples were collected from four WWTPs in a northern Chinese city during August 2018. All WWTPs adopted anaerobic–anoxic–oxic (AAO) as secondary treatment. Detailed information of each WWTP are shown in Table S1 (Supporting information). For each sample, 1 L sample was collected, and ascorbic acid (Wako, Osaka, Japan) was spiked to give a final concentration at 1 g/L. All the samples were transported to our laboratories and store at 4 ℃ until use. Filtration was performed within 24 h following sampling. The samples were then pretreated and concentrated by SPE for the TGFα shedding assay and chemical analysis [29, 30]. To perform the TGFα shedding assay, the effluent extracts during cell exposure were serially diluted at the defined concentrations as the relative enrichment factor (REF, representing the ratio of the enrichment factor in the SPE to the dilution factor in the TGFα shedding assay). In addition, Milli-Q water was pretreated and concentrated by SPE. This was used as the blank control to confirm the absence of agonistic or antagonistic pharmaceutical activity by the TGFα shedding assay. According to the previous works, the pharmaceutical activity recoveries of GPCR targeted pharmaceuticals after SPE method by the TGFα shedding assay ranged at the levels of 72%–93% in Milli-Q water and 70%–89% in secondary effluent of WWTPs [30]. This result indicated that our current SPE procedure can capture most of the pharmaceutical activities in secondary effluents.
Our previous studies revealed high antagonistic pharmaceutical activities responding AT1, D2, M1, β1, and H1 receptors in the effluents of English and Japanese WWTPs [29, 30, 33]. Therefore, in this study, the TGFα shedding assay applied these five GPCRs. Each receptor mediated different pathways and has different responses. For example, AT1 and β1 antagonistic pharmaceuticals are applied for the treatment of aging-related and chronic diseases (i.e., hypertension and heart failure). D2 antagonistic pharmaceuticals are applied to treat mental disorder diseases. M1 antagonistic pharmaceuticals are used for overactive bladder. H1 antagonists are used for treating allergy. For each GPCR, positive controls for the activity test were performed by using known agonists and corresponding antagonists, which is the reference pharmaceuticals for quantification of activities detected by the TGFα shedding assay (Table S2 in Supporting information). In this study, the EC50 (the concentration that can trigger 50% of maximum AP-TGFα release), EC20 (a 20% activation of AP-TGFα release for concentration), IC50 (the concentration that can trigger 50% reduction of the agonistinduced AP-TGFα release), and IC20 (a 20% reduction of agonistinduced AP-TGFα release for concentration) values of selected agonists and antagonists for receptors of AT1, D2, M1, β1, and H1 were cited from the previous studies [30, 34].
The critical issue of the TGFα shedding assay for the agonistic test is the activation of downstream signal transduction by agonist binding to corresponding GPCR and the alkaline phosphatasetagged TGFα (AP-TGFα) release into the conditioned medium by ectodomain TNFα-converting enzyme (TACE) in the downstream. For the antagonistic test, the critical issue of the TGFα shedding assay is to inhibit the release of agonist-induced AP-TGFα by corresponding antagonists. Details of the TGFα shedding assaywere previously described [28-30]. Here, we briefly mention the procedure. Aculturedcell line(HEK 293 cells) was firstly transiently transfected with GPCR-expression plasmids. Next, the transfected cells were seeded in a 96 well plate and exposed to reference GPCR targeted pharmaceuticals or wastewater extracts for 1 h, and a conditioned medium was separated. Finally, the extracts' agonistic and antagonistic activities were quantified by measuring the absorbance of AP-TGFα in the conditioned medium and cell plate. All assays were tested in triplicate and were performed twice (n = 6).
In order to reveal the specific interaction between GPCR targeted pharmaceuticals and GPCRs in the TGFα shedding assay, we determined the extract cytotoxicity by the cell counting kit-8 (CCK-8; Dojindo Molecular Technologies, Japan). Additionally, the dilution ranges of wastewater extracts for the TGFα shedding assay were tested under mock transfection condition experiments as previously described [29, 30]. Based on these results, we applied wastewater extracts, which have no cytotoxicity under CCK-8 and no activities under mock transfection condition, to the TGFα shedding assay with a maximum relative enrichment factor value of 20 (Fig. S1 in Supporting information). Neither cytotoxicity nor pharmaceutical activity was observed in Milli-Q water extract under all diluted conditions.
GraphPad Prism 5 software (GraphPad Software, Inc., La Jolla, CA, USA) was used for the analysis of concentration-response data. We calculated EC20, IC20, agonist equivalent quantity (EQ), and antagonist EQ of wastewater extracts by linear concentrationresponse curves approach referring to previous works [30, 33, 35-37]. We applied the linear form of each concentration-response curve to evaluate the EC20 value and IC20 value of each wastewater extract (EC20(extract): a 20% activation of AP-TGFα release for REF; IC20(extract): a 20% reduction of agonist-induced AP-TGFα release for REF). Similarly, the EC20 and IC20 values of the corresponding agonist and the corresponding antagonist, were respectively evaluated. EC20(agonist) and IC20(antagonist) were determined through the concentration-response curves of each agonist and antagonist. Thus, the agonist EQ (ng-agonist-EQ/L) and the antagonist EQ (ng-antagonist-EQ/L) were determined as EC20(agonist)/EC20(extract), and IC20(antagonist)/IC20(extract), respectively.
In addition, the limits of detection (LOD) for agonist and antagonist EQs of each GPCR were determined by dividing EC20(agonist) and IC20(antagonist) with the highest sample extract REF in the TGFα shedding assay.
In this section, secondary effluent samples from WWTPs were used to perform quantitative chemical analysis and to compare the analysis of the TGFα shedding assay. Prior to the chemical analysis and assay, the aforementioned SPE treatment was applied for the extraction of samples. Recovery rates of GPCR targeted pharmaceuticals for AT1 (valsartan, irbesartan, and losartan), D2 (sulpiride), M1 (pirenzepine), β1 (propranolol, atenolol, and metoprolol), and H1 (diphenhydramine) receptor in wastewater samples for quantitative chemical analysis were conducted by spiking tests in our laboratories. Concentrations of these GPCR targeted pharmaceuticals in wastewater samples were determined by LC–MS/MS analysis and were calculated by the corresponding GPCR targeted pharmaceutical recoveries in the spiking tests. Concentrations of the pharmaceuticals for each receptor were used to calculate the predicted antagonistic pharmaceutical activities (see next section).
Pharmaceuticals are presented in wastewater as mixtures, and we have previously confirmed that GPCR targeted pharmaceuticals with the same mode of action behave additively in the TGFα shedding assay [34]. Therefore, the concentration addition model was applied to calculate predicted antagonistic activities in wastewater. In each receptor, predicted antagonistic activity of GPCR targeted pharmaceuticals was quantified as an antagonist EQ relative to a reference pharmaceutical, e.g., activities of AT1 antagonistic pharmaceuticals were quantified as ng-valsartan-EQ/L. First, concentrations of known pharmaceuticals were converted to molar concentrations (nmol/L). Second, the predicted molar antagonistic EQs were calculated based on the concentration addition model as follows:
Predicted antagonistic EQ = C × RP
Where C is the GPCR targeted pharmaceutical molar concentrations (nmol/L) in wastewater, RP is the relative potency value (–) of GPCR targeted pharmaceuticals to the reference GPCR targeted pharmaceuticals, which was determined as RP = IC50(ref. pharmaceuticals)/IC50(antagonist) (Table S2). The reference GPCR targeted pharmaceuticals for AT1, D2, M1, β1, and H1 receptors were valsartan, sulpiride, pirenzepine, propranolol, and diphenhydramine, respectively.
The molar concentration of predicted antagonist EQs were converted to predicted mass antagonist EQs (ng-antagonist-EQ/L) based on the molecular weight of corresponding reference GPCR targeted pharmaceutical. The measured antagonist EQs by the TGFα shedding assay were compared with predicted antagonist EQs to evaluate the contribution of the known pharmaceuticals to the antagonistic activities for AT1, D2, M1, β1 and H1 receptors, from the quantitative chemical perspective.
Agonistic pharmaceutical activities were only detected against D2 receptors in the effluent of WWTP2 (Sample ID2) (D2 of Fig. S2 in Supporting information), which was quantified as 31 ng-dopamine-EQ/L for the D2 receptor (Table 1 and Fig. S3 in Supporting information). Agonistic activities were below LOD (Table 1, Table S3 in Supporting information, parenthesis) against other GPCRs (i.e., AT1, M1, β1, and H1) in other extracts.
|
|
Table 1 Summary of agonistic and antagonistic activities of wastewater extracts for AT1 and D2 receptors. |
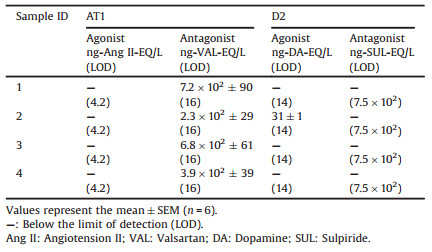
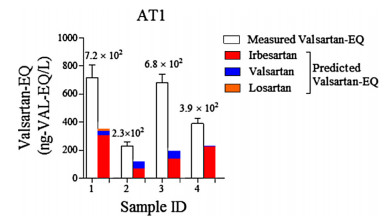
On the other hand, antagonistic pharmaceutical activities against AT1 receptor were detected in all extracts (AT1 in Figs. S2 and S4 in Supporting information). The linear concentration-response curves were used to quantify the antagonistic activities of wastewater extracts. For AT1 receptor, the valsartan EQs of wastewater extracts were between 2.3 × 10²-7.2 × 10² ng-valsartan-EQ/L (Fig. 1 and Table 1). The different AT1 antagonistic activities among these four WWTPs might due to different consumption of hypertension pharmaceuticals by hypertension patients for each WWTP. Antagonistic pharmaceutical activities against D2, M1, β1, and H1 receptors were below LOD for all the extracts (Table 1 and Table S3, parenthesis). One reason could be the non-GPCR mediated response masked antagonistic activities in wastewater extracts in the TGFα shedding assay. Another could be the low consumption of pharmaceuticals to act on D2, M1, β1, and H1 receptors in the studied area. And it is plausible that lower consumption will lead to low activities in wastewater.

|
Download:
|
| Fig. 1. Measured and predicted AT1 antagonistic activities of wastewater extracts. Bars represent mean ± SEM, n = 6. | |
To the best of our knowledge, pharmaceutical activities of GPCR targeted pharmaceuticals were only measured in developed countries, i.e., England and Japan [29, 30]. The consumption of GPCR targeted pharmaceuticals are probably different between developed countries (e.g., UK and Japan) and developing countries (e.g., China). This probably leads to different activities in different countries. Antagonistic pharmaceutical activities against AT1 receptor in wastewater in China (2.3 × 10²–7.2 × 10² ng-valsartan-EQ/L) were stronger than those in England (22–1.9 × 10² ng-valsartan-EQ/L), and comparable with those in Japan (3.5 × 10²–4.0 × 10² ng-valsartan-EQ/L). Antagonistic activities against β1 receptor were below LOD (28 ng-propranolol-EQ/L) in China, and this LOD value for β1 receptor was lower than measured activities in England (40–62 ng-propranolol-EQ/L) and Japan (38–56 ng-propranolol-EQ/L). Similarly, antagonistic activities against H1 receptor were below LOD (7.0 × 10² ng-diphenhydramine-EQ/L) in China, which were lower than measured H1-receptor activities in England (8.1 × 10²–2.0 × 10³ ng-diphenhydramine-EQ/L) and Japan (4.1 × 10³–5.8 × 10³ ng-diphenhydramine-EQ/L). These indicate that the antagonistic pharmaceutical activities against β1 and H1 receptors in the studied area of China were probably lower than those in England and Japan, which could reveal the differences of disease epidemiology among countries (as prevalence can vary between countries).
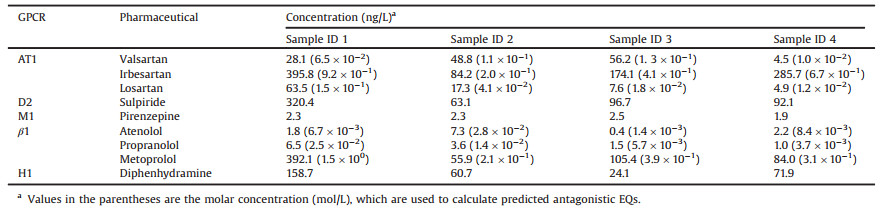
Concentrations of GPCR targeted pharmaceuticals in wastewater effluent were measured by LC–MS/MS. All the pharmaceuticals were detected in each sample, and concentrations were shown in Table 2. Concentrations of irbesartan (84.2–395.8 ng/L), sulpiride (63.1–320.4 ng/L), metoprolol (55.9–392.1 ng/L) and diphenhydramine (24.1–158.7 ng/L) varied from tens to hundreds ng/L level. Concentrations of these pharmaceuticals were up to hundreds ng/L, and it might due to high consumption in the studied area or low removal rate during treatment processes. Concentrations of valsartan (4.5–56.2 ng/L) and losartan (4.9–63.5 ng/L) varied between several to hundred ng/L. Concentrations of pirenzepine (1.9–2.5 ng/L), atenolol (0.4–7.3 ng/L) and propranolol (1.0–6.5 ng/L) were below 10 ng/L in all the samples. We applied these pharmaceutical concentrations to calculate the predicted antagonistic EQs, and to examine the contribution of these known pharmaceuticals by chemical quantity to the measured activities from the TGFα shedding assay.
|
|
Table 2 Concentrations of GPCR targeted pharmaceuticals in secondary effluent of WWTPs. |
For AT1 receptor, predicted valsartan-EQs of samples ID1—4 were calculated based on the molar concentrations (Table 2, parenthesis) of valsartan, irbesartan, and losartan by chemical analysis and their relative potency values to valsartan (RP in Table S2), according to the concentration addition model. Then the predicted valsartan-EQs were compared with the measured valsartan-EQs from the TGFα shedding assay. The predicted valsartan-EQs from irbesartan were higher than those of valsartan and losartan (Fig. 1, red bars). However, the predicted valsartan-EQs from these three AT1 antagonists still can not explain the majority of measured activities from the TGFα shedding assay (Fig. 1). These results indicated that besides valsartan, irbesartan and losartan, other AT1 antagonists (e.g., eprosartan [38], and telmisartan [39]) exist in wastewater.
Similarly, for β1 receptor, molar concentrations (Table 2, parenthesis) of atenolol, metoprolol and propranolol and their potency values relative to propranolol (RP in Table S2) were applied for the calculation of the predicted propranolol-EQs. For sample ID1, the predicted propranolol-EQ was 55 ng-propranolol-EQ/L. However, the measured β1 antagonistic activity of sample ID1 was below LOD (28 ng-propranolol-EQ/L) in the TGFα shedding assay. This might be due to the competition between β1 receptor targeted agonists and antagonists in sample ID1. In the previous study, higher predicted propranolol-EQs by chemical quantity were reported than measured propranolol-EQs from the TGFα shedding assay [30]. For endocrine-disrupting chemicals in wastewater, estrogenic and anti-estrogenic compounds can compete for estrogen receptor, leading to the lower observed estrogenic activity from bioassay than the predicted activity from chemical quantity [40]. For samples ID 2—4, the predicted propranolol-EQs were 10, 14, 11 ng-propranolol-EQ/L, respectively. The predicted propranolol-EQs were lower than LOD (28 ng-propranolol-EQ/L) in the TGFα shedding assay, which agreed well with the measured activity.
For D2, M1 and H1 receptors, although concentrations of sulpiride (63.1—320.4ng/L), pirenzepine(1.9—2.5ng/L), and diphenhydramine (24.1—158.7ng/L) in samples ID1—4 were detected by chemical analysis at up to hundreds ng/L, antagonistic activities for these GPCRs were still below LODs in the TGFα shedding assay. The reason is LOD values of D2 (7.5 × 10² ng-sulpiride-EQ/L), M1 (1.2 × 10² ng-pirenzepine-EQ/L) and H1 (7.0 × 10² ng-diphenhydramine-EQ/L) receptors for the assay were higher than the actual antagonistic activities of GPCR targeted pharmaceuticals in wastewater. In fact, in this study, the LOD values for receptors (AT1, D2, M1, β1 and H1)in the TGFα shedding assay were higher than those LODs in previous studies [29, 30]. Because some compounds in wastewater extracts trigger the non-GPCR mediated response in the mock condition experiments in this study (Fig. S1), this leads to smaller REF values used in the assay in this study than those in previous studies, and hence, the LOD values in this study were higher.
So far, very limited studies have reported concentrations of AT1 antagonists inwastewater in China [38, 39, 41, 42]. On the DrugBank online database [43], some otherAT1 antagonists (e.g., candesartan cilexetil, eprosartan, telmisartan, and olmesartan medoxomil) were approved on the market. Telmisartan was detected at 273 ± 37.9 ng/L in the effluent of WWTPs in Beijing, China [39]. These AT1 antagonists probably contribute to antagonistic activities against AT1 receptor. On the other hand, some D2 agonistic pharmaceuticals (e.g., levodopa and amantadine) were approved for the treatment of Parkinson's disease [43]. The D2 agonistic activity in wastewater in China is probably attributed to these D2 agonistic pharmaceuticals. Based on the England and Japan database, levodopa and amantadine were available on the market [44, 45]. These D2 agonists might be approved in China and responsible for D2 agonistic activities in wastewater in China. Future studies will be carried out to investigate which pharmaceuticals are responsible for AT1 antagonistic activity or D2 agonistic activity in wastewater in China.
In this study, we firstly evaluated the pharmaceutical activities of GPCR targeted pharmaceuticals, responding 5 GPCRs in Chinese wastewater by the TGFα shedding assay, as well as GPCR targeted pharmaceutical concentrations by quantitative chemical analysis in parallel. The main conclusions are summarized below:
(1) Antagonistic activities against AT1 receptor were firstly detected at up to 7.2 × 10² ng-valsartan-EQ/L in wastewater in China. Antagonistic activities against D2, M1, β1, and H1 receptors were below limit of detection in wastewater in China.
(2) Agonistic activity against D2 receptor was firstly evaluated in Chinese wastewater at the concentration of 31 ng-dopamine-EQ/L.
(3) Concentrations valsartan, irbesartan, and losartan are not enough to explain the measured AT1 antagonistic activities in wastewater in China. Other AT1 receptor targeted pharmaceuticals probably exist in wastewater.
Declaration of competing interestThe authors report no declarations of interest.
AcknowledgmentsThe Fundamental Research Funds for the Central Universities, Japan Society for the Promotion of science (JSPS) for Grant-in-Aid for Scientific Research (B) (No. 17H01907), Keihanshin Consortium for Fostering the Next Generation of Global Leaders in Research (No. K-CONNEX), established by Human Resource Development Program for Science and Technology, MEXTare highly appreciated, and we also thank financial support from the National Natural Science Foundation of China (No. 21806082), Key Technologies R & D Program of Tianjin (Nos. 18YFZCNC01410, 16YFZCSF00410).
Appendix A. Supplementary dataSupplementary material related to thisarticle can be found, in the online version, at doi:https://doi.org/10.1016/j.cclet.2020.08.040.
| [1] |
C.G. Daughton, T.A. Ternes, Environ. Health. Persp. 107 (1999) 907-938. DOI:10.1289/ehp.99107s6907 |
| [2] |
N. Nakada, K. Komori, Y. Suzuki, et al., Water Sci. Technol. 56 (2007) 133-140. |
| [3] |
A. Ziylan, N.H. Ince, J. Hazard. Mater. 187 (2011) 24-36. DOI:10.1016/j.jhazmat.2011.01.057 |
| [4] |
Y. Cabeza, L. Candela, D. Ronen, G. Teijon, J. Hazard. Mater. 239 (2012) 32-39. |
| [5] |
Q.W. Bu, B. Wang, J. Huang, S.B. Deng, G. Yu, J. Hazard. Mater. 262 (2013) 189-211. DOI:10.1016/j.jhazmat.2013.08.040 |
| [6] |
M. Petrovic, B. Skrbic, J. Zivancev, L. Ferrando-Climent, D. Barcelo, Sci. Total Environ. 468 (2014) 415-428. |
| [7] |
R.H. Lindberg, M. Ostman, U. Olofsson, R. Grabic, J. Fick, Water Res. 58 (2014) 221-229. DOI:10.1016/j.watres.2014.03.076 |
| [8] |
B. Petrie, R. Barden, B. Kasprzyk-Hordern, Water Res. 72 (2015) 3-27. DOI:10.1016/j.watres.2014.08.053 |
| [9] |
N. Nakada, S. Hanamoto, M.D. Jurgens, et al., Sci. Total Environ. 575 (2017) 1100-1108. DOI:10.1016/j.scitotenv.2016.09.180 |
| [10] |
R.X. Ma, B. Wang, L.N. Yin, et al., J. Hazard. Mater. 323 (2017) 147-155. DOI:10.1016/j.jhazmat.2016.05.030 |
| [11] |
X.B. Mei, Q. Sui, S.G. Lyu, D. Wang, W.T. Zhao, J. Hazard. Mater. 359 (2018) 429-436. DOI:10.1016/j.jhazmat.2018.07.081 |
| [12] |
K. Howe, M.D. Clark, C.F. Torroja, et al., Nature 496 (2013) 498-503. DOI:10.1038/nature12111 |
| [13] |
C.A. MacRae, R.T. Peterson, Nat. Rev. Drug Discov. 14 (2015) 721-731. DOI:10.1038/nrd4627 |
| [14] |
M. Rask-Andersen, M.S. Almen, H.B. Schioth, Nat. Rev. Drug Discov. 10 (2011) 579-590. DOI:10.1038/nrd3478 |
| [15] |
K. Sriram, P.A. Insel, Mol. Pharmacol. 93 (2018) 251-258. DOI:10.1124/mol.117.111062 |
| [16] |
A. Bayer, R. Asner, W. Schussler, et al., Environ. Sci. Pollut.Res. 21 (2014) 10830-10839. DOI:10.1007/s11356-014-3060-z |
| [17] |
U. Schwabe, D Paffrath, Pharmaceutical Prescription, Springer, Berlin (2012). |
| [18] |
B. Kasprzyk-Hordern, R.M. Dinsdale, A.J. Guwy, Water Res. 43 (2009) 363-380. DOI:10.1016/j.watres.2008.10.047 |
| [19] |
Van de Steene J.C., C.P. Stove, W.E. Lambert, Sci. Total Environ. 408 (2010) 3448-3453. DOI:10.1016/j.scitotenv.2010.04.037 |
| [20] |
M. Huerta-Fontela, M.T. Galceran, F. Ventura, Water Res. 45 (2011) 1432-1442. DOI:10.1016/j.watres.2010.10.036 |
| [21] |
S.L. Yuan, X.M. Jiang, X.H. Xia, H.X. Zhang, S.K. Zheng, Chemosphere 90 (2013) 2520-2525. DOI:10.1016/j.chemosphere.2012.10.089 |
| [22] |
R. Loos, R. Carvalho, D.C. Antonio, et al., Water Res. 47 (2013) 6475-6487. DOI:10.1016/j.watres.2013.08.024 |
| [23] |
R. Gurke, M. Rossler, C. Marx, et al., Sci. Total Environ. 532 (2015) 762-770. DOI:10.1016/j.scitotenv.2015.06.067 |
| [24] |
A.F. Bollmann, W. Seitz, C. Prasse, et al., J. Hazard. Mater. 320 (2016) 204-215. DOI:10.1016/j.jhazmat.2016.08.022 |
| [25] |
L.A. Kristofco, B.W. Brooks, Sci. Total Environ. 592 (2017) 477-487. DOI:10.1016/j.scitotenv.2017.03.120 |
| [26] |
E.E. Burns, L.J. Carter, D.W. Kolpin, J. Thomas-Oates, A.B.A. Boxall, Water Res. 137 (2018) 72-85. DOI:10.1016/j.watres.2018.02.066 |
| [27] |
G.A. Burton, Integr. Environ. Assess. Manag. 13 (2017) 568-572. DOI:10.1002/ieam.1929 |
| [28] |
A. Inoue, J. Ishiguro, H. Kitamura, et al., Nat. Methods 9 (2012) 1021-1029. DOI:10.1038/nmeth.2172 |
| [29] |
M. Ihara, A. Inoue, S. Hanamoto, et al., Environ. Sci. Technol. 49 (2015) 1903-1911. DOI:10.1021/es505349s |
| [30] |
H. Zhang, M. Ihara, S. Hanamoto, et al., Environ. Sci. Technol. 52 (2018) 11848-11856. |
| [31] |
M. Zhang, Y.J. Shi, Y.L. Lu, et al., Sci. Total Environ. 590 (2017) 633-642. |
| [32] |
J.L. Liu, M.H. Wong, Environ. Int. 59 (2013) 208-224. DOI:10.1016/j.envint.2013.06.012 |
| [33] |
M. Ihara, S. Hanamoto, M.O. Ihara, et al., J. Appl. Toxicol. 40 (2020) 908-917. DOI:10.1002/jat.3952 |
| [34] |
H. Zhang, M.O. Ihara, N. Nakada, H. Tanaka, M. Ihara, Environ. Sci. Technol. 54 (2020) 1720-1729. DOI:10.1021/acs.est.9b05768 |
| [35] |
P.A. Neale, S. Ait-Aissa, W. Brack, et al., Environ. Sci. Technol. 49 (2015) 14614-14624. DOI:10.1021/acs.est.5b04083 |
| [36] |
P.A. Neale, N.A. Munz, S. Ait-Aissa, et al., Sci. TotalEnviron. 576 (2017) 785-795. |
| [37] |
B.I. Escher, P.A. Neale, D.L. Villeneuve, Environ. Toxicol. Chem. 37 (2018) 2273-2280. DOI:10.1002/etc.4178 |
| [38] |
Y.S. Chen, S. Yu, Y.W. Hong, Q.Y. Lin, H.B. Li, Environ. Sci. Pollut. Res. 20 (2013) 8391-8403. DOI:10.1007/s11356-013-1871-y |
| [39] |
Y. Zhang, L. Duan, B. Wang, et al., Environ. Pollut 261 (2020) 114113. DOI:10.1016/j.envpol.2020.114113 |
| [40] |
M. Ihara, M.O. Ihara, V. Kumar, et al., Environ. Sci. Technol. 48 (2014) 6366-6373. DOI:10.1021/es5014938 |
| [41] |
H. Huang, J. Wu, J. Ye, et al., Front. Environ. Sci. Eng 12 (2018) 7. |
| [42] |
M.A. Asghar, Q. Zhu, S. Sun, Q. Shuai, Sci. Total Environ. 635 (2018) 828-837. DOI:10.1016/j.scitotenv.2018.04.179 |
| [43] |
DrugBank Website, (2020). Accessed 29 June http://www.drugbank.ca.
|
| [44] |
NHS digital website, Prescription Cost Analysis-England, (2017). Accessed 29 June 2020 https://digital.nhs.uk/data-and-information/publications/statistical/prescription-cost-analysis/prescription-cost-analysis-england-2017.
|
| [45] |
Japan Ministry of Health, Labour, and Welfare Website. 3rd NDB Open Data Accessed 29 June 2020, https://www.mhlw.go.jp/stf/seisakunitsuite/bunya/0000177221_00002.html.
|