 2020, Vol. 31


b Center of Materials Science and Optoelectronics Engineering, University of Chinese Academy of Sciences, Beijing 100049, China;
c School of Material Science and Engineering, University of Shanghai for Science and Technology, Shanghai 200093, China
Mercury (Hg) is an extremely high toxicity element, and Hg pollution has become a global environmental problem that has caused great damage to human health [1-4]. It has been reported that long-term consumption of foods contaminated with Hg could cause various neurodegenerative diseases such as amyotrophic lateral sclerosis, Alzheimer's disease, Parkinson's disease, and even death [5, 6]. The WHO guidelines state that the health limit for Hg in drinking water is 1 μg/L [7, 8]. Therefore, it is extremely important to quantify the Hg content in food and related environmental samples due to the significant toxicity and biomagnification factors of Hg (up to 106) [8].
At present, there are various large and mature instruments on the market for the determination of Hg, such as atomic absorption spectrometry (AAS), atomic fluorescence spectrometry (AFS), inductively coupled plasma atomic emission spectrometry (ICP-AES), inductively coupled plasma mass spectrometry (ICP-MS), etc. These instruments have a series of advantages such as high accuracy and multi-element analysis. However, these instruments are usually cumbersome, expensive, high power consumption, and typically used in the laboratory. Thus, the development of inexpensive but reliable miniaturized instruments has aroused great interest.
Currently, miniaturized plasma technology has been rapidly developed and applied, due to its small size, low gas, low cost, and low power consumption. For instance, but not limited to, electrolyte cathode glow discharge (ELCAD) [9, 10], solution cathode glow discharge (SCGD) [11, 12], atmospheric pressure glow discharge (APGD) [13, 14], dielectric barrier discharge (DBD) [15, 16]. Nevertheless, these methods have low sensitivity for the detection of Hg2+. Recently, Pohl and Zhu et al. [17-23] presented a successful use of solution anode glow discharge (SAGD) as an efficient excitation source for trace element analysis by AES/AFS, and the sensitivity of some elements was incomparably better than that of SCGD, APGD and DBD. In particular, the (DL) of Hg2+ can reach 0.163 μg/L when helium was introduced from the cathode tube (with cooling device) of SAGD [21]. However, the direct introduction of sample solutions into these miniaturized microplasmas often results in high matrix interference and low transfer efficiency [21, 24]. Accordingly, chemical vapor generation is a widely used sample introduction method in spectral analysis, because it can effectively separate the analyte from the condensed phase, and produce efficient on-line matrix separation, high transmission efficiency and selectivity. In order to achieve high sensitive determination performance for elements, different chemical vapor generation (CVG) techniques are coupled to the above mentioned radiation sources, such as CVG-APGD-AES [25, 26], HG-APGD-AES [27, 28], HG-SCGD-AES [29], PVG (photochemical vapor generation)-SCGD-AES [24], which can be used for high sensitivity detection of As, Hg, Pb, Se and Sb. In addition, due to the main excitation region (negative glow region) of the element is close to the cathode, the analyte had a higher emission intensity when introduced from the cathode [30]. Therefore, the target element was transferred to the cathode end of the glow discharge by HG, which not only further increased the emission line of the element, but also reduced the matrix interference of SAGD-AES during sample analysis [21].
Hence, here we described an innovative HG-SAGD-AES combination technology, which has the advantages of small, low cost and ultrasensitive determination for Hg2+. In addition, the precision, accuracy, linear range, and DL of Hg2+ were also determined after the SAGD and HG system parameters were comprehensively optimized. Moreover, the accuracy of the developed HG-SAGD-AES was demonstrated by analysis of certified reference materials (CRMs).
The schematic diagram of HG-SAGD-AES is shown in Fig. 1. It consists of HG unit for sample introduction, SAGD source for Hg2+ excitation and a low-resolution compact microspectrometer for detection. For the HG device (Agilent HG Accessory 77), the sample, acid carrier and sodium borohydride solution were transferred to the gas-liquid separator via a peristaltic pump. A tungsten tube (i. d. = 2 mm, o.d. = 4 mm) was used as the cathode of the SAGD excitation source, and the electrolyte acid was transported through a quartz tube (i.d. = 2 mm, o.d. = 4 mm) to the excitation region of SAGD at a certain flow rate using a peristaltic pump (BT100-1 L, Baoding Langer Constant Flow Pump Co., Ltd., China). The graphite electrode (length 50 mm, diameter = 10 mm) passed horizontally through the waste cell wall, the quartz tube passed vertically through the graphite electrode and the bottom of the waste cell, and the quartz tube was 2 mm above the graphite rod. In order to adjust the distance between the tungsten tube and the quartz tube, the tungsten tube electrode was fixed on the three-dimensional platform with an accuracy of 2 μm in the X, Y and Z directions (APFP-XYZ, Zolix Instruments Co., Ltd., China). The high voltage power supply (HSPY-600, Beijing Hansheng Puyuan Technology Co., Ltd., China) was used in constant current mode, and a 10 kΩ resistor was connected in the whole loop.

|
Download:
|
| Fig. 1. Schematic diagram of the HG-SAGD-AES system. | |
A portable charge coupled device (CCD) spectrometer (Maya 2000 Pro, Ocean Optical Instruments Co., Ltd., U. S. A.) with a groove density of 1200 line mm-1, an entrance slit width of 25 mm, a resolution of 0.35 nm, and a detection spectrum range of 190-409 nm. Adjust the position of the microplasma, lens, and fiber probe to ensure that the emission spectra produced by SAGD were all collected and focused into the entrance slit.
The detailed experimental reagents as well as samples are given in Text S1 (Supporting information). A sample of fish meat GBW10029 (0.1 g) was placed in a 30 mL polytetrafluoroethylene (PTFE) digestion vessel and dissolved in a mixture of HNO3 (5 mL) and H2O (1 mL). Subsequently, PTFE digestion vessel was placed in a stainless steel container and heated to 100 ℃ in a thermostatic oven for 10 h. The process blank was prepared and similarly processed. Finally, the acidic sample was placed on a hot plate, heated to near dryness at 80 ℃, and diluted to a volume of 20 mL. The human hair sample GBW09101b (0.05 g) and rice sample (0.05 g) digestion process were consistent with the fish digestion step, and finally diluted to a volume of 10 mL. A 0.2 g soil sample was weighed into PTFE digestion vessel, and HF (10 mL) and HClO4 (2 mL) were added to a PTFE sealed digestion vessel, and heated in a constant temperature oven at 230 ℃ for 10 h. Subsequently, the sample was placed on a hot plate, heated to near dry state at 80 ℃, and diluted to a volume of 20 mL. Blank samples were processed as well. All samples were prepared in triplicate.
The sample, carrier acid, and reducing agent were transferred to the gas-liquid separator by a peristaltic pump in the hydride generating zone. When a direct-current voltage was applied to the SAGD electrode, the tungsten tube was in direct contact with the overflowing electrolyte (1 mol/L HNO3) of the quartz tube, and a stable plasma was formed. Then, the discharge distance between the tungsten tube and the quartz tube was adjusted to an appropriate distance, and the introduced carrier gas (He) transported the hydride to the SAGD discharge generation area for excitation. The optical radiation signal generated by the HG-SAGD was focused by a plano-convex lens, and the optical fiber probe coupled the focused optical radiation signal to the entrance slit of the spectrometer for detection and amplification. The results were processed and recorded using the SpectraSuite software of the computer. Each sample used an average of 11 spectra with an integration time of 300 ms. Detection limit was defined as DL = 3SD × k-1, where SD is the standard deviation (n = 11) of the blank samples (deionized water acidified with HNO3) and k is the slope of the calibration curve. The direct mercury analyzer (Milletone DMA-80, Italy) was used to analyze the actual rice and soil to verify the reliability of the HG-SAGD-AES.
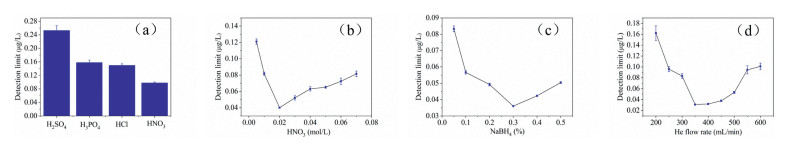
The HG system was used as the sample introduction device of SAGD, and the amount of hydride and H2 generated from HG directly determined the sensitivity of the corresponding element. To ensure high sensitivity of element detection, the operating parameters (type and concentration of carrier acid, He flow rate and NaBH4 concentration) of the HG connected to the SAGD were optimized. The effects of HG experimental conditions on analyte response are shown in Fig. 2. The four acid carriers of HCl, H3PO4, H2SO4 and HNO3 were selected to investigate the effects on the DL of Hg2+ (253.7 nm). As shown in Fig. 2a, the DL of Hg2+ was lowest with HNO3 as the carrier acid. Therefore, HNO3 was employed as the carrying solution in subsequent experiments.

|
Download:
|
| Fig. 2. Effects of (a) acid type (HCl, H3PO4, H2SO4, HNO3 = 0.1 mol/L, NaBH4 = 0.3 wt%, He flow rate = 350 mL/min, discharge current = 40 mA, discharge gap = 3 mm, solution flow rate = 3.5 mL/min), (b) HNO3 concentration (NaBH4 = 0.3 wt%, He flow rate = 350 mL/min, discharge current = 40 mA, discharge gap = 3 mm, solution flow rate = 3.5 mL/min), (c) Concentration of NaBH4 (HNO3 = 0.02 mol/L, He flow rate = 350 mL/min, discharge current = 40 mA, discharge gap = 3 mm, solution flow rate = 3.5 mL/min), (d) He flow rate (HNO3 = 0.02 mol/L, NaBH4 = 0.3 wt%, discharge current = 40 mA, discharge gap = 3 mm, solution flow rate = 3.5 mL/min) on Hg2+ DL. | |
Figs. 2b and c reveal that the effects of the concentration of HNO3 and NaBH4 on the DL of Hg2+. When the concentration of NaBH4 was < 0.05 wt%, the emission of NO was significantly increased due to the small amount of H2 cogenerated and introduced to SAGD, thereby interfering with elemental detection, and when the concentration of NaBH4 was > 0.5 wt%, an excessive amount of H2 was generated, thereby weakening the intensity of the Hg emission line [27]. In addition, when the HNO3 concentration was low, the Hg element cannot be absolutely translated to a hydride, resulting in the weakened signal intensity. On the other hand, with the increase of reduced hydrogen in hydride gas, the target hydride was diluted, which will also lead to the increase of detection limit of Hg2+. Therefore, the effects of NaBH4 and HNO3 concentrations of 0.05-0.5 wt% and 0.005-0.08 mol/L on the DL of Hg2+ were studied. When the concentrations of NaBH4 and HNO3 were 0.3 wt% and 0.02 mol/L, respectively, a lowest DL of Hg2+ was obtained.
Preliminary experiments showed that the use of He as carrier gas could minimize most of the background spectral emission, thus obtaining more analytical spectral lines available for analyte elements with less background interference. Thus, He was selected as the carrier gas for all subsequent experiments. He was also employed as a carrier gas to separate volatile analytes from the liquid phase and transported them to SAGD. Therefore, the excitation ability of SAGD, the gas-liquid separation efficiency, and the concentration of the analyte were greatly affected by the He flow rate. The effects of the He flow rate on the analyte response are shown in Fig. 2d. It showed that the DL of Hg2+ was the lowest when the He flow rate was 350 mL/min. This was because the low He flow rate reduced the efficiency of analyte separation from the liquid phase and the excitation ability of SAGD, while the high flow rate diluted the analyte concentration and increased the instability of the emission line. Thus, Hg2+ was measured at a He flow rate of 350 mL/min and utilized in all subsequent experiments.
In order to improve the analytical performance of the HG-SAGD-AES, the operating parameters (discharge gap, discharge current, solution flow rate) of SAGD were optimized in detail.
The excitation ability of microplasma was directly related to the discharge current. As shown in Fig. 3a, the influence of discharge current on the DL of Hg2+ was studied, ranging from 20 mA to 60 mA. At the discharge current < 20 mA, SAGD plasma was unstable and even quenched. When the discharge current increased from 20 mA to 40 mA, the DL of Hg2+ decreased. But when the discharge current was 40-60 mA, the higher saturation of the discharge phase deteriorated the excitation conditions together with the water vapor, and the DL of Hg2+ increased gradually [21]. While when the discharge current > 60 mA, it caused overheating and sputtering of cathode materials, which may shorten the service life of SAGD system. Therefore, the discharge current of 40 mA was utilized in the subsequent study.

|
Download:
|
| Fig. 3. Effects of (a) discharge current (HNO3 = 0.02 mol/L, He flow rate = 350 mL/min, NaBH4 = 0.3 wt%, discharge gap = 3 mm, solution flow rate = 3.5 mL/min); (b) Discharge gap (HNO3 = 0.02 mol/L, NaBH4 = 0.3 wt%, discharge current = 40 mA, He flow rate = 350 mL/min, solution flow rate = 3.5 mL/min); (c) Solution flow rate (HNO3 = 0.02 mol/L, NaBH4 = 0.3 wt%, discharge current = 40 mA, He flow rate = 350 mL/min, discharge gap = 3 mm) on DL of Hg2+. | |
The discharge distance had significant effect on the intensity and stability of analyte signal. As can be seen from Fig. 3b, with the increase of discharge distance from 2 mm to 3 mm, an apparent increase of Hg (253.7 nm) line intensity resulted in lower DL for Hg2+ in SAGD-AES. A further discharge distance increases to values above 3 mm led to a slight increase of the DL of Hg2+. Moreover, it should be noted that a further increase of discharge distance to 5 mm or more resulted in a rapid elevation of plasma volatility and reduction of emission intensity, which led to a rapid increase of DL for Hg2+ in SAGD-AES. As the discharge distance increased, more NO and N2 enter the plasma, and the excitation of these diatomic molecules and elements was a competitive process, resulting in a higher DL of the element. Besides, more water evaporated to quench the excited state of the analyte [21]. On the basis of these results, the discharge distance of 3 mm was selected for all subsequent experiments.
In this experiment, 1 mol/L HNO3 was utilized as the electrolyte solution. When the solution flow rate was < 2.0 mL/min, the solution overflow was discontinuous and resulting in destabilization of the discharge. As shown in Fig. 3c, it was found that when the solution flow rate increased from 2.0 mL/min to 3.5 mL/min, the DL of Hg2+ decreased, which due to the increase in conductivity [29]. However, when the solution flow rate was > 3.5 mL/min, the plasma became unstable and the DL of Hg2+ increased. In all subsequent experiments the solution flow rate of 3.5 mL/min was selected.
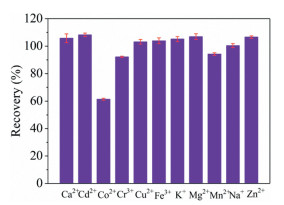
As shown in Fig. 4, to evaluate the susceptibility of HG-SAGD-AES to matrix-induced interference, the recovery of Hg2+ was determined in the presence of Ca2+, Cd2+, Co2+, Cr3+, Cu2+, Fe3+, K+, Mg2+, Mn2+, Na+ and Zn2+. These potential interfering ions were added to the single element standard solution (5 μg/L) of Hg2+ at a concentration of 1 mg/L. The recovery of Hg2+ was between 90% and 110% for most interfering ions, while the recovery of Hg2+ was 61% for Co2+. The cause and mechanism of Co interference are not fully understood. However, when the concentration of Co2+ was 200 μg/L, the recovery of Hg2+ (5 μg/L Hg2+) was 92%. Therefore, the method developed in this experiment was not affected by the existence of these foreign ions to a certain extent.

|
Download:
|
| Fig. 4. Effect of the foreign ions (Ca2+, Cd2+, Co2+, Cr3+, Cu2+, Fe3+, K+, Mg2+, Mn2+, Na+ and Zn2+, all at a concentration of 1 mg/L) on the intensities of the atomic emission lines of Hg (expressed as the recovery percent) acquired for the HG-SAGD-AES. | |
The analytical performance of HG-SAGD-AES was evaluated under the optimized operating parameters (HNO3 = 0.02 mol/L, He flow rate of 350 mL/min, NaBH4 = 0.3 wt%, discharge current of 40 mA, discharge gap of 3 mm). The Hg2+ concentration ranged from 0.1 μg/L to 10 μg/L, and the calibration curve had an excellent linear correlation coefficient (R2 > 0.999) (Fig. S1 in Supporting information). As shown in Table 1, the DL of Hg2+ reached 0.03 μg/L, while the relative standard deviation (RSD) obtained for 5 μg/L Hg2+ was 1.1%. Table 1 compares the DL of Hg2+ of the HG-SAGD-AES technique with other methods. The DL of Hg2+ obtained using the HG-SAGD-AES approach was 2500–3000 times lower than that obtained via SCGD-OES [12], and CLEP-OES [35]. Moreover, the DL of Hg2+ obtained using the HG-SAGD-AES approach was 2–80 times lower than that of SAGD-OES [18, 21], CVG-mAPGD-OES [26], HG-HEPD-OES [31], and PVG-SCGD-AES [24]. Although not as good as HG-AFS [32] or HPLC-CVAFS [33], this method is currently the most optimized result of miniaturized microplasma detection of Hg2+. Notably, the proposed HG-SAGD-AES method not only retains the advantages of miniaturized plasma, such as simplicity, compactness, low power consumption, but also significantly improves sensitivity and stability.
|
|
Table 1 Comparison of DL of Hg2+ obtained with different analytical methods. |

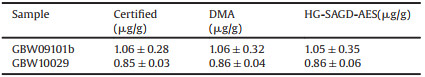
In order to verify the accuracy of the HG-SAGD-AES method, GBW09101b (human hair) and GBW10029 (fish) were determined by standard curve method. The results obtained (Table 2) agreed well with the certified reference values. The actual rice and soil samples were analyzed to verify the feasibility of the method. The results in Table 3 showed that the results obtained by the proposed HG-SAGD-AES technique were in good agreement with the values obtained by using the DMA method and the reference values.
|
|
Table 2 Determination of Hg concentration in CRMs. |
|
|
Table 3 Determination of Hg concentration in different samples. |

In summary, the HG-SAGD-AES proposed in present work was found to allow the determination of Hg2+ with excellent sensitivity, precision, and low interference from the matrix, in addition to providing the advantages of low power consumption and low gas consumption. However, only the research on the determination of Hg2+ by HG-SAGD-AES was performed and the systematic sensitization mechanism for Hg in SAGD is still not fully understood, which needs further research and exploration. Therefore, future work will focus on the systematic sensitization mechanism research of the SAGD developed in present work. Besides, expanding the elemental analysis range of the developed technique and its application in analyzing the valence states of elements will be expected. In addition, coupling of the SAGD with other vapor generation methods (e.g., photochemical vapor generation or electrothermal evaporation) will also be considered.
Declaration of competing interestThe authors declare that they have no known competing financial interests or personal relationships that could have appeared to influence the work reported in this paper.
AcknowledgmentsThis work was supported by the Instrument Development Project of the Chinese Academy of Sciences (No. YZ201539), the National Natural Science Foundation of China (No. 21175145), and Shanghai Technical Platform for Testing on Inorganic Materials (No. 19DZ2290700).
Appendix A. Supplementary dataSupplementary material related to this article canbefound, in the online version, at doi:https://doi.org/10.1016/j.cclet.2020.03.055.
| [1] |
L. Chen, J. Meng, S. Liang, et al., Environ. Sci. Technol. 52 (2018) 2036-2045. DOI:10.1021/acs.est.7b04607 |
| [2] |
N. Lubick, Nature 459 (2009) 620-621. |
| [3] |
M. Beldowska, A. Jedruch, L. Leczynski, D. Saniewska, U. Kwasigroch, Environ. Sci. Pollut. Res. 23 (2016) 16372-16382. DOI:10.1007/s11356-016-6753-7 |
| [4] |
Y. Wu, G. Xu, F. Wei, et al., Microporous Mesoporous Mater. 235 (2016) 204-210. DOI:10.1016/j.micromeso.2016.08.010 |
| [5] |
J. Wang, X. Feng, C.W. Anderson, Y. Xing, L. Shang, J. Hazard. Mater. 221-222 (2012) 1-18. DOI:10.1016/j.jhazmat.2012.04.035 |
| [6] |
P.B. Tchounwou, W.K. Ayensu, N. Ninashvili, D. Sutton, Environ. Toxicol. 18 (2003) 149-175. DOI:10.1002/tox.10116 |
| [7] |
K. Leopold, M. Foulkes, P.J. Worsfold, TrAC Trends Anal. Chem. 28 (2009) 426-435. DOI:10.1016/j.trac.2009.02.004 |
| [8] |
M. Yeganeh, M. Afyuni, A.H. Khoshgoftarmanesh, et al., J. Hazard. Mater. 244-245 (2013) 225-239. DOI:10.1016/j.jhazmat.2012.11.040 |
| [9] |
T. Cserfalvi, P. Mezei, P. Apai, J. Phys. D: Appl. Phys. 26 (1993) 2184-2188. DOI:10.1088/0022-3727/26/12/015 |
| [10] |
T. Cserfalvi, P. Mezei, J. Anal. At. Spectrom. 9 (1994) 345-349. DOI:10.1039/ja9940900345 |
| [11] |
Z. Wang, R. Gai, L. Zhou, Z. Zhang, J. Anal. At. Spectrom. 29 (2014) 2042-2049. DOI:10.1039/C4JA00173G |
| [12] |
X. Peng, X. Guo, F. Ge, Z. Wang, J. Anal. At. Spectrom. 34 (2019) 394-400. DOI:10.1039/C8JA00369F |
| [13] |
P. Jamroz, A. Dzimitrowicz, P. Pohl, Plasma Process Polym. 15 (2018) e1700083. DOI:10.1002/ppap.201700083 |
| [14] |
J.C.T. Eijkel, H. Stoeri, A. Manz, J. Anal. At. Spectrom. 15 (2018) 297-300. |
| [15] |
M. Miclea, K. Kunze, G. Musa, J. Franzkea, K. Niemax, Spectrochim. Acta Part B 56 (2001) 37-43. DOI:10.1016/S0584-8547(00)00286-X |
| [16] |
S. Brandt, F.D. Klute, A. Schütz, J. Franzke, Anal. Chim. Acta 951 (2017) 16-31. DOI:10.1016/j.aca.2016.10.037 |
| [17] |
X. Liu, Z. Zhu, D. He, et al., J. Anal. At. Spectrom. 31 (2016) 1089-1096. DOI:10.1039/C6JA00017G |
| [18] |
K. Greda, K. Swiderski, P. Jamroz, P. Pohl, Anal. Chem. 88 (2016) 8812-8820. DOI:10.1021/acs.analchem.6b02250 |
| [19] |
K. Swiderski, A. Dzimitrowicz, P. Jamroz, P. Pohl, J. Anal. At. Spectrom. 33 (2018) 437-451. DOI:10.1039/C7JA00374A |
| [20] |
K. Greda, S. Burhenn, P. Pohl, J. Franzke, Talanta 204 (2019) 304-309. DOI:10.1016/j.talanta.2019.06.015 |
| [21] |
K. Greda, M. Gorska, M. Welna, P. Jamroz, P. Pohl, Talanta 199 (2019) 107-115. DOI:10.1016/j.talanta.2019.02.058 |
| [22] |
P. Jamroz, K. Greda, A. Dzimitrowicz, K. Swiderski, P. Pohl, Anal. Chem. 89 (2017) 5729-5733. DOI:10.1021/acs.analchem.7b01198 |
| [23] |
X. Liu, Z. Liu, Z. Zhu, et al., Anal. Chem. 89 (2017) 3739-3746. DOI:10.1021/acs.analchem.7b00126 |
| [24] |
J. Mo, Q. Li, X. Guo, G. Zhang, Z. Wang, Anal. Chem. 89 (2017) 10353-10360. DOI:10.1021/acs.analchem.7b02214 |
| [25] |
K. Greda, P. Jamroz, P. Pohl, J. Anal. At. Spectrom. 29 (2014) 893-902. DOI:10.1039/C3JA50395J |
| [26] |
K. Greda, K. Kurcbach, K. Ochromowicz, et al., J. Anal. At. Spectrom. 30 (2015) 1743-1751. DOI:10.1039/C5JA00170F |
| [27] |
X. Peng, Z. Wang, Anal. Chem. 91 (2019) 10073-10080. DOI:10.1021/acs.analchem.9b02006 |
| [28] |
Z. Zhu, C. Yang, P. Yu, et al., J. Anal. At. Spectrom. 34 (2019) 331-337. DOI:10.1039/C8JA00271A |
| [29] |
J. Cheng, Q. Li, M. Zhao, Z. Wang, Anal. Chim. Acta 1077 (2019) 107-115. DOI:10.1016/j.aca.2019.06.003 |
| [30] |
A.J. Schwartz, S.J. Ray, G.C.Y. Chan, G.M. Hieftje, Spectrochim. Acta Part B 125 (2016) 168-176. DOI:10.1016/j.sab.2016.10.004 |
| [31] |
M. Li, K. Li, L. He, et al., Anal. Chem. 91 (2019) 7001-7006. DOI:10.1021/acs.analchem.9b00045 |
| [32] |
H. Zheng, J. Hong, X. Luo, et al., Microchem. J. 145 (2019) 806-812. DOI:10.1016/j.microc.2018.11.057 |
| [33] |
Y.M. Liu, F.P. Zhang, B.Y. Jiao, J.Y. Rao, G. Leng, J. Chromatogr. A 1493 (2017) 1-9. DOI:10.1016/j.chroma.2017.03.002 |
| [34] |
Y. Cai, Y.L. Yu, J.H. Wang, Anal. Chem. 90 (2018) 10607-10613. DOI:10.1021/acs.analchem.8b02904 |
| [35] |
A. Leng, Y. Lin, Y. Tian, et al., Anal. Chem. 89 (2017) 703-710. DOI:10.1021/acs.analchem.6b03185 |
| [36] |
P. Hu, X. Wang, L. Yang, et al., Microchem. J. 143 (2018) 228-233. DOI:10.1016/j.microc.2018.08.013 |
| [37] |
B. Wang, L. Feng, X. Mao, et al., J. Anal. At. Spectrom. 33 (2018) 1209-1216. DOI:10.1039/C8JA00009C |