 2020, Vol. 31


b School of Energy and Environmental Engineering, Hebei University of Technology, Tianjin 300401, China;
c Department of Chemistry, Tianjin University, Tianjin 300072, China
Photocatalytic hydrogen evolution (PHE) from water utilizing solar energy is a promising and green way to solve the global energy and environment crisis [1]. Since this groundbreaking work was first reported in 1972 by Fujishima and Honda [2], various photocatalysts have been developed over the past several decades. However, the practical application of PHE has still been limited due to the low transmission efficiency of photoexcited charges [3]. In order to solve the above problem, semiconductors are usually modified with co-catalysts to extract electrons for H+ reduction reaction [4], which can facilitate efficient electron-hole separation and transportation, thus improving the activity and stability of the photocatalysts [5].
To date, a variety of co-catalysts have been used in combination with photocatalysts, including noble metals, transition metal sulfides, oxides, and phosphides [6-11]. Generally, most of the cocatalysts are synthesized in a trial-and-error manner, and the characteristics of easy agglomeration of the nanoparticles lead to uneven distribution of the co-catalysts on the photocatalyst [12], which in turn affects the photocatalytic activity. Recent studies reveal that the nature of a material depends not only on its composition but also on its structure [13-15]. And a good structure can provide more active sites for photocatalytic reactions, meanwhile reducing the transport distance of charge carriers [16, 17]. In this context, it has become more urgent to improve the structure of the catalyst, which can develop cheaper and more efficient co-catalysts. However, the development of a simple synthesis process to obtain an inexpensive uniform distribution of co-catalyst/photocatalyst heterojunctions with high PHE activity remains challenging.
Metal organic frameworks (MOFs) are a kind of porous crystalline materials in which metal nodes and organic linkers are covalently linked [18]. Compared to conventional semiconductor photocatalysts, MOFs can contribute to fine-tuning and rational design of active photocatalysts at the molecular level [19]. Due to its unique physicochemical properties and structure, MOFs have recently been widely used as a sacrificial precursor for the preparation of complex structures or specific functional materials [20, 21], such as hollow structures [22, 23], porous carbon materials [24, 25], sacrificial templates [26-28]. The resulting derivatives have abundant active sites and dispersed nanoscale subunits, which confers high catalytic activity in the catalytic field. And the MOFs precursor is uniformly mixed with metal ions at the molecular level and converted to a co-catalyst during the formation of photocatalysts, helping to in situ uniformly and more closely load the co-catalyst. However, to date, there have been less reports on the development of co-catalyst /semiconductor heterojunctions using MOF as a precursor.
Herein, we report a novel strategy for preparing photocatalytic hydrogen heterojunctions by using MOFs as a precursor template, resulting Cu1.8S acts as a co-catalyst and ZnxCd1-xS exists as the solid solution photocatalyst. The obtained new catalytic composite material Cu1.8S/Zn0.35Cd0.65S presents excellent photocatalytic activities under visible light illumination in 0.1 mol/L Na2S and 0.35 mol/L Na2SO3 solutions. And the mechanism of the improvement of photocatalytic activity was studied by theoretical and experimental methods. Consequently, this work has achieved the synergistic integration of photocatalytic components and functional heterostructures, providing an idea for creating new efficient solar-hydrogen conversion photocatalysts.
All chemicals are analytically pure and are used without further purification (Text S1 in Supporting information). Detailed information of synthesis of Cu1.8S/ZnxCd1-xS, characterization and density functional theory (DFT) computational methods etc. were given in the Texts S2-S8 (Supporting information). Scheme 1 illustrates a three-step procedure for the synthesis of Cu1.8S/ZnxCd1-xS heterojunctions, in which Cu1.8S acts as a co-catalyst and ZnxCd1-xS exists as the solid solution. To better study the transformation of MOFs (HKUST-1) in this process, various characterizations were performed, and Cu1.8S/Zn0.35Cd0.65S was chosen as the model due to its optimized activity. Those detailed analysis processes are described in Text S9 (Supporting information).

|
Download:
|
| Scheme 1. Schematic illustration of the synthetic procedure for Cu1.8S/ZnxCd1-xS. | |
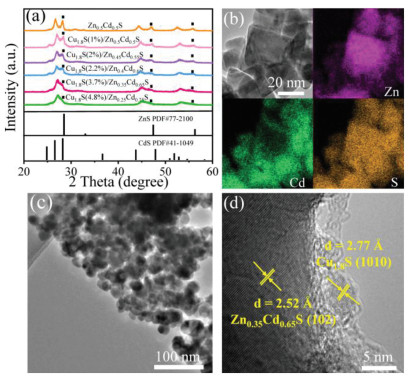
The phase structures and average crystallite size (Text S10 in Supporting information) of the prepared samples were determined by X-ray diffraction (XRD). Fig. 1a shows the XRD patterns of Zn0.5Cd0.5S and Cu1.8S(y%)/ZnxCd1-xS (x = 0.5, 0.45, 0.4, 0.35, 0.25, y = 1, 2, 2.2, 3.7, 4.8) samples, together with the standard diffraction patterns of the cubic phase ZnS (JPCDS No. 77-2100) and hexagonal phase CdS (JPCDS No. 41-1049) [29]. As the amount of MOFs gradually increased, the XRD diffraction peaks of the corresponding samples show significant changes. Firstly, the diffraction peaks of ZnS (111), (220) and (311) gradually weaken, presumably due to the decrease in the proportion of Zn contents, which corresponds well with the results of Inductively Coupled Plasma-Mass Spectrometry (ICP-MS) (Table S2 in Supporting information). And the Zn/Cd ratio of each sample can be obtained by ICP. Therefore, the addition of different amounts of MOFs precursors in the synthesis helps to well regulate the ratio of Zn/Cd in the solid solution, which is convenient to find the optimized catalyst. Furthermore, the Cu contents also were measured by ICP to indicate the changed amount of co-catalyst Cu1.8S in the samples (Table S3 in Supporting information).
As revealed by the images of transmission electron microscopy (TEM) and scanning electron microscopy (SEM) (Fig. 1b and Fig. S3 in Supporting information), the Zn0.35Cd0.65S nanoparticles with single particle size about 20-50 nm. Moreover, we can clearly observe the uniform distribution of the Zn, Cd and S elements in the element mapping image (Fig. 1b), which further indicates the formation of Zn0.35Cd0.65S solid solution [30]. Furthermore, the lattice spacing of 0.325 nm can correspond to the (111) plane of Zn0.35Cd0.65S solid solution in the high resolution TEM (HRTEM) image (Fig. S4 in Supporting information) [5]. For the heterojunctions, the particle size remains about 20-50 nm (Fig. 1c). And the lattice spacings of 0.257 and 0.277 nm can be indexed to the (1010) plane of Cu1.8S and (102) hexagonal plane of Zn0.35Cd0.65 solid solutions, respectively (Fig. 1d). Cu1.8S and Zn0.35Cd0.65 nanoparticles intimately connect with each other, indicating the formation of heterojunctions, which is advantageous to providing a fast transmission route for photoexcited charge [31]. X-ray photoelectron spectra (XPS) of the hybrid catalyst have been recorded to determine the chemical composition and valence states of the elements in Zn0.35Cd0.65S and Cu1.8S/Zn0.35Cd0.65S (Text S11 in Supporting information). Meanwhile, the formation of heterojunctions also can be confirmed by Raman spectra (Text S12 in Supporting information). Compared to Zn0.35Cd0.65S, an additional peak at 4657 cm-1 was detected in Cu1.8S/Zn0.35Cd0.65S due to the generation of Cu1.8S. Based on the above analysis results, we can conclude that we have successfully prepared a hybrid catalyst based on Zn0.35Cd0.65S solid solution with Cu1.8S as a co-catalyst.

|
Download:
|
| Fig. 1. (a) XRD patterns of the Cu1.8S(y%)/ZnxCd1-xS samples. The x and y values were determined by ICP. (b) TEM and elemental mapping images of Zn0.35Cd0.65S. TEM (c) and HRTEM (d) images of Cu1.8S/Zn0.35Cd0.65S. | |
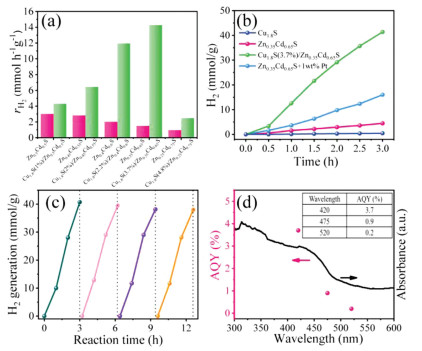
The activity of Cu1.8S/ZnxCd1-xS is gradually improved when the amount of deposited Cu1.8S is increased (Text S13 in Supporting information), and the maximum H2 evolution rate of 14.27 mmol h-1 g-1 is achieved by Cu1.8S/Zn0.35Cd0.65S with 3.7% Cu (wt%) (Fig. 2a). However, further loading of Cu1.8S results in obvious decrease the photocatalytic activity. This is due to the following reasons: (1) As the MOFs (HKUST-1) content added during the preparation increased, the change of Zn/Cd ratio in the prepared sample caused the photocatalytic activity of the catalyst to decrease. (2) Cu1.8S at high loading amount can cover the surface active sites of ZnxCd1-xS thereby reducing the ability of light absorption and photogenerated charge, causing a "shielding effect". As shown in Fig. 2b and Fig. S8 (Supporting information), Cu1.8S/Zn0.35Cd0.65S has the best photocatalytic activity of 41.4 mmol g-1 in 3 h, which is 9.26 times higher than that of Zn0.35Cd0.65S solid solution (4.47 mmol/g), and even much higher than that of a Pt (1 wt%) loaded Zn0.35Cd0.65S photocatalyst (16.02 mmol/g). In contrast, both Zn0.35Cd0.65S and Cu1.8S exhibit low visible-light hydrogen production activities (Text S14 in Supporting information), indicating that the combination of Cu1.8S and Zn0.35Cd0.65S contributes to charge separation and transfer to enhance photocatalytic activity.

|
Download:
|
| Fig. 2. (a) The rate of hydrogen production of different samples. (b) Photocatalytic hydrogen production profile comparison of the Cu1.8S/Zn0.35Cd0.65S with Cu1.8S, Zn0.35Cd0.65 and Pt (1 wt%) loaded Zn0.35Cd0.65S, the stability study (c) and apparent quantum yield (d) of Cu1.8S/Zn0.35Cd0.65S. | |
The stability of Cu1.8S/Zn0.35Cd0.65S was tested by repeating the experiments under identical conditions and measuring the hydrogen production rate for each cycle, as shown in Fig. 2c. After 12 h of irradiation without the recovery of catalysts and reagents, Cu1.8S/Zn0.35Cd0.65S is noobviouslossof the photocatalytic hydrogen production activity. In addition, there was no significant change in XRD (Fig. S12 in Supporting information) of Cu1.8S/Zn0.35Cd0.65S before and after the photocatalytic reaction, implying the good stability in a photocatalytic reaction. The apparent quantum yield (AQY) of the Cu1.8S/Zn0.35Cd0.65S photocatalyst wasmeasured at420, 475, 520 nm by using different band-passfilters (Fig. 2d).Thetrendin AQY closely follows that of the absorbance measured by ultraviolet-visible spectroscopy, and a relatively high AQY of 3.7% at 420 nm is obtained. As showninTable S4 (Supporting information), the activity of Cu1.8S/Zn0.35Cd0.65S is compared with other previously reported co-catalyst/solid solution heterojunction catalysts, and the catalyst in this work shows a comparable or higher photocatalytic hydrogen evolution property.
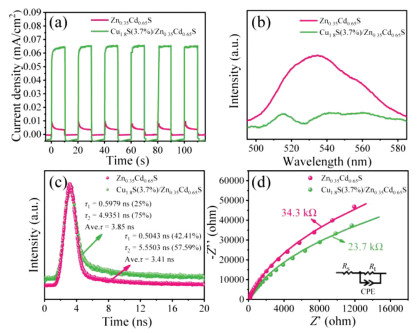
In order to find out the inherent mechanism of the enhanced photocatalytic hydrogen production activity of Cu1.8S/Zn0.35Cd0.65S, a series of experiments were conducted. Fig. 3a shows the transient photocurrent response of the samples, and Cu1.8S/Zn0.35Cd0.65S indicates obviously higher response (15.3 times) than that of Zn0.35Cd0.65S. This result indicates that Cu1.8S as a high-efficiency co-catalyst makes the separation efficiency of electrons and holes in Cu1.8S/Zn0.35Cd0.65S [32], which might be the reason for the improvement of the photocatalytic activity [33]. Furthermore, the charge separation behavior between Zn0.35Cd0.65S and Cu1.8S was further confirmed by the steady-state photoluminescence (PL) spectra.As shownin Fig. 3b, the emissionpeakofCu1.8S/Zn0.35Cd0.65S is significantly weakened in comparison with that of Zn0.35Cd0.65S, suggesting the obviously suppressed charge recombination and the faster interfacial charge transfer [34]. Inphotocatalytic reactions, the longer the lifetime of the charge carrier, the more likely it is to participate in the photocatalytic reaction process [35]. As shown in Fig. 3c, the average PL lifetime of the Zn0.35Cd0.65S and Cu1.8S/Zn0.35Cd0.65S were determined to be 3.41 ns and 3.85 ns, respectively. The elevated PL lifetime confirmed that loading Cu1.8S co-catalysts can facilitate the charge dynamics and elongate the lifetime of charge carriers [36]. Moreover, in order to obtain a deep insight into the charge transport behavior without photoexcitation, EIS measurements were performed under dark conditions (Text S15 in Supporting information). Cu1.8S/Zn0.35Cd0.65S shows a much smaller semicircle diameter and a much lower Rt value than Zn0.35Cd0.65S (Fig. 3d), suggesting its lower interfacial charge-transfer resistance [37].

|
Download:
|
| Fig. 3. Transient photocurrent responses (a), steady-state PL spectra (b), timeresolved PL decay spectra of Zn0.35Cd0.65S and Cu1.8S/Zn0.35Cd0.65S (c). (d) Electrochemical impedance spectroscopy (EIS) Nyquist plots of Zn0.35Cd0.65S and Cu1.8S/Zn0.35Cd0.65S in dark. | |
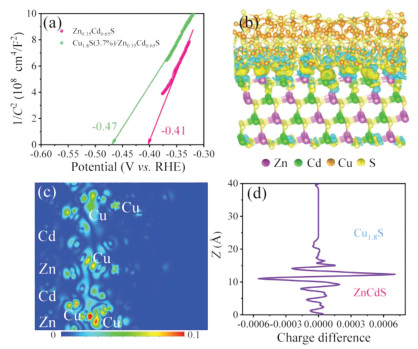
To gain further insight into the charge separation mechanism of Cu1.8S/Zn0.35Cd0.65S, Mott-Schottky measurement and DFT calculations were carried out. Mott-Schottky measurement was used to retrieve quantitative insight about the photoinduced electron density of Cu1.8S/Zn0.35Cd0.65S. As is shown in Fig. 4a, both the samples show positive slopes, suggesting they are n-type semiconductors with electrons as major carriers. The linear parts of the plots are extrapolated to 1/C2 = 0, the values of Efb are obtained to be -0.47 eV and -0.41 eV for Zn0.35Cd0.65S and Cu1.8S/Zn0.35Cd0.65S, respectively. Then, the calculated carrier densities of Zn0.35Cd0.65S and Cu1.8S/Zn0.35Cd0.65S are 1.62 × 1030 cm-3 and 7.58 × 1030 cm-3 (Text S16 in Supporting information), respectively, suggesting a much faster carrier transfer in Cu1.8S/Zn0.35Cd0.65S. Moreover, DFT calculations are used to better understand the carrier transfer process at the interface. As can be seen from Figs. 4b and c, simulated charge distribution show that Cu atoms in Cu1.8S gain electrons (light-blue cloud), meanwhile, Cd atoms and Zn atoms in Zn0.35Cd0.65S lose electrons. Furthermore, the plot vibration of Zn0.35Cd0.65S indicates the charge migrates from Zn0.35Cd0.65S to Cu1.8S, and finally achieve a balance (Fig. 4d). All above analysis provide intuitive evidence of charge transfer from Zn0.35Cd0.65S to Cu1.8S, resulting more efficient charge separation and more electrons participate in the reduction of H+. And the Brunauer-Emmett-Teller (BET) test indicates that the change in specific surface area is not the main reason for the increase in catalyst activity (Text S17 in Supporting information). To further discuss the mechanism of catalyst activity enhancement, we tested the light absorption capability of samples. The UV–vis absorption spectra of Zn0.35Cd0.65S and Cu1.8S/Zn0.35Cd0.65S are presented in Fig. S15a (Supporting information), which suggest that the adsorption edges of Zn0.35Cd0.65S and Cu1.8S/Zn0.35Cd0.65S are 527 nm and 633 nm, respectively. The detailed analysis processes are described in Text S18 in Supporting information.

|
Download:
|
| Fig. 4. (a) Mott-Schottky plots of Zn0.35Cd0.65S and Cu1.8S/Zn0.35Cd0.65S. (b) Simulated charge distributions at the interface of Cu1.8S/Zn0.35Cd0.65S. (c) The planar average charge difference plot as a function of Z coordinate and (d) 2D atomic plane of electron difference density analysis for Cu1.8S/Zn0.35Cd0.65S. | |
Based on above mentioned results, the photocatalytic mechanism is tentatively proposed and illustrated in Fig. S18 (Supporting information). Firstly, loading Cu1.8S on Zn0.35Cd0.65S can extend the light absorption region to the visible region, which facilitates the generation of photoexcited electrons. Secondly, as a co-catalyst, Cu1.8S can effectively capture light-induced electrons form conduction band (CB) of Zn0.35Cd0.65S, thereby promoting the transfer of photogenerated electrons. Finally, the electrons could effectively reduce H2O to produce H2, and the holes are eliminated by the sacrificial agent (Na2S/Na2SO3). In addition, by using MOFs as a precursor during the preparation process, uniform loading of the co-catalyst in situ on the solid solution can increase the number of active sites on the surface. Thus, by virtue of the above advantages, the Cu1.8S/Zn0.35Cd0.65S is endowed with remarkable properties toward photocatalytic hydrogen production.
In summary, a novel strategy for the preparation of Cu1.8S/Zn0.35Cd0.65S heterojunctions for photocatalytic hydrogen production using MOFs as a precursor template was successfully developed. Cu1.8S(3.7%)/Zn0.35Cd0.65S exhibits a best H2 production rate of 14.27 mmol h-1 g-1 under visible light illumination and a high AQY of 3.7% at 420 nm. In addition, experimental characterizations and calculations demonstrate that the increase in hydrogen production activity is due to the efficient separation of charge by Cu1.8S as a highly efficient co-catalyst. This work not only presents a facile method to synthesize highly active Cu1.8S/Zn0.35Cd0.65S for photocatalytic hydrogen, but also provides significant guidance to the rational design and development of novel visible-light-responsive photocatalysts for highly efficient energy conversion.
Declaration of competing interestThe authors declare no conflict of interest.
AcknowledgementsThe authors gratefully acknowledge the financially support by the National Natural Science Foundation of China as general projects (Nos. 21722702 and 21874099), the Tianjin Commission of Science and Technology as key technologies R&D projects (Nos. 18YFZCSF00730, 18YFZCSF00770 and 18ZXSZSF00230), National Key Basic Research Program of China (No. 2017YFA0403402), Science and Technology Research Projects of Colleges and Universities in Hebei province (No. ZD2020149).
Appendix A. Supplementary dataSupplementary material related to this article can be found, in the online version, at doi:https://doi.org/10.1016/j.cclet.2020.07.046.
| [1] |
S. Chu, A. Majumdar, Nature 488 (2012) 294-303. DOI:10.1038/nature11475 |
| [2] |
A. Fujishima, K. Honda, Nature 238 (1972) 37-38. DOI:10.1038/238037a0 |
| [3] |
K. Wu, Z. Chen, H. Lv, et al., J. Am. Chem. Soc. 136 (2014) 7708-7716. DOI:10.1021/ja5023893 |
| [4] |
Y.P. Yuan, L.W. Ruan, J. Barber, S.C. Joachim Loo, C. Xue, Energy Environ. Sci. 7 (2014) 3934-3951. DOI:10.1039/C4EE02914C |
| [5] |
J. Song, H. Zhao, R. Sun, X. Li, D. Sun, Energy Environ. Sci. 10 (2017) 225-235. DOI:10.1039/C6EE02414A |
| [6] |
M. Murdoch, G.I.N. Waterhouse, M.A. Nadeem, et al., Nat. Chem. 3 (2011) 489-492. DOI:10.1038/nchem.1048 |
| [7] |
S. Cao, Y. Chen, C.J. Wang, X.J. Lv, W.F. Fu, Chem. Commun. 51 (2015) 8708-8711. DOI:10.1039/C5CC01799H |
| [8] |
S.R. Lingampalli, U.K. Gautam, C.N.R. Rao, Energy Environ. Sci. 6 (2013) 3589-3594. DOI:10.1039/c3ee42623h |
| [9] |
Z. Sun, Q. Yue, J. Li, et al., J. Mater. Chem. A 3 (2015) 10243-10247. DOI:10.1039/C5TA02105G |
| [10] |
F.N. Sayed, O.D. Jayakumar, R. Sasikala, et al., J. Phys. Chem. C 116 (2012) 12462-12467. DOI:10.1021/jp3029962 |
| [11] |
M. Hara, J. Nunoshige, T. Takata, J.N. Kondo, K. Domen, Chem. Commun. (2003) 3000-3001. |
| [12] |
P. Wang, S. Zhan, H. Wang, et al., Appl. Catal. B 230 (2018) 210-219. DOI:10.1016/j.apcatb.2018.02.043 |
| [13] |
C. Li, C. Koenigsmann, W. Ding, et al., J. Am. Chem. Soc. 137 (2015) 1520-1529. DOI:10.1021/ja5111078 |
| [14] |
H. Lin, B. Sun, H. Wang, et al., Small 15 (2019) 1804115. DOI:10.1002/smll.201804115 |
| [15] |
Y. Yu, J. Zhang, X. Wu, W. Zhao, B. Zhang, Angew. Chem. Int. Ed. 51 (2012) 897-900. DOI:10.1002/anie.201105786 |
| [16] |
J. Zhang, Z. Yu, Z. Gao, et al., Angew. Chem. Int. Ed. 56 (2017) 816-820. DOI:10.1002/anie.201611137 |
| [17] |
Q. Han, B. Wang, J. Gao, L. Qu, Angew. Chem. Int. Ed. 55 (2016) 10849-10853. DOI:10.1002/anie.201605591 |
| [18] |
R. Wang, L. Gu, J. Zhou, et al., Adv. Mater. Interfaces 2 (2015) 1500037. DOI:10.1002/admi.201500037 |
| [19] |
Y. Su, Z. Zhang, H. Liu, Y. Wang, Appl. Catal. B 200 (2017) 448-457. DOI:10.1016/j.apcatb.2016.07.032 |
| [20] |
J.D. Xiao, H.L. Jiang, Small 13 (2017) 1700632. DOI:10.1002/smll.201700632 |
| [21] |
P. Zhang, S. Wang, B.Y. Guan, X.W. Lou, Energy Environ. Sci. 12 (2019) 164-168. DOI:10.1039/C8EE02538J |
| [22] |
J. Low, C. Jiang, C. Bei, S. Wageh, A.A. Al-Ghamdi, J. Yu, Small Methods 1 (2017) 1700080. DOI:10.1002/smtd.201700080 |
| [23] |
J. Yang, F. Zhang, H. Lu, et al., Angew. Chem. Int. Ed. 54 (2015) 10889-10893. DOI:10.1002/anie.201504242 |
| [24] |
X. Wang, Z. Chen, X. Zhao, et al., Angew. Chem. Int. Ed. 57 (2018) 1944-1948. DOI:10.1002/anie.201712451 |
| [25] |
M. Hu, S. Zhao, S. Liu, et al., Adv. Mater. 30 (2018) 1801878. DOI:10.1002/adma.201801878 |
| [26] |
Q. Sun, N. Wang, J. Yu, J.C. Yu, Adv. Mater. 30 (2018) e1804368. DOI:10.1002/adma.201804368 |
| [27] |
J. Chen, Z. Shen, S. Lv, et al., J. Mater. Chem. A 6 (2018) 19631-19642. DOI:10.1039/C8TA07362G |
| [28] |
S. Wang, B.Y. Guan, X. Wang, X.W.D. Lou, J. Am. Chem. Soc. 140 (2018) 15145-15148. DOI:10.1021/jacs.8b07721 |
| [29] |
Q. Li, H. Meng, P. Zhou, et al., ACS Catal. 3 (2013) 882-889. DOI:10.1021/cs4000975 |
| [30] |
M. Liu, D. Jing, Z. Zhou, L. Guo, Nat. Commun. 4 (2013) 2278. DOI:10.1038/ncomms3278 |
| [31] |
Y. Chen, S. Zhao, X. Wang, et al., J. Am. Chem. Soc. 138 (2016) 4286-4289. DOI:10.1021/jacs.5b12666 |
| [32] |
H. Liang, P. Hua, J. Tang, J. Niu, Chin. Chem. Lett. 30 (2019) 2245-2248. DOI:10.1016/j.cclet.2019.05.046 |
| [33] |
W. Zhen, X. Ning, B. Yang, et al., Appl. Catal. B 221 (2018) 243-257. DOI:10.1016/j.apcatb.2017.09.024 |
| [34] |
S. Yu, X.B. Fan, X. Wang, et al., Nat. Commun. 9 (2018) 4009. DOI:10.1038/s41467-018-06294-y |
| [35] |
Y. Wang, X. Liu, J. Liu, et al., Angew. Chem. Int. Ed. 57 (2018) 5765-5771. DOI:10.1002/anie.201802014 |
| [36] |
D. Yuan, M. Sun, S. Tang, et al., Chin. Chem. Lett. 31 (2020) 547-550. DOI:10.1016/j.cclet.2019.09.051 |
| [37] |
Z. Zhang, H. Cui, J. Tian, et al., Appl. Catal. B 274 (2020) 119114. DOI:10.1016/j.apcatb.2020.119114 |