 2020, Vol. 31


b The Center of New Energy Materials and Technology, School of New Energy and Materials, Southwest Petroleum University, Chengdu 610500, China
Photocatalytic oxidation for effective pollutant removal has been grown rapidly in present due to its environment-friendly and economically attractive features [1-8]. Highly limited by large dissociation energy of the O—O bond, the activation of molecular oxygen is deemed to be the rate-limiting step in the process of photocatalytic oxidation [9, 10]. Typically, molecular oxygen activation on the surface of photocatalysts proceeds electron reduction to generate reactive oxygen species (ROS). Hence, the surface of photocatalysts might be required to offer electrons to molecular oxygen which could promote its activation [11-13].
Quantum dots (QDs) have drawn growing interests due to the wide application in photocatalysis [14-17]. Distinguishing from traditional semiconductors, the sizes of quantum dots are extremely small in all three dimensions, which makes photoinduced electrons can more quickly tunnel to the surface to participate in photocatalytic reaction [14, 17]. Among numerous quantum dots, InP QDs have attracted concerns in environmental and biological applications [18-20]. Different from the widespread used Cd-based QDs, InP QDs present the lower toxicity and the electrons and holes in them show the weaker attraction [18, 19]. Moreover, InP QDs reveals a favorable absorption ability for solar light [20, 21]. The above characteristic makes it be a promising candidate for molecular oxygen activation. Unfortunately, same as frequently-used QDs, there are some defect states on the InP QDs, which might be the recombination centers for photoinduced electrons and holes, affecting the catalytic performance [16, 22, 23].
To address this issue, most efforts have been focused on loading the QDs on two-dimensional (2D) materials to construct a heterojunction [24, 25]. Among 2D materials, graphitic carbon nitride (g-C3N4) nanosheets have elicited ripples of attention in the photocatalytic realm owing to the excellent visible-light response, tunable electronic structure and favorable chemical stability [26-32]. Importantly, the honeycomb-like structure of g-C3N4 nanosheets formed by tri-s-triazine units could make it be the ideal support to load QDs [16, 33-36].
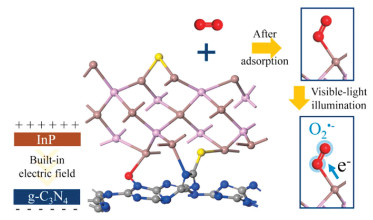
Inspired by the above considerations, we construct InP QDs and g-C3N4 nanosheets compounds by a facile method. As displayed in Scheme 1, InP QDs can be bonded with the adsorbed molecular oxygen to promote its activation. Meanwhile, with the light illumination, the molecular oxygen is further activated to convert into O2·- to promote the NO deep oxidation.

|
Download:
|
| Scheme 1. Schematic illustration of the role of InP QDs in the g-C3N4 to promote molecular oxygen activation. | |
A typical method was applied to synthesize the g-C3N4 nanosheets. 15 g of urea was put in a semiclosed alumina crucible and heated up to 550 ℃ in the muffle furnace (Holding time: 1 h). InP QDs were prepared by the method reported in our previous study [20]. The InP QDs and g-C3N4 nanosheet compounds were synthesized as follows. 500 mg g-C3N4 nanosheets were dispersed in 15 mL deionized water. After that, a certain amount of InP QDs solution (Concentration: 7.6 mg/mL) was added to the above solution. Then, mixed solution was stirring at 20 ℃ for 2 h and frozen-drying (pre-frozen at -80 ℃ for 2 h) for 36 h. After that, the obtained samples were collected and labeled as x%InP/g-C3N4 (x: mass percent of InP QDs and g-C3N4 nanosheet).
All the phases were characterized by X-ray diffraction (XRD) set at 40 kV/40 mA with Cu Kα radiation. Microstructures were characterized by transmission electron microscopy (TEM, Tecnai G2 F30). Surface chemical states and compositions were detected by X-ray photoelectron spectrometer (XPS, Thermo ESCALAB250Xi). The ultraviolet-visible diffuse reflectance spectrum (UV–vis DRS) were measured by Shimadzu spectrophotometer (UV-2600) equipping with the integrating sphere (Reflectance standard: Ba2SO4). The fluorescence spectrophotometer (F-7000) was used to measure the photoluminescence spectroscopy (PL) spectrum (Excitation wavelength: 320 nm). Time-resolved fluorescence emission spectra were recorded on time-resolved fluorescence spectrometer (PL-TCSPC) of HORIB-FM-2015. The electron spin resonance (ESR) spectrum of radicals spin-trapped by 5, 5-dimethyl-1-pyrroline N-oxide (DMPO) was measured on Bruker E500 spectrometer. The sample was added in 50 mmol/L DMPO solution tank (methanol dispersion for DMPO-O2·- and aqueous dispersion for DMPO-·OH) and was detected under visible-light illumination (λ>420 nm).
Photocatalytic nitric oxide (NO) oxidation tests were evaluated in a homemade continuous flow reactor, which reported in our previous works [5, 10, 37]. Typically, 0.2 g of sample was divided into two parts and dispersed in the culture dishes (Diameter: 10 cm). The flow rates of NO and Air were set to be 10 mL/min and 2 L/min (NO initial concentration: 500 ppb). A metal halide lamp (150 W) worked as the light source with a visible light filter (λ>420 nm). The light intensity was 41 mW/cm2. The concentration of NO was continuously detected on the NOx analyzer (Thermo, model 42c-TL).
Dispersion corrected density function theory (DFT-D) was applied in this study. All the calculations were performed in the Cambridge Sequential Total Energy Package (CASTEP) code of Materials Studio software [38]. The Perdew-Burke-Ernzerhof (PBE) functional of generalized gradient approximation (GGA) theory was performed in current study [39, 40]. The k-point and cut-off energy were individually set to be 2 × 2 × 1 and 380 eV. InP/g-C3N4 model was fabricated with 2 × 1 (001) InP and 1 × 1 (001) g-C3N4 surface (Vacuum thickness: 15 Å).
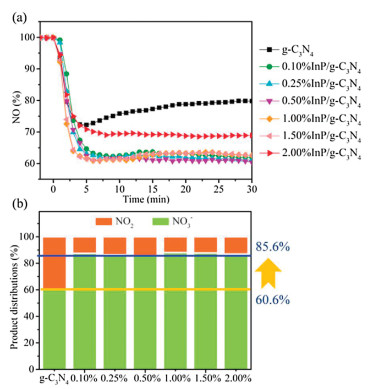
Nitric oxide (NO) is an integral part of atmospheric pollutants, which has brought multitudinous environmental problems. As the typical photocatalytic oxidation process, photocatalytic NO removal technology generally proceeds a two-step oxidation reaction. The undesirable toxic byproduct NO2 is usually generated due to the partial oxidation of NO. Hence, the NO oxidation process requires precise control to promote NO deep oxidation. Based on these, photocatalytic NO removal tests under visible light illumination over g-C3N4 and InP/g-C3N4 compounds are carried out in Fig. 1. The g-C3N4 sample reveals a NO removal ratio of 20.2%. Meanwhile, there is a large amount of NO2 generation, which comprises 39.4% in the final product distribution. It should be noted that the NO removal efficiencies are highly enhanced after InP QDs loaded. The 0.5%InP/g-C3N4 compound presents the best removal ratio of 39.6%, which has almost doubled from pristine g-C3N4. More interestingly, the generation of toxic NO2 is extremely inhibited with the introduction of InP QDs. The NO3- distribution in the final products is enhanced from 60.6% to 85.6%. In brief, the introduction of InP QDs enhances the NO removal ratio and effectively inhibits the generation of NO2. As presented in Fig. S1 (Supporting information), the NO removal ratio of has a slight decrease (2.9%) after five recycling tests. Furthermore, UV–vis DRS of used 0.5%InP QDs/g-C3N4 sample has slightly changed compared with the fresh sample (Fig. S2 in Supporting information). The above results suggest that InP QDs/g-C3N4 compound has favorable stability.

|
Download:
|
| Fig. 1. NO remove ratio (a), NO2 selectivity (b) and product distributions (c) of different samples under visible-light illumination (λ > 420 nm). | |
As investigated in Fig. S3 (Supporting information), the main characteristic diffraction peak of XRD pattern for g-C3N4 appears at 27.3°, which is indexed to the (002) plane. After InP QDs loaded, the position of characteristic diffraction peak indexed to (002) plane has a slight positive shift compared to g-C3N4. Meanwhile, the peak at 12.9° indexed to (100) plane has disappeared. Furthermore, the peaks indexed to InP cannot be found even if the loading concentrate of 2%. Hence, the highest loading concentrate sample (C3N4) is selected as a representative to explore the influence of InP QDs in the morphology of g-C3N4. As depicted in Fig. S4 (Supporting information), the g-C3N4 sample presents a nanosheet microscopic morphology. Furthermore, the microscopic morphology of pure InP QDs is presented in Fig. S4b. The average size of pure InP QDs is ca. 2-4 nm. Hence, it is difficult to observe the presence of InP QDs in the TEM of its compound due to the small size of InP QDs (Fig. S4c in Supporting information). Meanwhile, as shown in HRTEM (Figs. S4d and e), there are no obvious lattice fringes observed in pure g-C3N4 as well as InP QDs. Hence, it is difficult to distinguish the g-C3N4 and InP QDs according to HRTEM image of InP QDs/g-C3N4 compound in Fig. S4f. To indicate the presence of InP QDs in InP QDs/g-C3N4 compound, the EDS elemental mapping is presented in Fig. S5 (Supporting information). It is obvious that C, N, O, In and P elements are uniformly distributed over the whole area of the sample, indicating the successful introduction of InP QDs.
To further confirm the existence of InP QDs and explore the influence of it in the surface chemical composition and chemical states of g-C3N4, XPS patterns of g-C3N4 and 0.5%InP QDs/g-C3N4 compound are shown in Fig. S6 (Supporting information). For g-C3N4, three C 1s peaks located at 288.3, 286.2 and 284.8 eV are ascribed to C—N, C—O and C—C bonds, respectively. In N 1s spectra, two main peaks at 400.4 and 398.8 eV are individually assigned to N—(C)3 and N—C bonds. In O 1s spectra, the characteristic peak appearing at 532.5 eV is ascribed to C—O bonds. After InP QDs loaded, the main characteristic peaks in C 1s, N 1s and O 1s spectrum are similar to that of g-C3N4. In addition, in In 3d spectra, there are two new peaks appearing at 452.6 and 445.1 eV assigned to In—P bonds. Correspondingly, two new peaks at 133.5 and 129.2 eV in P 2p spectra are ascribed to P—In and P—O bonds, respectively. These indicate that InP QDs are successfully loaded on g-C3N4. It should be noted that the peaks ascribed to the bonds of g-C3N4 shift to the low binding energy orientation (ca. 0.1-0.2 eV) after InP QDs introducing, which are observed in C 1s, N 1s and O 1s spectrum. It is identified that the electrons transfer from InP QDs to g-C3N4 after the compound fabricated. Meanwhile, DFT calculations are performed to further explore the properties of InP/g-C3N4 interface in Fig. S7 (Supporting information). The potential energy of InP is much higher than that of g-C3N4, resulting that 1.25e of electrons can transfer from InP to g-C3N4 driving by this force. This result agrees well with the XPS analysis. Based on the XPS valence band spectra (Fig. S8 in Supporting information) and band gaps (Fig. S9 in Supporting information) of g-C3N4 and InP QDs, the positions of valence band and conduction band are determined in Fig. S10 (Supporting information). Combined with the direction of the built-in electric field, the photocatalytic mechanism of InP QDs/g-C3N4 compound is shown as follows. Under light irradiation, electrons are excited from the valence band to the conduction band of g-C3N4 and InP QDs, respectively. Due to the formation of built-in electric field in the interface, the holes in InP QDs are recombined with the electrons in g-C3N4. Benefiting from this, the photoinduced electrons are accumulated in the InP QDs side of InP QDs/g-C3N4 compound, which is beneficial to the separation of photo-generated carriers.
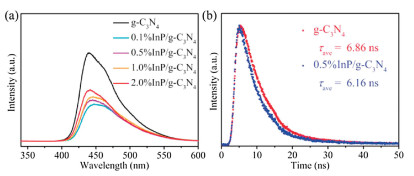
To understand the possible roles of InP QDs in enhanced performance, solar light absorption is firstly investigated by UV–vis spectrum in Fig. S11 (Supporting information). It is obvious that the absorption edge and corresponding band gaps (Fig. S9a in Supporting information) have rarely changed after InP QDs loaded. Different from it, the steady-state PL spectrum in Fig. 2a have notable changes with the introduction of InP QDs. The PL intensity of InP QDs/g-C3N4 compounds is much lower than that of g-C3N4, proving that the recombination of photogenerated charges in compounds is effectively inhibited. It is identified by the timeresolved PL spectrum in Fig. 2b. The lifetime of photogenerated electrons in g-C3N4 is decreased from 6.86 ns to 6.16 ns after InP QDs loaded. The above results illustrate that the existence of InP QDs promotes the effective separation of photogenerated charges, resulting in that photogenerated electrons could fast transfer from g-C3N4 to InP QDs.

|
Download:
|
| Fig. 2. Steady-state (a) and time-resolved (b) PL spectra of g-C3N4 and InP QDs/g-C3N4 compounds. | |
During the process of photocatalytic oxidation surface reaction, molecular oxygen activation has a crucial role on its performance. The activation of molecular oxygen typically needs to undergo the following steps. (Ⅰ) Molecular oxygen is adsorbed on the surface of the catalyst. (Ⅱ) Adsorbed molecular oxygen obtains electrons from the surface to convert into reactive oxygen species (O2·-). Based on this consideration, the molecular oxygen adsorption on g-C3N4 and InP/g-C3N4 surface are simulated by DFT calculations in Table S1 (Supporting information) and Fig. 3. It is obvious that the adsorption energy of molecular oxygen adsorbed on different sides of InP/g-C3N4 (Eads = -0.95 and -0.55 eV) are both more negative than that on the g-C3N4 surface (Eads = -0.19 eV). This indicates that introducing InP can significantly enhance the adsorption ability of g-C3N4 for molecular oxygen. Furthermore, the molecular oxygen prefers to adsorb on the InP side due to the lower adsorption energy of -0.95 eV than that of the g-C3N4 side. It is interesting that the adsorbed molecular oxygen is bond with the InP surface to form the O-In bond in Fig. 3a. As a result, molecular oxygen can obtain the most electrons of 0.42e from the InP surface to promote its activation, which is identified in Table S2. To better uncover the process of photocatalytic molecular oxygen activation, an electron has been added into the system to simplistically simulate the photo-generated electron (e-). Compared to the adsorption energy given in Table S1 (Supporting information), it is interesting that the introduction of electron promotes the adsorption ability of molecular oxygen on InP/g-C3N4, while it has a little adverse effect on g-C3N4. Meanwhile, the larger change of adsorption energy on the InP side of InP/g-C3N4 proves that the introduction of electron mainly facilitates the molecular oxygen adsorption ability of the InP side compared with g-C3N4 side. Benefiting from this, in Table S3 (Supporting information), there are more electrons (0.49e) transferring from the InP surface to molecular oxygen to promote its activation. To further confirm the above results, the DMPO spin-trapping ESR experiments are carried out in Fig. 3b. The detected DMPO-O2·- signals of the 0.5% InP QDs/g-C3N4 are much stronger than that of the g-C3N4 under visible-light illumination. Except for O2·-, ·OH is also the important active specie for atmospheric pollutant removal. As shown in Fig. S12 (Supporting information), the introduction of InP QDs promotes the generation of ·OH. Nevertheless, the humidity is controlled under 2% in the photocatalytic NO oxidation test, which is reported in our previous work [41]. This indicates that there are few H2O molecules existing in the reaction process, resulting in the few ·OH generated. Hence, O2·- is considered to the main active species during the process of photocatalytic oxidation reaction. Furthermore, the effect of InP QDs in the dissociation of O—O bond is explored by DFT calculations as presented in Fig. S13 (Supporting information). According to the previous work, the broken of O—O bond in O2 molecule is needed to overcome a high energy barrier of 5.20 eV [42]. For pure g-C3N4, the dissociation energy of O—O bond is 4.61 eV. After introducing InP QDs, the dissociation energy is highly decreased by 2.26 eV, manifesting 2-fold enhancement than that on pure g-C3N4 surface. In brief, the molecular oxygen activation and the dissociation of O—O bond are facilitated with the introduction of InP QDs and its activation can be further promoted to generate O2·- under light illumination.

|
Download:
|
| Fig. 3. (a) Molecular oxygen adsorption configures on g-C3N4 and InP/g-C3N4, (b) DMPO spin-trapping ESR spectra (O2·-) of g-C3N4 and 0.5%InP QDs/g-C3N4 compound under visible-light illumination (λ > 420 nm). | |
Based on the above results, the process of NO oxidation is simulated as shown in Fig. S14 (Supporting information) by DFT calculations. When NO adsorbs on the surface, it can combine with the adsorbed O2 to spontaneously convert into O—O—N—O intermediate. Hence, NO conversion to NO2 only needs to overcome an energy of 0.29 eV. When NO2 further converts to NO3-, a higher energy barrier of 2.92 eV is required. More interestingly, the energy barrier of NO direct conversion to NO3- is only 0.57 eV, which is slightly higher than that of NO2 generation. It is indicated that NO prefers to combine with the adsorbed molecular oxygen to form O—O—N—O intermediate and directly convert into NO3-. This explains the reason that the main product is NO3- observed in photocatalytic NO removal evaluations.
In summary, we successfully design and construct the InP QDs and g-C3N4 compounds. With the introduction of InP QDs, the recombination of photogenerated charges is effectively suppressed, which identified by both theoretical and experimental results. More importantly, the InP QDs works as the active site to capture molecular oxygen. The adsorbed molecular oxygen is bonded with InP-QDs, resulting that it can obtain ample electrons. Furthermore, the light illumination can further promote the activation of molecular oxygen to generate O2·-. The existence of O2·- promotes the formation of O—O—N—O intermediate. Benefiting from this, the NO can directly convert into NO3-. Consequently, the NO removal ratio is almost double increased after InP QDs loaded and NO2 generation is highly inhibited.
Declaration of competing interestThe authors declare that they have no known competing financial interests or personal relationships that could have appeared to influence the work reported in this paper.
AcknowledgmentsThis work is supported by the National Natural Science Foundation of China (No. U1862111), Sichuan Science and Technology Program (No. 2020ZDZX0008), Sichuan Provincial International Cooperation Project (No. 2019YFH0164), International Collaboration Project of Chengdu City (No. 2017-GH02-00014- HZ), Graduate Scientific Research Innovation Foundation of SWPU (No. 2019cxyb013) and Cheung Kong Scholars Programme of China. This work acknowledges the National Supercomputing Center in Shenzhen for the calculations support.
Appendix A. Supplementary dataSupplementary material related to this article can befound, in the online version, at doi:https://doi.org/10.1016/j.cclet.2020.07.032.
| [1] |
M. Schreck, M. Niederberger, Chem. Mater. 31 (2019) 597-618. DOI:10.1021/acs.chemmater.8b04444 |
| [2] |
J. Zhao, X. Yang, Build. Environ. 38 (2003) 645-654. DOI:10.1016/S0360-1323(02)00212-3 |
| [3] |
Y. Huang, P. Wang, Z. Wang, et al., Appl. Catal. B:Environ. 240 (2019) 122-131. DOI:10.1016/j.apcatb.2018.08.078 |
| [4] |
Y. Lu, Y. Huang, J. Cao, et al., J. Mater. Chem. A 7 (2019) 15782-15793. DOI:10.1039/C9TA03504D |
| [5] |
Z. Zhao, Y. Cao, F. Dong, et al., Nanoscale 11 (2019) 6360-6367. DOI:10.1039/C8NR10356A |
| [6] |
R. Zhang, C. Li, A. Zhang, Y. Zhou, Mater. Rep. 34 (2020) 3001-3016. |
| [7] |
Z. Wei, B. Ding, H. Dou, et al., Chin. Chem. Lett. 30 (2019) 2110-2122. DOI:10.1016/j.cclet.2019.11.022 |
| [8] |
M. Ding, J. Zhou, H. Yang, et al., Chin. Chem. Lett. 31 (2020) 71-76. DOI:10.1016/j.cclet.2019.05.029 |
| [9] |
P. Christopher, H. Xin, S. Linic, Nat. Chem. 3 (2011) 467-472. DOI:10.1038/nchem.1032 |
| [10] |
R. Zhang, T. Ran, Y. Cao, et al., Chem. Eng. J. 382 (2020) 123029. DOI:10.1016/j.cej.2019.123029 |
| [11] |
Y. Zhao, W. Ma, Y. Li, et al., Angew. Chem. Int. Ed. 51 (2012) 3188-3192. DOI:10.1002/anie.201107149 |
| [12] |
E. Wahlström, E.K. Vestergaard, R. Schaub, et al., Science 303 (2004) 511-513. DOI:10.1126/science.1093425 |
| [13] |
K. Zhao, L. Zhang, J. Wang, et al., J. Am. Chem. Soc. 135 (2013) 15750-15753. DOI:10.1021/ja4092903 |
| [14] |
R.D. Harris, S. Bettis Homan, M. Kodaimati, et al., Chem. Rev. 116 (2016) 12865-12919. DOI:10.1021/acs.chemrev.6b00102 |
| [15] |
D.V. Talapin, J.S. Lee, M.V. Kovalenko, E.V. Shevchenko, Chem. Rev. 110 (2010) 389-458. DOI:10.1021/cr900137k |
| [16] |
R. Wang, X. Kong, W. Zhang, et al., Appl. Catal. B:Environ. 225 (2018) 228-237. DOI:10.1016/j.apcatb.2017.11.060 |
| [17] |
K. Wu, T. Lian, Chem. Soc. Rev. 45 (2016) 3781-3810. DOI:10.1039/C5CS00472A |
| [18] |
G. Fan, C. Wang, J. Fan, Nano Today 9 (2014) 69-84. DOI:10.1016/j.nantod.2014.02.007 |
| [19] |
V. Brunetti, H. Chibli, R. Fiammengo, et al., Nanoscale 5 (2013) 307-317. DOI:10.1039/C2NR33024E |
| [20] |
S. Yu, X.B. Fan, X. Wang, et al., Nat. Commun. 9 (2018) 4009. DOI:10.1038/s41467-018-06294-y |
| [21] |
S. Yu, Z. Xie, M. Ran, et al., J. Colloid Inter. Sci. 573 (2020) 71-77. DOI:10.1016/j.jcis.2020.03.110 |
| [22] |
J. Zhou, Y. Yang, C.Y. Zhang, Chem. Rev. 115 (2015) 11669-11717. DOI:10.1021/acs.chemrev.5b00049 |
| [23] |
H. Yu, R. Shi, Y. Zhao, et al., Adv. Mater. 28 (2016) 9454-9477. DOI:10.1002/adma.201602581 |
| [24] |
A. Boulesbaa, K. Wang, M. Mahjouri-Samani, et al., J. Am. Chem. Soc. 138 (2016) 14713-14719. DOI:10.1021/jacs.6b08883 |
| [25] |
D. Jiang, X. Du, L. Zhou, H. Li, K. Wang, Anal. Chem. 89 (2017) 4525-4531. DOI:10.1021/acs.analchem.6b04949 |
| [26] |
W.J. Ong, L.L. Tan, Y.H. Ng, S.T. Yong, S.P. Chai, Chem. Rev. 116 (2016) 7159-7329. DOI:10.1021/acs.chemrev.6b00075 |
| [27] |
N. Tian, K. Xiao, Y. Zhang, et al., Appl. Catal. B:Environ. 253 (2019) 196-205. DOI:10.1016/j.apcatb.2019.04.036 |
| [28] |
X. Wang, K. Maeda, A. Thomas, et al., Nat. Mater. 8 (2009) 76-80. DOI:10.1038/nmat2317 |
| [29] |
Y. Fang, X. Wang, Chem. Commun. 54 (2018) 5674-5687. DOI:10.1039/C8CC02046A |
| [30] |
L. Zhang, N. Ding, J. Wu, et al., Catal. Sci. Technol. 8 (2018) 3846-3852. DOI:10.1039/C8CY00970H |
| [31] |
D. Ni, Y. Zhang, Y. Shen, S. Liu, Y. Zhang, Chin. Chem. Lett. 31 (2020) 115-118. DOI:10.1016/j.cclet.2019.04.068 |
| [32] |
Y. Yang, Y. Tang, H. Jiang, et al., Chin. Chem. Lett. 30 (2019) 2089-2109. DOI:10.1016/j.cclet.2019.10.041 |
| [33] |
Y. Zhong, W. Chen, S. Yu, et al., ACS Omega 3 (2018) 17762-17769. DOI:10.1021/acsomega.8b02585 |
| [34] |
K. Wang, G. Zhang, J. Li, Y. Li, X. Wu, ACS Appl. Mater. Interfaces 9 (2017) 43704-43715. DOI:10.1021/acsami.7b14275 |
| [35] |
M. Ou, W. Tu, S. Yin, et al., Angew. Chem. Int. Ed. 130 (2018) 13758-13762. DOI:10.1002/ange.201808930 |
| [36] |
Y. Jiao, Q. Huang, J. Wang, Z. He, Z. Li, Appl. Catal. B:Environ. 247 (2019) 124-132. DOI:10.1016/j.apcatb.2019.01.073 |
| [37] |
W. Wan, S. Yu, F. Dong, Q. Zhang, Y. Zhou, J. Mater. Chem. A 4 (2016) 7823-7829. DOI:10.1039/C6TA01804A |
| [38] |
M.D. Segall, J.D.L. Philip, M.J. Probert, et al., J. Phys. Condens. Matter 14 (2002) 2717-2744. DOI:10.1088/0953-8984/14/11/301 |
| [39] |
J.P. Perdew, K. Burke, M. Ernzerhof, Phys. Rev. Lett. 77 (1996) 3865-3868. DOI:10.1103/PhysRevLett.77.3865 |
| [40] |
J.A. White, D.M. Bird, Phys. Rev. B 50 (1994) 4954-4957. DOI:10.1103/PhysRevB.50.4954 |
| [41] |
F. Wu, Z. Zhao, B. Li, F. Dong, Y. Zhou, J. Inorg. Mater. 35 (2020) 541-548. DOI:10.15541/jim20190325 |
| [42] |
J.S. Binkley, M.J. Frisch, Int. J. Quantum Chem. 24 (1983) 331-337. |