 2020, Vol. 31


b Guangling College, Yangzhou University, Yangzhou 225002, China
Hydroxyl radical (·OH) in the atmosphere initiated the oxidation of a number of species and governed the lifetime of almost all organic compounds [1, 2]. The concentration of ·OH in the atmosphere reflected source differences from solar intensity and precursor levels [3]. The detection of hydroxyl radicals (·OH) could tell us the precursor levels of atmospheric species, and thus help us control air pollution. However, the extremely low concentration of ·OH in the atmosphere made its detection very difficult and time-consuming. Some expensive and sophisticated equipment [4-6] are need. These instruments are not suited for routine field employment. Developing fast and convenient methods for atmospheric ·OH detection is still a challenge. Our previous work [7] provided a simple protocol for the detection of ·OH in atmosphere. This work used salicylic acid (SA) impregnated carbon fiber paper (CFP) as the ·OH trapping and detection material simultaneously. However, the sampling time in the reported work is long because of the limited sensitivity of the proposed sensor. For in-situ analysis, it is better to improve the sensitivity of the sensor and shorten the sampling time.
Surface modifications have been proved to be effective for improving the sensitivity of electrochemical sensors [8]. If suitable materials were modified on CFP, the adsorption amount of SA, the trapping efficiency of ·OH and the reaction time between ·OH and the probe SA could be improved, thus the sensitivity of sensors would be improved. Covalent organic frameworks (COFs) which were firstly introduced by Yaghi [9] possessed relatively excellent thermal and chemical stability, low-density framework, permanent porosity and high specific surface area [10-13]. These appealing properties of COFs made them as good materials for gas adsorption and storage [14, 15] industrially relevant compounds isolation [16, 17], organic dyes adsorption [18], and drug delivery, etc. [19]. Recently, a kind of COF prepared by mechanochemical process was used as a luminescent probe for the determination of ·OH in living systems [20]. Herein, we reported for the first time that COFs obtained from 1, 3, 5-triformylphloroglucinol (Tp) and benzidine (BD) by a simple solvothermal process could be employed as the modification layer on CFP to impregnate SA for capturing ·OH efficiently. The Tp-series of COFs features high water stability, a prerequisite for environmental applications [21, 22], and has an enhanced adsorption affinity to trapping SA by O—H···OC and N—H···OC hydrogen bonds. Scheme 1 illustrated that SA impregnated on COF(TpBD)-CFP-NH2 would react with ·OH in the air to produce the electroactive product, 2, 5-dihydroxybenzoic acid (2, 5-DHBA). By checking the electrochemical signal of 2, 5-DHBA, ·OH in the atmosphere can be determined [23]. This method has been applied for the detection of ·OH under different weather conditions, providing important application value for the routine air monitoring.

|
Download:
|
| Scheme 1. Schematic illustration of the structure of COF(TpBD) and its application for SA impregnation and ·OH detection. | |
COFs were modified on a CFP via a simple solvothermal method [24, 25]. Before modification, CFP was treated by a solution (H2O2: NH3·H2O:H2O = 1:1:5) at 90 ℃ for 2 h, and then dipped in 20 mL of acetone which contained 14 μL of (3-aminopropyl)-triethoxysilane (APTES) for 3 h to obtain the amino functionalized CFP (NH2-CFP).
For COF functionalization, the NH2-CFP was solvothermally treated in a solution containing 10.5 mg of Tp and 13.6 mg of BD with 1, 4-dioxane and mesitylene as the solvent at 120 ℃ for 24 h, and then washed with 1, 4-dioxane and acetone before characterizations or use. For SA impregnation, 5.0 μL of SA solution (0.01 mol/L in ethanol) was sprayed evenly onto the surface of the COF(TpBD)-CFP-NH2 and then was left to dry. The experiment details were provided in the Supporting information.
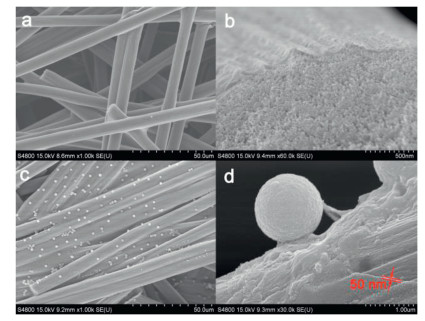
The microstructures of CFP-NH2 (Figs. 1a and b) and COF(TpBD)-CFP-NH2 (Figs. 1c and d) were shown in Fig. 1 with different magnifications. Fig. 1a showed that the diameter of CFP was about 8 μm. After the modification by COF, the morphology of CFP changed a little but became rougher. Moreover, small spheres were observed on the top of CFP-NH2 (Fig. 1c). Compared with the magnification image of CFP-NH2 in Fig. 1b, Fig. 1d confirmed the formation of COF(TpBD) film on the CFP with the thickness about 50 nm. The attachments of the spheres to the film could be observed clearly. The slightly excess amount of Tp and BD in the reaction system during COF(TpBD) preparation process would produce small amount of COF oligomers with less monomers. These oligomers preferred the vertical but not the lateral growth which would produce some spheres [26]. To shed light on the growth process of COF(TpBD) on CFP, we examined the effect of the precursor concentration on the COF film morphology. Fig. S1 (Supporting information) showed the SEM image of the COF (TpBD)-CFP-NH2 prepared by changing the concentrations of Tp and BD but keeping their molar ratio constant (Table S1 in Supporting information). When the concentrations of Tp and BD were less than 30X, films were formed on the surface of CFP-NH2. When the concentrations of Tp and BD were up to 40X and 50X, the aggregation of COF(TpBD) would be observed, resulting their uneven distribution on CFP-NH2.

|
Download:
|
| Fig. 1. SEM images of (a, b) CFP-NH2 and (c, d) COF(TpBD)-CFP-NH2 at (a, c) low magnification and (b, d) high magnification. | |
Fig. 2 showed the X-ray diffraction (XRD) patterns of COF(TpBD) powder, CFP-NH2, COF(TpBD)-CFP-NH2 and SA-COF(TpBD)-CFP-NH2, respectively. The strong peak at 26.4° was only observed when CFP was present, so it was assigned to CFP. The peak at 3.3° (2θ) was observed on COF(TpBD) powder, COF(TpBD)-CFP-NH2 and SA-COF(TpBD)-CFP-NH2 samples. It was attributed to the (100) plane diffractions of COF(TpBD) [27, 28], indicating the formation of COF(TpBD) on CFP and its good crystallinity. No distinct differences between COF(TpBD)-CFP-NH2 and SA-COF(TpBD)-CFP-NH2 were observed, indicated that the impregnation of SA had no effect on the structure of COF(TpBD).

|
Download:
|
| Fig. 2. XRD patterns of COF(TpBD), CFP-NH2, COF(TpBD)-CFP-NH2 and SA-COF (TpBD)-CFP-NH2. | |
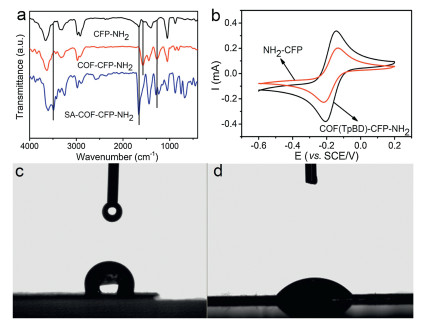
The formation of COFs on CFP was verified with FT-IR spectroscopy. Fig. 3a showed the FT-IR spectra of CFP-NH2, COF (TpBD)-CFP-NH2 and SA-COF(TpBD)-CFP-NH2. Compared the differences between the FT-IR spectra of CFP-NH2 and COF (TpBD)-CFP-NH2, it can be observed that COF(TpBD)-CFP-NH2 showed the strong absorption peaks at 1584 cm-1 and 1253 cm-1. The two peaks were contributed to the C=C stretching and the C—N stretching modes, respectively [24]. The disappearances of the absorption peak corresponding to the C=O stretching (1900-1639 cm-1) of Tp suggested the fully condensation of the product [24]. A characteristic peak at the range of 3650-3200 cm-1 was observed on SA-COF(TpBD)-CFP-NH2 which corresponded to the O—H stretching vibration [29], indicating that SA was successfully impregnated on COF(TpBD)-CFP-NH2. The C=O stretching of SA at the range of 1900-1639 cm-1 and the CC stretching of COF(TpBD) were close to each other, so they merged into the characteristic peak located at 1660 cm-1.

|
Download:
|
| Fig. 3. (a) The FR-IR spectrum of CFP-NH2, COF(TpBD)-CFP-NH2 and SA-COF(TpBD)-CFP-NH2; (b) CV of NH2-CFP and COF(TpBD)-CFP-NH2 in a solution containing 1 mmol/L K3[Fe(CN)6] and K4[Fe(CN)6] and 0.1 mol/L KCl. Scan rate: 100 mV/s; Photographs of water droplet shape on (c) CFP-NH2 and (d) COF(TpBD)-CFP-NH2. | |
Cyclic voltammetry (CV) measurements were performed to check the electroactive surface areas of NH2-CFP and COF(TpBD)- CFP-NH2 [30]. Fig. 3b showed the CV curves of NH2-CFP and COF (TpBD)-CFP-NH2. A pair of distinct oxidation and reduction peaks were observed for both NH2-CFP and COF(TpBD)-CFP-NH2 in the studied potential range. The peak were attributed to the [Fe(CN)6]3-/4- redox reaction. According to the Randles-Sevcik equation [31], the surface area COF(TpBD)-CFP-NH2 was 1.761 cm2, but that of NH2-CFP was 1.178 cm2. This meant that COF(TpBD)-CFP-NH2 provided more electroactive surface area for impregnating SA.
The water contact angle (CA) measurements were used to character the effect of COF(TpBD) on the wetting properties of CFPs. When a water was dropped on the surface of NH2-CFP, the contact angle was 78.1° ±1.0° (Fig. 3c). It dropped to 43.8° ± 1.0° for COF(TpBD)-CFP-NH2 (Fig. 3d). This means that COF(TpBD) has distinct effect on the wetting properties of CFP. SA has a hydrophobic benzene ring as well as a hydrophilic hydroxyl and carboxyl group [32]. It is hydrophobic portion would be stuck in a hole of COF(TpBD) while the hydrophilic portion of SA is more inclined to form hydrogen bond with O=C and -NH2 of COF(TpBD), and hence a much more enhanced adsorption of SA would be achieved on COF(TpBD)-CFP-NH2. The improved hydrophility of CFP improved the adsorption affinity to the trapping agent SA with hydrophilic portions [33] and improved the ability to detect atmospheric ·OH.
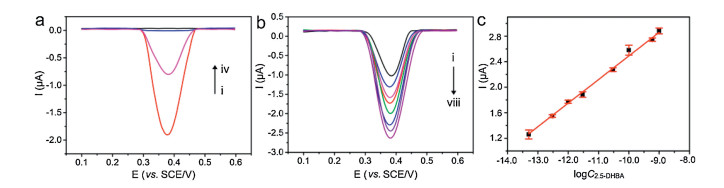
The feasibility of COF(TpBD)-CFP-NH2 for the detection of ·OH in air was evaluated. Fig. 4a showed the differential pulse voltammetry (DPV) responses of SA-COF(TpBD)-CFP-NH2 (curve ⅰ), SACFP-NH2 (curve ⅱ) and COF(TpBD)-CFP-NH2 (curve ⅲ) after being purged by the outdoor air for 30 min. Furthermore, we also checked the DPV response of SA-COF(TpBD)-CFP-NH2 after being purged by N2 for 30 min (curve ⅳ). Distinct peaks with potential of 0.38 eV were only observed on SA-COF(TpBD)-CFP-NH2 and SACFP-NH2 after purging the outdoor air. This peak was due to the reduction of 2, 5-DHBA, which was formed from the reaction between ·OH and SA [34]. This indicated the importance of SA impregnation for the determination of ·OH in the atmosphere. ·OH presented in the air would react with SA on COF(TpBD)-CFP-NH2 to produce the electroactive 2, 5-DHBA which could be used for the indirect determination of ·OH. The peak current on SA-COF(TpBD)- CFP-NH2 (curve ⅰ) was 2.4 times as much as that on SA-CFP-NH2 (curve ⅱ), indicating the high sensitivity of COF(TpBD)-CFP-NH2 for ·OH detection.

|
Download:
|
| Fig. 4. (a) DPV curves of SA-COF(TpBD)-CFP-NH2 (curve ⅰ), SA-CFP-NH2 (curve ⅱ) and COF(TpBD)-CFP-NH2 (curve ⅲ) in phosphate buffer saline after purging outdoor air; DPV curve of SA-COF(TpBD)-CFP-NH2 after being purged by N2 for 30 min (curve ⅳ). (b) DPV responses of different concentrations of 2, 5-DHBA on COF(TpBD)-CFP-NH2. From ⅰ to ⅷ: 5.0 × 10⁻¹⁴, 3.0 × 10⁻¹³, 1.0 × 10⁻¹², 3.0 × 10⁻¹², 3.0 × 10⁻¹¹, 1.0 × 10⁻¹⁰, 6.0 × 10⁻¹⁰ and 1.0 × 10⁻⁹ mol/L. (c) The calibration plot of the DPV peak currents vs. the concentration (mol/L) of 2, 5-DHBA (average peak currents, n = 5). | |
The previous work has indicated that the reaction between SA with ·OH could produce the electroactive 2, 5-DHBA which could be used to probe the concentration of ·OH. So, the analytical performance of the COF(TpBD)-CFP-NH2 to 2, 5-DHBA was studied firstly. Fig. 4b showed that DPV peak currents increased with increasing 2, 5-DHBA concentration. A linearity between the reduction peak currents and the concentration of 2, 5-DHBA in the range of 5.0 × 10⁻¹⁴ mol/L to 1.0 × 10⁻⁹ mol/L was obtained, as was shown in Fig. 4c. The detection limit of COF(TpBD)-CFP-NH2 for 2, 5-DHBA was down to 6.9 × 10⁻¹⁵ mol/L (S/N = 3). It was corresponded to the concentration range for ·OH was from 3.0 × 10⁷ to 6.0 × 10¹¹ molecules/cm3 and the detection limit was down to 4.1 × 10⁶ molecules/cm3. Table S2 (Supporting information) compared the linear range and the detection limit of 2, 5-DHBA of this method to the other reported works. It indicates that the COF(TpBD)-CFP-NH2 has lower detection limit than most of the previous reports, which means the determination of ·OH in the atmosphere can be measured quickly and effectively in a shorter time.
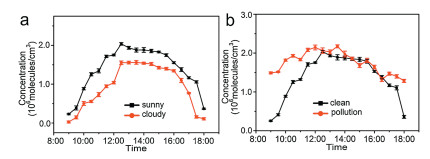
This procedure was applied to measure atmospheric ·OH under different weather conditions in Yangzhou by five repeated experiments. The concentration of ·OH in the atmosphere [·OH] (molecules/cm3) can be estimated from the concentration of 2, 5-DHBA by using an equation (Eq. S1 in Supporting information) provided in the supporting information. In this work, the sampling time was set to 30 min. Fig. 5a showed that the concentration of ·OH in sunny day was slightly higher than that in cloudy day, which proved the effect of light intensity on the concentration of ·OH. The maximum amount of ·OH concentrations appeared from 12:00 to 13:00 because O3 photolysis and HNO2 photolysis were the main ·OH generation processes. The generation rates of ·OH by the two processes were related to light intensity. Fig. 5b showed the concentration of ·OH in haze weather was higher than sunny weather, especially in the morning and evening when pollution was relatively serious. After the hazed dissipates at noon, the concentration of ·OH returned to the normal level, which indicated that the presence of a large number of volatile organic compounds (VOCs) in haze weather had a certain impact on the concentration of ·OH due to air pollution [35, 36].

|
Download:
|
| Fig. 5. (a) The change profiles of ·OH concentration in sunny day and cloudy day; (b) The change profiles of ·OH concentration in clean weather and pollution weather (average concentration, n = 5). | |
This work provided a sensitive method for the detection of ·OH in the atmosphere. COF(TpBD) with hydrophilic nature was firstly introduce into the modification of electrode, which enhanced the specific surface area of CFP, and improved the sensitivity of the sensor. This method has been successfully applied for the detection of ·OH under different conditions of Yangzhou, which proved the relationship between the concentration of ·OH and weather, and also proved that light intensity was one of the most important factors which influencing the concentration of ·OH. The method of using COF(TpBD)-CFP-NH2 to detect ·OH concentration has the advantages of high sensitivity, simple operation, and strong stability, which provides an important application value for routine air monitoring.
Declaration of competing interestThe authors declare that they have no known competing financial interests or personal relationships that could have appeared to influence the work reported in this paper.
AcknowledgmentsWe gratefully thank the National Natural Science Foundation of China (Nos. 21575124 and 21675140), the 14th Six Talent Peaks Project in Jiangsu Province (No. SWYY-085), Young Academic Leaders of Jiangsu Province (2018), the project funded by the PAPD and TAPP. We also thank the Test Center of Yangzhou University for the SEM, FT-IR and CA characterizations.
Appendix A. Supplementary dataSupplementary material related to this article can be found, in the online version, at doi:https://doi.org/10.1016/j.cclet.2020.06.017.
| [1] |
B.J. Finlayson-Pitts, M.J. Ezell, T.M. Jayaweera, H.N. Berko, C.C. Lai, Geophys. Res. Lett. 19 (1992) 1371-1374. DOI:10.1029/92GL01279 |
| [2] |
A. Zhu, Y. Guo, G. Liu, et al., Chin. Chem. Lett. 30 (2019) 2241-2244. DOI:10.1016/j.cclet.2019.09.003 |
| [3] |
D.J. Cooper, J. Atmos. Chem. 25 (1996) 97-113. DOI:10.1007/BF00053287 |
| [4] |
H. Fuchs, H.P. Dorn, M. Bachner, et al., Atmos. Meas. Tech. 5 (2012) 1611-1626. DOI:10.5194/amt-5-1611-2012 |
| [5] |
H. Chen, R. Hu, P. Xie, et al., J. Environ. Sci. 65 (2018) 190-200. DOI:10.1016/j.jes.2017.03.012 |
| [6] |
H. Berresheim, C. Plass-Dülmer, T. Elste, N. Mihalopoulos, F. Rohrer, Atmos. Chem. Phys. 3 (2003) 639-649. DOI:10.5194/acp-3-639-2003 |
| [7] |
Z. Huang, Z. Ji, P. Yin, et al., Electrochem. Commun. 100 (2019) 113-116. DOI:10.1016/j.elecom.2019.02.008 |
| [8] |
N. Sandhyarani, Chapter 3: Surface modification methods for electrochemical biosensors, in: A.A. Ensafi (Ed.), Electrochemical Biosensors, Elsevier, Amsterdam, 2019, pp. 45-75.
|
| [9] |
A.P. Côté, A.I. Benin, N.W. Ockwig, et al., Science 310 (2005) 1166-1170. DOI:10.1126/science.1120411 |
| [10] |
U. Díaz, A. Corma, Coord. Chem. Rev. 311 (2016) 85-124. DOI:10.1016/j.ccr.2015.12.010 |
| [11] |
N. Huang, P. Wang, D. Jiang, Nat. Rev. Mater. 1 (2016) 16068. DOI:10.1038/natrevmats.2016.68 |
| [12] |
A.G. Slater, A.I. Cooper, Science 348 (2015) 6238. |
| [13] |
X. Zhuang, Y. Mai, D. Wu, F. Zhang, X. Feng, Adv. Mater. 27 (2015) 403-427. DOI:10.1002/adma.201401857 |
| [14] |
N. Huang, X. Chen, R. Krishna, D. Jiang, Angew. Chem. Int. Ed. 54 (2015) 2986-2990. DOI:10.1002/anie.201411262 |
| [15] |
Y. Ding, Y. Wang, Y. Su, et al., Chin. Chem. Lett. 31 (2020) 193-196. DOI:10.1016/j.cclet.2019.05.012 |
| [16] |
M.S. Lohse, T. Stassin, G. Naudin, et al., Chem. Mater. 28 (2016) 626-631. DOI:10.1021/acs.chemmater.5b04388 |
| [17] |
N. Liu, L. Shi, X. Han, et al., Chin. Chem. Lett. 31 (2020) 386-390. DOI:10.1016/j.cclet.2019.06.050 |
| [18] |
X. Zhu, S. An, Y. Liu, et al., AIChE J. 63 (2017) 3470-3478. DOI:10.1002/aic.15699 |
| [19] |
V.S. Vyas, M. Vishwakarma, I. Moudrakovski, et al., Adv. Mater. 28 (2016) 8749-8754. DOI:10.1002/adma.201603006 |
| [20] |
W. Liu, Y. Cao, W. Wang, et al., Chem. Commun. 55 (2019) 167-170. DOI:10.1039/C8CC07783E |
| [21] |
B.P. Biswal, S. Kandambeth, S. Chandra, et al., J. Mater. Chem. A 3 (2015) 23664-23669. DOI:10.1039/C5TA07998E |
| [22] |
H. Yang, H. Wu, F. Pan, et al., J. Membr. Sci. 520 (2016) 583-595. DOI:10.1016/j.memsci.2016.08.022 |
| [23] |
X. Chen, K. Mopper, J. Atmos. Chem. 36 (2000) 81-105. DOI:10.1023/A:1006313021834 |
| [24] |
X. Gou, Q. Zhang, Y. Wu, et al., RSC Adv. 6 (2016) 39198-39203. DOI:10.1039/C6RA07417K |
| [25] |
J. Tan, S. Namuangruk, W. Kong, et al., Angew. Chem. Int. Ed. 55 (2016) 13979-13984. DOI:10.1002/anie.201606155 |
| [26] |
H. Li, A.D. Chavez, H. Li, et al., J. Am. Chem. Soc. 139 (2017) 16310-16318. DOI:10.1021/jacs.7b09169 |
| [27] |
B.P. Biswal, S. Chandra, S. Kandambeth, et al., J. Am. Chem. Soc. 135 (2013) 5328-5331. DOI:10.1021/ja4017842 |
| [28] |
C.X. Yang, C. Liu, Y.M. Cao, X.P. Yan, Chem. Commun. 51 (2015) 12254-12257. DOI:10.1039/C5CC03413B |
| [29] |
X. He, X. Liu, B. Nie, D. Song, Fuel 206 (2017) 555-563. DOI:10.1016/j.fuel.2017.05.101 |
| [30] |
L. Wang, J. Li, M. Feng, et al., Biosens. Bioelectron. 96 (2017) 220-226. DOI:10.1016/j.bios.2017.05.004 |
| [31] |
B.L. Funt, P.M. Hoang, J. Electrochem. Soc. 131 (1984) 2295-2298. DOI:10.1149/1.2115243 |
| [32] |
X. Wang, X. Liang, J. Huang, Y. Liu, AIChE J. 60 (2014) 2636-2643. DOI:10.1002/aic.14429 |
| [33] |
B. Sun, M. Skyllas-Kazacos, Electrochim. Acta 37 (1992) 1253-1260. DOI:10.1016/0013-4686(92)85064-R |
| [34] |
H. Beginejad, D. Nematollahi, F. Varmaghani, H. Shayani-Jam, Monatsh. Chem. Chem. Month. 144 (2013) 1481-1488. DOI:10.1007/s00706-013-1031-6 |
| [35] |
L. Hui, X. Liu, Q. Tan, et al., Atmos. Environ. 192 (2018) 55-71. DOI:10.1016/j.atmosenv.2018.08.042 |
| [36] |
A. Kumar, D. Singh, K. Anandam, K. Kumar, V.K. Jain, Air Qual. Atmos. Health 10 (2017) 885-896. DOI:10.1007/s11869-017-0478-8 |