 2020, Vol. 31

b School of Materials Science and Energy Engineering, Foshan University, Foshan 528000, China
The widespread utilization of fossil fuels has not only exacerbated the energy crisis, but also led to environmental pollution and global warming issues. It is significant to develop clean and stable energy. Ethanol is a renewable green energy source with high energy density, which can be produced in large scale from biomass. Direct ethanol fuel cells (DEFCs) generate power from ethanol oxidation reaction at the present of catalyst, which play important roles in electrochemical energy conversion [1]. However, the performance of DEFCs has been heavily dependent on the electrocatalyst. Therefore, the development of low-cost electrocatalyst with superior catalytic activity and stability is of great significance for promoting the commercialization of DEFCs [2]. Platinum (Pt) has been widely applied as anode catalyst in DEFCs attributed to the high catalytic activity. Since the empty d orbitals and unpaired d electrons of Pt, it can combine with ethanol molecules with appropriate strength (electronic effect) [3-6]. However, pure Pt was not an effective anode catalyst for ethanol electro-oxidation at low temperatures [7, 8], due to the poisoning inactivation after the adsorption of some surface intermediates, especially CO [2, 9]. The poisonous species could be removed by introducing a second metallic specie, such as Ru [10-12], Sn [13-16], Rh [17-19] and Au [20-22]. The toxic intermediates can be adsorbed at lower potentials, thus minimizing surface poison and improving oxidation performance of Pt as anode catalyst. Among the alloy catalysts, PtRu and PtSn alloy have been currently recognized as the most effective catalysts for the ethanol oxidation. Comparing with Ru, Sn was earth-abundant metal, and PtSn alloy was also beneficial to the fracture of C-C bonds in ethanol molecules, which make Sn a favorable metal specie for Pt alloy [23, 24].
Morphology has been another crucial factor for influencing the performance of electro-catalysts. Many studies have reported the PtSn nanocrystals with different morphologies for ethanol oxidation reaction (EOR). For example, Pt-Sn nano-cubes with a Pt-skin surface improved the density of Pt (100) sites, contributing to the cleavage of C-C bonds in ethanol [25]. Networked Pt-Sn nanowires with large surface area and a number of defects exhibited high activities towards EOR [26]. However, the catalytic performance has been largely impaired due to the agglomeration of particles and leaching of Sn.
In order to improve the performance and stability of the PtSn catalyst, we developed an effective route for preparing PtSn catalysts with three-dimensional (3D) porous nanostructure. The catalyst was composed of self-supported Sn skeleton, which anchored the alloy nanoparticles that formed latter. Firstly, the 3D porous PtSn nano-catalyst exhibited low relative density and high specific surface area [27, 28]. Secondly, the support material was not necessary, which effectively avoided the corrosion of the carriers and improved the stability [29]. Finally, the extended leaching time of Sn can further improve the durability. Herein, PtSn alloy catalysts with various compositions were synthesized and systematically characterized. The electrocatalytic performance for ethanol electro-oxidation has been carefully demonstrated with cyclic voltammetry, chronoamperometry and CO stripping in acid solution. It revealed that Pt73Sn27 exhibited much better catalytic activity and higher stability compared to that of commercial Pt/C catalyst. The elaborately designed bimetal nano-catalyst with innovative structure has significantly promoted the potential applications of PtSn catalyst in DEFCs.
The PtSn catalysts with different compositions were synthesized with the following strategy. Firstly, a certain amount of 0.0313 mol/L Na2SnO3·3H2O (Aladdin Chemistry Co., Ltd., Shanghai, China) and C6H12O6·H2O (Sinopharm Chemical Reagent Co., Ltd., Beijing, China) was added to 10 mL deionized water under vigorous magnetic stirring at room temperature until a homogeneous solution was obtained. Then, an appropriate amount of 0.01 mol/L freshly prepared NaBH4 solution (Sinopharm Chemical Reagent Co., Ltd., Beijing, China) was added dropwise as the reducing agent. Next, a calculated volume of 0.0313 mol/L H2PtCl6 (Sinopharm Chemical Reagent Co., Ltd., Beijing, China) solution was added into the previous solution while stirring, followed by adding NaBH4 solution to reduce metal precursors and then stirring for another 1 h. Finally, the product was centrifuged and washed several times with deionized water. The specific amount of each reagent can be found in Table S1 (Supporting information).
The morphology and elemental composition of PtSn catalysts were determined by scanning electron microscopy (SEM, Hitachi-S4800) and energy dispersive X-ray spectrometers (EDS, Horiba 7021-H). Transmission electron microscope (TEM) was made by JEOL 2100 at 200 kV. The structure was characterized with selected area electron diffraction (SAED). The uniformity of the samples was studied by high-angle annular dark-field scanning TEM (HAADF-STEM) imaging and EDS. The crystallographic data of the catalysts were determined by Shimadzu XRD-6100 (Cu-Kα radiation, λ =0.154059 nm, 40 kV, 30 mA). Valence state and surface composition was analyzed with X-ray photoelectron spectroscopy (XPS, Escalab 250Xi).
The catalytic activity of catalysts is characterized by electrochemical methods. PtSn catalyst modified electrodes were prepared as following. A certain composition of PtSn catalyst (2 mg) was resuspended in 2.0 mL deionized water, ultrasonicating for approximately 1 h to form aqueous solution with the concentration of 1 mg/mL. The catalyst ink (20 μL) was deposited on 5 mm glassy-carbon disk electrodes which had been carefully polished with 0.05 and 0.1 μm alumina powder and then rinsed with deionized water. The electrodes were allowed to dry at room temperature.
Electrochemical performance was tested on CHI 660E (Chenhua Instruments Crop, Shanghai, China) in three-electrode system, i.e., with PtSn catalyst modified electrode as working electrode, Pt foil as counter electrode and saturated calomel electrode (SCE) as reference electrode under ambient conditions. Electrocatalytic activity of PtSn catalyst for EOR were evaluated by cyclic voltammetry (CV) in 0.1 mol/L HClO4 + 0.5 mol/L C2H5OH solution from 0.012 V to 1.56 V at a scanning rate of 50 mV/s. And the electrochemical surface area (ECSA) was measured by a stable curve that performed in 0.1 mol/L HClO4 solution. The chronoam-perograms (CA) curves (i-t) were measured at 0.87 V for 7200 s. CO stripping experiments were performed at 0.05 V/s in perchloric acid solution. All the potential values were relative to reverse hydrogen electrode (RHE) here.
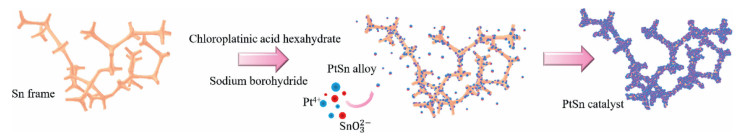
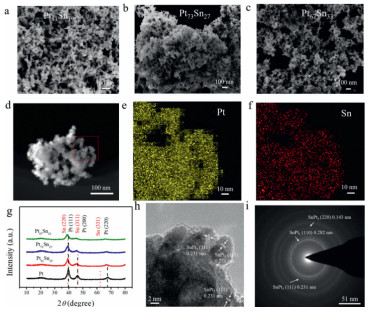
PtSn catalysts with different composition were obtained by liquid phase reduction, with D(+)-glucose as the surfactant. In the first step, the precursor of Sn (Na2SnO3) was added to the solution. Sn skeleton was synthesized by partially reducing the Na2SnO3 with NaBH4. In the second step, H2PtCl6 was added. The alloy nanoparticles were prepared with H2PtCl6 and unreduced Na2SnO3, which were anchored on the Sn framework (Fig. 1). The morphology of prepared PtSn catalysts were characterized with SEM (Figs. 2a-c). A volcanic rubble-like 3D porous structure was observed, with blending nanoparticles (diameter of ~3.5 nm). The microstructure was identical for PtSn alloy with different atomic ratio. The corresponding element mappings (Figs. 2e and f) demonstrated the uniform distribution of Pt and Sn. For such a structure, the specific surface area could be greatly enlarged, and the skeleton was not significantly varied after potential cycling, with blurred boundary of nanoparticles due to Ostwald ripening [29, 30] (Fig. S1 in Supporting information). In the control experiments under the same conditions, if only Na2SnO3·3H2O was added, Sn framework was formed (Fig. S2a in Supporting information), and large-sized Pt particles agglomerated together was observed without Sn precursor (Fig. S2b in Supporting information). Sn skeleton as a self-supporting framework determines the overall morphology of the catalyst and anchors the nanoparticles. Therefore, the formation of such 3D porous nanostructure required two metal precursors to be added in a certain order.

|
Download:
|
| Fig. 1. Schematic for the formation process of PtSn catalysts. | |

|
Download:
|
| Fig. 2. (a-c) SEM images of PtSn catalysts with different atomic ratio; (d) HAADF-STEM and (e, f) corresponding element mapping (Pt and Sn) of Pt73Sn27; (g) XRD patterns of as prepared Pt81Sn19, Pt73Sn27, Pt67Sn33 and pure Pt; (h) HRTEM image and (i) SAED pattern of the Pt73Sn27. | |
X-ray diffractograms (XRD) of PtSn catalysts were given (Fig. 2g), showing the typical Pt face centered cubic (fcc) peak, namely planes (111), (200) and (220) at 39.78°, 46.24° and 67.45°, respectively. The position of Pt (111) peak was at 39.76°, 39.26° and 38.90° for Pt81Sn19, Pt73Sn27 and Pt67Sn33, respectively. Comparing with pure Pt, it obviously revealed that the peak was slightly shifted to lower angles with increased Sn content. The results indicated that Sn atoms were incorporated into Pt fcc structure to form alloy, in which the lattice was expanded because of the larger lattice parameter of Sn [31]. The formation of alloy phase was able to efficiently change the electronic properties of Pt. The charge can be transferred from Sn to Pt and the electronic back donation exerted by CO species can be reduced, thus weakening the Pt-CO bond energy and diminishing CO poisoning effects at the Pt surface. Above effects contributed to the enhancement of electrocatalytic activity [32-34].
To further study the PtSn alloy nanostructure, the sample Pt73Sn27 was characterized with HRTEM and SAED. The nanoparticle presented the crystal lattice spacing of 0.231 nm (Fig. 2h), corresponding to the fcc SnPt3 (111) lattice fringe. Each distinctive growth directions of the surface can also be detected by the lattice fringes. Concentric rings were clearly indicated in SAED data (Fig. 2i), which were individually indexed to the (110), (111) and (220) plane of fcc SnPt3 nanostructure. The result forcefully suggested that Sn was incorporated in the form of Pt alloy [35]. Alloyed SnPt3 was one of the most common and active structures for EOR [15]. In combination with the above structure characterization, it could be found that the inside 3D porous nanostructure was Sn frame, and the external decoration was PtSn alloy nanoparticles formed by heterogeneous phase nucleation.
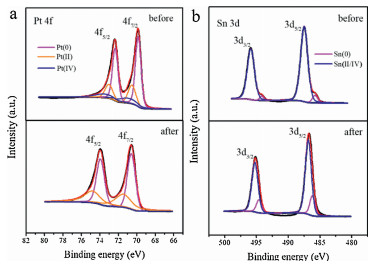
The valence state and surface composition of Pt73Sn27 was analyzed with XPS. The high-resolution Pt 4f and Sn 3d spectra was presented (Fig. 3). The Pt 4f spectra can be deconvoluted into three peaks asigned to Pt(0) at 71.4 eV, Pt(II) at 72.4 eV and Pt(IV) at 74.1 eV, while Sn 3d spectra can be fitted into two peaks attributed to Sn(0) and Sn(II/IV) species located at 845.8 and 847.3 eV, respectively [14, 36]. Sn was predominantly in its oxidized state, with 93% of Sn(II/IV) and only 7% of Sn(0). Pt was mainly in its reduced state (62%). The sample contained O element in addition to metal elements in the full spectrum (Fig. S4 in Supporting information). Therefore, it judged that Sn mainly existed in the form of Sn oxide on the surface. SnOx provided adsorbed hydroxyl groups at much lower overpotential, after combining with Pt, it made synergistic effects in the ethanol oxidation for improving catalytic activity [32].

|
Download:
|
| Fig. 3. (a) Pt 4f and (b) Sn 3d XPS spectra of Pt73Sn27 before and after potential cycling. | |
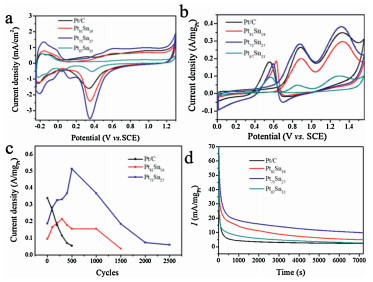
In addition to morphology and composition, the electrochemical active surface area (ECSA) was also an important parameter for affecting the electrochemical activity. ECSA was calculated by integrating the region of hydrogen adsorption/desorption and the charge of voltammetric wave, and then dividing 0.21 mC/cm2 and mass quality of Pt on working electrode [37]. ECSA of PtSn nanostructures with different compositions was shown in Fig. 4a. The ECSA value for Pt81Sn19, Pt73Sn27 and Pt67Sn33 was 15.5, 33.4 and 9.6 m2/g, respectively, which was about 46%, 99% and 28% of that of commercial Pt/C electrocatalyst (33.7 m2/g). It has been reported that aggregation of nanoparticles can cause active sites to be covered [38], so the lower ECSA of catalysts PtSn may be attributed to the blending of PtSn nanoparticles.

|
Download:
|
| Fig. 4. (a) CV curves of different catalysts in 0.1 mol/L HClO4 solution; (b) CV curves of different samples in 0.1 mol/L HClO4 + 0.5 mol/L C2H5OH; (c) the mass activity of Pt81Sn19, Pt73Sn27 and Pt/C for the different circles and (d) Chronoamperograms at 0.87 V vs. RHE in 0.1 mol/L HClO4 + 0.5 mol/L C2H5OH at 298 K. | |
Catalytic properties of the PtSn catalysts for EOR were tested with CV under 0.1 mol/L HClO4 + 0.5 mol/L C2H5OH solutions (Fig. 4b). There were various reaction pathways for EOR, in which the oxidation peak (I) corresponded the complete ethanol electro-oxidation reaction, with the formation of CO2; and the oxidation peak (II) was attributed to the incomplete ethanol oxidation reaction, with the formation of acetaldehyde and acetic acid [38]. More energy can be provided in complete ethanol oxidation, compared to that of incomplete oxidation. However, the current density has been another important parameter to characterize the conversion of chemical energy to electrical energy. Higher current density indicated higher conversion efficiency and better catalyst activity [24].
Considering the effect of the Pt content in the catalysts, we use the current density per unit mass of Pt to compare the catalytic activity. Since Sn showed no EOR catalytic activity for ethanol, the catalytic performance of Pt67Sn33 was not ideal due to the high Sn content. Corresponding to ECSA, the catalytic activity of Pt81Sn19 was not the highest because the exposed active sites were limited. Pt73Sn27 showed better performance of promising applications in energy conversion of DEFCs. As the increased potential cycles, in contrast to the rapid decrease in mass activity of Pt/C, the mass activity of Pt81Sn19, Pt73Sn27 was even increased. After 500 cycles, almost no activity could be observed for Pt/C. However, Pt81Sn19 and Pt73Sn27 were able to perform 1500 cycles and 2, 500 cycles, respectively (Fig. 4c). The results indicated enhanced catalytic activity and improved cycle life for the PtSn catalysts. The enhanced catalytic performance of Pt81Sn19 and Pt73Sn27 was related to the synergistic effects of bimetals and the unique interconnected structure. Since the structure was inter-connected, it was conductive to electron and mass transfer during the catalytic process. Sn skeleton inside the catalyst was anchored with the alloy nanoparticles, which effectively avoided the block of active site by particle agglomeration during the electrochemical process. After subjecting to potential cycling, clear negative 0.8 eV shift of Pt 4f7/2 from 71.4 eV to 70.6 eV and Pt 4f5/2 from 74.8 eV to 74.0 eV are observed in Fig. 3a, such reduced binding energy indicates that dealloying occurred during the electrochemical measurement [37, 39]. The Pt-enriched skin was formed on the surface of the catalyst when Sn atoms were leached out of the PtSn nanoparticles [40]. However, calculated from the peak area of XPS, the atomic ratio of Pt:Sn in Pt73Sn27 was changed from 28:33 to 5:21 after subjecting to potential cycling. The increase of Sn content on the catalyst surface indicates that the special structure of the catalysts can prolong the Sn leaching process to make Sn still plays its role in enhancing catalytic performance. However, the block of active sites caused by Sn leaching remained a main reason for the activity loss of the catalyst [40].
The long-term stability of the PtSn catalysts was investigated by CA experiment at a given potential of 0.87 V for 7200 s in 0.1 mol/L HClO4 solution containing 0.5 mol/L C2H5OH. Fig. 4d showed the typical set of CA current (i) versus time (t) curves. It observed that the activity of the catalyst sharply decreased in the first 400 s. It was resulted from the adsorption of intermediates, which was generated during EOR and accumulated on catalyst surface. Thus, the catalytic activity was rapidly decreased [41]. PtSn catalysts exhibited higher mass current density than that of commercial Pt/C throughout the testing. Compared with Pt/C catalyst, the stability and the resistance to aggregation of the catalyst with 3D porous nanostructure has been greatly improved in the acidic electrolyte.
The poisoning effect was evaluated with CO stripping voltammetry (Fig. S5 in Supporting information). A strong CO oxidation peak was observed for all the catalysts at the first cycle of voltammogram. The peak potentials for CO oxidation presented the notable negative shift on PtSn electrodes and the Pt73Sn27 sample still achieved the lowest peak potential. Compared to the Pt/C (0.788 V), Pt81Sn19, Pt73Sn27 and Pt67Sn33 catalysts showed a more negative potential of 0.685, 0.661 and 0.699 V, respectively. All the PtSn catalysts developed an onset potential for CO oxidation at potentials lower than 0.51 V, indicating the improved CO tolerance with the introduction of Sn in catalyst.
Therefore, the adsorption of intermediates on active site of Pt during EOR can be effectively minimized by both appropriate Sn content in Pt73Sn27 and the formation of alloy. The unique 3D porous structure was interconnected Sn framework, and it was conducive to electron transfer and extending leaching time of Sn. Alloy nanoparticles were anchored to the framework, which effectively reduced particle agglomeration, while improving the catalytic activity and stability.
In summary, we have developed a facile route to synthesize PtSn alloy with novel 3D porous nanostructure and the composition can be adjusted. Adding metal precursors at different times to encapsulate Sn framework with PtSn alloy nanoparticle effectively promoted structural stability. The design of such innovative structure may inspire the preparation of other electrochemical catalysts. Because of the advantages of this structure, PtSn catalysts in this work exhibited high electrocatalytic activity toward EOR and good durability superior to the commercial Pt/C, indicating the promising applications of PtSn catalyst in DEFCs.
Declaration of competing interestThe authors declare that they have no known competing financial interests or personal relationships that could have appeared to influence the work reported in this paper.
AcknowledgmentsThis work was supported by the National Natural Science Foundation of China (Nos. 21705036, 21975067, 51974115, 21476066 and 51271074), Natural Science Foundation of Hunan Province, China (No. 2018JJ3035) and Fundamental Research Funds for the Central Universities from Hunan University.
Appendix A. Supplementary dataSupplementary material related to this article can be found, in the online version, at doi:https://doi.org/10.1016/j.cclet.2020.04.025.
| [1] |
S. Song, P. Tsiakaras, Appl. Catal. B:Environ. 63 (2006) 187-193. DOI:10.1016/j.apcatb.2005.09.018 |
| [2] |
E. Antolini, J. Power Sources 170 (2007) 1-12. DOI:10.1016/j.jpowsour.2007.04.009 |
| [3] |
W.J. Zhou, S.Q. Song, W.Z. Li, et al., Solid State Ionics 175 (2004) 797-803. DOI:10.1016/j.ssi.2004.09.055 |
| [4] |
S.Q. Song, W.J. Zhou, Z.H. Zhou, et al., Int. J. Hydrogen Energ. 30 (2005) 995-1001. DOI:10.1016/j.ijhydene.2004.11.006 |
| [5] |
C. Bianchini, P.K. Shen, Chem. Rev. 109 (2009) 4183-4206. DOI:10.1021/cr9000995 |
| [6] |
M. He, G. Fei, Z. Zheng, et al., Langmuir 35 (2019) 3694-3700. DOI:10.1021/acs.langmuir.9b00021 |
| [7] |
H.P. Dhar, L.G. Christner, A.K. Kush, H.C. Maru, J. Electrochem. Soc. 133 (1986) 1574-1582. DOI:10.1149/1.2108971 |
| [8] |
E.A. Batista, T. Iwasita, W. Vielstich, J. Phys. Chem. B 108 (2004) 14216-14222. DOI:10.1021/jp038016+ |
| [9] |
P.E. Tsiakaras, J. Power Sources 171 (2007) 107-112. DOI:10.1016/j.jpowsour.2007.02.005 |
| [10] |
E. Antolini, ChemSusChem 6 (2013) 966-973. DOI:10.1002/cssc.201300138 |
| [11] |
P. Kanninen, M. Borghei, J. Hakanpää, et al., Electroanal. Chem. 793 (2017) 48-57. DOI:10.1016/j.jelechem.2016.10.019 |
| [12] |
M. Li, H. Zheng, G. Han, Y. Xiao, Y. Li, Catal. Commun. 92 (2017) 95-99. DOI:10.1016/j.catcom.2017.01.014 |
| [13] |
M. Roca-Ayats, O. Guillén-Villafuerte, G. García, et al., Appl. Catal. B:Environ. 237 (2018) 382-391. DOI:10.1016/j.apcatb.2018.05.078 |
| [14] |
H. Song, M. Luo, X. Qiu, G. Cao, Electrochim. Acta 213 (2016) 578-586. DOI:10.1016/j.electacta.2016.07.053 |
| [15] |
R.F.B. De Souza, L.S. Parreira, D.C. Rascio, et al., J. Power Sources 195 (2010) 1589-1593. DOI:10.1016/j.jpowsour.2009.09.065 |
| [16] |
J.H. Kim, S.M. Choi, S.H. Nam, et al., Appl. Catal. B:Environ. 82 (2008) 89-102. DOI:10.1016/j.apcatb.2008.01.011 |
| [17] |
S.Y. Shen, T.S. Zhao, J.B. Xu, Int. J. Hydrogen Energ. 35 (2010) 12911-12917. DOI:10.1016/j.ijhydene.2010.08.107 |
| [18] |
F. Zhu, K. Tu, L. Huang, et al., Electrochim. Acta 292 (2018) 208-216. DOI:10.1016/j.electacta.2018.08.142 |
| [19] |
K. Deng, Y. Xu, C. Li, et al., Langmuir 35 (2019) 413-419. DOI:10.1021/acs.langmuir.8b03656 |
| [20] |
C. Du, X. Gao, Z. Zhuang, et al., Electrochim. Acta 238 (2017) 263-268. DOI:10.1016/j.electacta.2017.03.198 |
| [21] |
P. Song, L.P. Mei, A.J. Wang, K.M. Fang, J.J. Feng, Int. J. Hydrogen Energ. 41 (2016) 1645-1653. DOI:10.1016/j.ijhydene.2015.11.021 |
| [22] |
W. Zhou, M. Li, L. Zhang, S.H. Chan, Electrochim. Acta 123 (2014) 233-239. DOI:10.1016/j.electacta.2013.12.153 |
| [23] |
C. Lamy, S. Rousseau, E.M. Belgsir, C. Coutanceau, J.M. Léger, Electrochim. Acta 49 (2004) 3901-3908. DOI:10.1016/j.electacta.2004.01.078 |
| [24] |
M.S. Çögenli, A.B. Yurtcan, Int. J. Hydrogen Energ. 43 (2018) 10698-10709. DOI:10.1016/j.ijhydene.2018.01.081 |
| [25] |
R. Rizo, Arán-Ais R.M., E. Padgett, et al., J. Am. Chem. Soc. 140 (2018) 3791-3797. DOI:10.1021/jacs.8b00588 |
| [26] |
P. Song, X. Cui, Q. Shao, et al., J. Mater. Chem. 5 (2017) 24626-24630. DOI:10.1039/C7TA08467F |
| [27] |
C. Zhu, H. Li, S. Fu, D. Du, Y. Lin, Chem. Soc. Rev. 45 (2016) 517-531. DOI:10.1039/C5CS00670H |
| [28] |
S. Fu, C. Zhu, D. Du, Y. Lin, ACS App. Mater. Interfaces 7 (2015) 13842-13848. DOI:10.1021/acsami.5b01963 |
| [29] |
L. Calvillo, L. Mendez De Leo, S.J. Thompson, et al., Electroanal. Chem. 819 (2018) 136-144. DOI:10.1016/j.jelechem.2017.09.060 |
| [30] |
D.H. Kwak, Y.W. Lee, S.B. Han, et al., J. Power Sources 275 (2015) 557-562. DOI:10.1016/j.jpowsour.2014.11.050 |
| [31] |
D.H. Lim, D.H. Choi, W.D. Lee, H.I. Lee, Appl. Catal. B:Environ. 89 (2009) 484-493. DOI:10.1016/j.apcatb.2009.01.011 |
| [32] |
D. Tripković, S. Stevanović, A. Gavrilović, et al., Electrocatalysis 9 (2018) 76-85. DOI:10.1007/s12678-017-0424-4 |
| [33] |
W. Xiao, W. Lei, M. Gong, H.L. Xin, D. Wang, ACS Catal 8 (2018) 3237-3256. DOI:10.1021/acscatal.7b04420 |
| [34] |
L.A. Soares, C. Morais, T.W. Napporn, K.B. Kokoh, P. Olivi, J. Power Sources 315 (2016) 47-55. DOI:10.1016/j.jpowsour.2016.03.013 |
| [35] |
H. Zhu, J. Chen, X. Li, et al., Mater. Res. Express 6 (2019) 115048. DOI:10.1088/2053-1591/ab44e4 |
| [36] |
J. Yu, M. Jia, T. Dai, F. Qin, Y. Zhao, J. Solid State Electr. 21 (2017) 967-974. DOI:10.1007/s10008-016-3449-3 |
| [37] |
I.A. Khan, Y. Qian, A. Badshah, D. Zhao, M.A. Nadeem, ACS App. Mater. Interfaces 8 (2016) 20793-20801. DOI:10.1021/acsami.6b06068 |
| [38] |
Y. Feng, C. Wang, D. Bin, et al., ChemPlusChem 81 (2016) 93-99. DOI:10.1002/cplu.201500315 |
| [39] |
Y. Shao, X. Xiao, Y.P. Zhu, T.Y. Ma, Angew. Chem. Int. Ed. 58 (2019) 14599-14604. DOI:10.1002/anie.201909326 |
| [40] |
G. Samjeské, S.-i. Nagamatsu, S. Takao, et al., Phys. Chem. Chem. Phys. 15 (2013) 17208-17218. DOI:10.1039/c3cp52323c |
| [41] |
Y. Liao, G. Yu, Y. Zhang, et al., J. Phys. Chem. 120 (2016) 10476-10484. |