 2020, Vol. 31


Ammonia has been playing a critical role in fertilizers chemical feed stock and also considered as an efficient energy carrier in recent years [1-4]. Consequently, chemical and biology nitrogen fixation are mainly two ways to obtain ammonia, which differ from reaction process and mechanism [3]. The industrial Haber-Bosch process needs rigorous reaction condition (~500 ℃ and ~250 atm) to accomplish the nitrogen fixation process, which leads to tremendous energy consumption and massive CO2 emission [5-8]. Instead, the efficient biological nitrogen fixation urges to be mimicked for N2 conversion to NH3 under room temperature and atmospheric pressure [9-11]. Being environmentally benign, occurring under mild conditions and utilizing renewable sources of energy, electrocatalytic N2 reduction reaction (NRR) is outright attractive and significant in the sustainable development of modern society.
Great efforts have been made to fabricate materials to imitate the biologically accomplishing nitrogen fixing Mo or Fe-centered cluster [3, 12]. For example, (TPB)Fe(N2[Na(12-crown-4)2] (TPB = tris(phosphino)borane), (CAAC)2Fe(CAAC = cyclic(alkyl)(amino)carbene][13], and [Fe(N2)(depe)2] (depe = Et2PCH2CH2PEt2) materials can active dinitrogen and reduce it to ammonia [3, 14]. However, these nitrogen fixation processes were completed at extremely low temperature (-78~-95 ℃) and needs strict water-free and oxygen-free conditions. Recently, the nitrogenase-mimic amorphous iron-containing chalcogenide (Mo2Fe6S8-Sn2S6) was built by the self-assembling of double-cubane [Mo2Fe6S8(SPh)3] and [Sn2S6]4-clusters demonstrated photocatalytic N2 conversion to 12 μmol NH3 (~1.5 μmol of catalyst, Mo2Fe6S8-Sn2S6) under ambient temperature and pressure conditions [15-18]. Molybdenum-free chalcogels containing only Fe4S4 clusters are also capable of accomplishing the N2 fixation reaction. However, the poor conductivity and amorphous nature of these materials restrains their photocatalytic and electrocatalytic activity [16].
Molybdenum disulfide (MoS2), a typical layered chalcogenide, has attracted much attention in electrochemical energy storage, owing to its large surface area derived from unique single- and multilayered nanosheets. MoS2 has been thoroughly investigated in different electronic and photovoltaic disciplines because of its layered structure, good conductivity and special physio-chemical properties [19, 20]. Theoretical calculation and experimental results have shown that MoS2/CC could be used as an efficient electrocatalytic agent for NRR [20-22]. Recently, a DFTcomputational work predicted that Fe atoms grafted to S atoms on 2H-MoS2 materials could facilitate spontaneously capture and electrochemical reduction of N2 at mild conditions [23]. Our simulation indicated Fe substituted Mo in S-Mo-S layer also shown same actions (Table 1). However, it has not manifested experimentally yet.
|
|
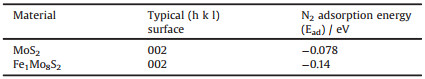
Table 1 Determined adsorption energies for MoS2 and FMS-3(2H- Fe1Mo8S2) materials. |
Currently, MoS2 works on chemical nitrogen fixation still exist disputes in N-source's identification owing to the fabrication process of catalyst always contains ammonia ions, which are released from the typical precursors, such as ammonium molybdate, thiourea and thioacetamide [22, 24-26]. Nevertheless, it is hard to completely reassure that ammonia is from N2 reduction during electro-catalytic process owing to its insufficient research of N sources. Herein, 2H MoS2 (MS/CC) and Fe doped 2H MoS2 (FMS/CC) nanosheets were successfully grown on carbon cloth via nitrogen-free process to avoid misleading. Subsequently, the nitrogen electro-fixation investigations of these materials, Fe doping can effectively enhance the rate of production ammonia by 10 times and 5 times in Faraday efficiency compared with 2H MoS2.
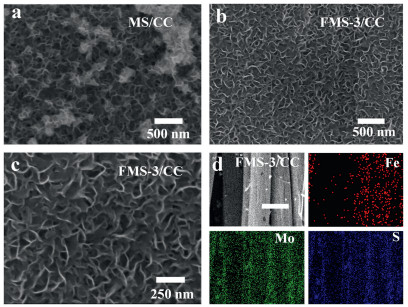
The SEM images of MS/CC shown in Fig. 1 indicate honeycombed MoS2 layers composed of nanosheets are tightly and uniformly anchored on the surface of carbon fibers. The doping of Fe shows nearly no impact on the morphology of MoS2 layers (Figs. 1b and c). The element mapping images (Fig. 1d) of FMS-3 material indicate that Fe, Mo and S are uniformly dispersed on the surface of FMS/CC. The SEM of FMS-1/CC and FMS-2/CC are similar to the FMS-3/CC (Figs. S1 and S2 in Supporting information). However, FMS-4 material (Fig. S3 in Supporting information) is composed of particles, which is different from other three materials' pattern.

|
Download:
|
| Fig. 1. (a-c) SEM of MS (MoS2/CC and FMS-3 materials (Fe-Mo-S-3/CC). (d) Mapping of FMS-3 material. | |
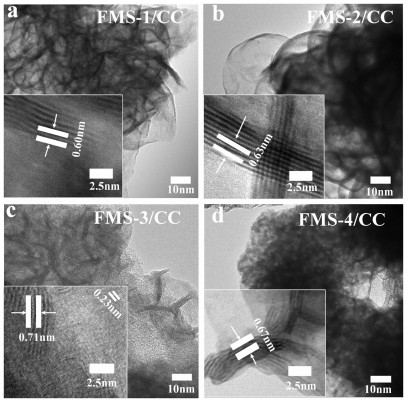
TEM images of FMS/CC further show the FMS layer are 3D flower-like porous structure composed with nanosheets in thickness of ~3 nm. And each MoS2 layer shows the arc-shaped edge because the ultrathin nanosheets need to reduce specific surface free energy, which also been directly uncovered in Fig. 2. HRTEM images show clearly lattice fringes with interlayer spacing of ~6.5 Å, which is ascribed to the (002) plane of MoS2. One can clearly found each single nanosheet are composed of around 6 S-Mo-S layers. What is more, the interlayer spacing of MS/CC, FMS-1/CC, FMS-2/CC and FMS-3/CC are 0.59 nm, 0.60 nm, 0.63 nm and 0.71 nm respectively (Fig. 2 and Fig. S4 in Supporting information), which is more and more wide as the increasing contents of doped Fe in FMS/CC system. Otherwise, the crystal lattice fringes with 0.23 nm is corresponding to the (100) plane of 2H-MoS2 [27]. Obviously, the FMS-4 material shows the different morphology comparing to other samples with ultrathin nanosheets, which further indicates the insufficient S can affect the formation of FMS because of the increased Fe molar contents in the process of hydrothermal synthesis. When more iron sources were present in current system, the generation reactions of FeS were also performed instead of co-precipitation with Mo. As a result, the mixed phases of MoS2 and FeS were obtained instead of Fe-doped structure. The failure of doping Fe resulted the interlayer distance of S-Mo-S of sample FMS-4/CC was similar with un-doped samples, which was smaller than doped samples, such as FMS-3/CC.

|
Download:
|
| Fig. 2. TEM of (a) FMS-1/CC, (b) FMS-2/CC, (c) FMS-3/CC and (d) FMS-4/CC materials. | |
The XRD spectra of MS/CC and FMS/CC materials indicate the lower crystallinity nature of obtained products (Fig. S5a in Supporting information). MS/CC synthesized with water, Na2S2O3 and Na2MoO4 shows obvious strong diffraction peak at 14.7° derived from (002) plane of hexagonal 2H type MoS2 (JCPDS card No. 37-1492), which is in agreement with the result of SEM and HRTEM results [28, 29]. The weak diffraction peaks at 25.8° and 44.2° are ascribed to the graphitic carbon cloth. Additionally, the diffraction peaks (about 28°, 47° and 56°) in FMS-4/CC material are ascribed to the FeS phase as shown in Fig. S6 (Supporting information), which is in consistent with TEM result. The Raman spectra (Fig. S5b in Supporting information) release that all samples show strong and typical vibration E2g1 and A1g vibration at ~380 and 400 cm-1, respectively. A1g vibration mode releases typical out-of-plane lattice vibration of S-Mo-S opposite direction while E12g represents the in-plane vibration trigonal prismatic (D3h) coordination of 2H MoS2. It is clearly indicating the obtained MoS2/CC and Fe-Mo-S/CC materials are hexagonal 2H phase MoS2 in trigonal prismatic (D3h) coordination. And the Raman peak of FMS-1/CC, FMS-2/CC FMS-3/CC and FMS-4/CC is also consistent with that of MoS2 material demonstrating that the doped Fe hardly change the coordination condition of 2H-MoS2 material.
XPS spectra of S in 2H MS/CC and FMS/CC materials reveal the S 2p1/2 and S 2p3/2 at 169.7 eV and 162.3 eV (Fig. S7a in Supporting information). Meanwhile, it clearly finds that S has shifted from low binding energy to high binding energy vary from MS to FMS-4/CC materials resulting from the doped Fe changed the surrounding coordinated structure. In addition, the Mo atoms at 232.2 eV and 228.8 eV (Fig. S7b in Supporting information) release Mo4+ 3d3/2 and Mo4+ 3d5/2 respectively, which also is in a similar condition with S atoms that the corresponding binding energy has shifted from FMS-1/CC to FMS-4/CC [30, 31]. Otherwise, Mo—O bond was obvious in FMS-4/CC materials, which is derived from the insufficient S source in preparation process. In all, the Fe doped MoS2 were successfully grown on carbon cloth via a nitrogen-free hydrothermal system and show nearly the same morphologies with original MoS2. The doping of Fe can significantly affect the chemical and electron structures D3h coordination of MoS2, such as chemical states of Mo and S and the stacking interlayer distance. Owing to its limited content of less than 2% atomic, the weak high-resolution spectra of Fe 2p was obtained as shown in Fig. S8 (Supporting information).
It is critical to perform the optimal potential during electrocatalysis nitrogen fixation process. LSV (Linear sweep voltammetry) was carried out in pH 1 HCl electrolyte to ensure the onset potential and the NRR electrocatalysis effective of doped-Fe MS/CC materials. Fig. S9 (Supporting information) confirmed the doped Fe can enhance the ability of NRR which was uncovered by comparing the reductive current of MS/CC and FMS-3/CC materials. When increase the contents of N2 in electrolyte under bubbling N2 gas, it is obvious to find more negative current for MS/CC and FMS/CC materials. Fig. S10 (Supporting information) shows the i-t curves at -0.4 V, -0.5 V, -0.6 V, -0.7 V and -0.8 V vs. Ag/AgCl. UV–vis (Ultraviolet–visible spectroscopy) can be conducted after the different solutions were reacted with Nessler regents, which can be used to quantitative analysis the ammonia yield at various potentials. Meanwhile, the calibration curve of standard NH4Cl solutions were obtained in Fig. S11 (Supporting information) to determine the concentration of ammonia during the NRR process. According to the absorbance of different solutions, the rate and yield (Figs. S12-14 in Supporting information) of ammonia production on FMS-3/CC materials, -0.6 V vs. Ag/AgCl was the optimal potential for NRR process. Meanwhile, it should be noted that the highest Faraday efficiency (10%) of NRR for FMS-3/CC materials was performed at -0.4 V vs. Ag/AgCl which is also the onset potential for the whole NRR process. As known to us all, the higher potential can facilitate the yield of target product while may decrease the selectivity and Faraday Efficiency of catalytic in electrocatalysis system. Hence, the highest FE (Faraday efficiency) was near 10% when apply the potential of -0.4 V vs. Ag/AgCl. Considering the yield and rate of ammonia production, the optimal applied potential is -0.6 V vs. Ag/AgCl in current system.
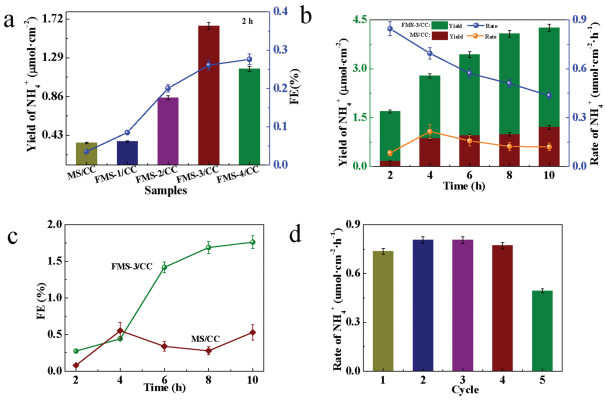
In order to probe the electro-catalytic NRR performance of FMS/ CC materials, yields of ammonia on Fe doped MoS2 materials with different Fe contents were researched as shown in Fig. 3a. Obviously, the MS/CC materials indeed show the lowest ability during electro-catalysis process during current system. The FMS-3/ CC has the optimal performance not only in production but also FE. Hence, it releases that doped-Fe can effectively affect the yield of ammonia. The long life of MS/CC and FMS-3/CC were also probed in Fig. 3b indicates that FMS-3/CC authentically has performed greater electrocatalytic ability than MS/CC after 10 h. Also, compared with the MS/CC materials indicating the rate of ammonia production has an approaching platform, the one for FMS-3/CC has continuously declined from 0.9 μmol cm-2 h-1 to 0.4 μmol cm-2 h-1. What is more, the FE (Fig. 3c) uncovers the Fe can increase the FE of electro-catalysis conversion of nitrogen to ammonia though it has decreased after 8 h, which is derived from the irreversible transformation of Fe in FMS-3/CC. In order to delve the repeatability and cyclability of FMS-3/CC electrode during electro-catalysis process, 5 cycles were performed by changing the electrolyte each 2 h. As shown in Fig. 3d, the rate of ammonia production is almost 0.9 μmol cm-2 h-1 though its fifth cycle has little decreased owing to the peeling off of FMS-3 from the carbon cloth (Table S1 in Supporting information). Herein, the doped-Fe can effectively enhance the ability of MS electro-catalysis reducing N2 to ammonia in current system though its stability for long time is needed to been further improved.

|
Download:
|
| Fig. 3. Electrocatalysis nitrogen to ammonia performance at -0.6 V vs. Ag/AgCl. (a) The yield of ammonia for different samples during 2 h. (b) The yield of ammonia on MS/CC and FMS-3/CC materials for long term. (c) Faraday Efficiency (FE) of NRR electrocatalysis for MS/CC and FMS-3/CC materials. (d) The rate of NRR electrocatalysis during 5 cycles. | |
Based on the above analyses, the doped-Fe in 2H-MoS2 can effectively improve the performance on N2 reduction electrocatalysis. According to the phase and structure of MoS2, the dopedFe onto MoS2 are located in two ways, including Fe substitutes Mo in S-Mo-S layer and Fe graft S in S-Mo-S layer. DFT calculation had indicated the grafted Fe on MoS2 can facilitate the electrocatalysis N2 to ammonia under ambient condition [23]. In this paper, combining the experimental results, the structure of Fe substituting Mo in MoS2 was built as Scheme 1 to calculate the adsorption energies of MoS2 and FMS-3(2H-Fe1Mo8S2) materials to N2 by Material Studio. After surface was relaxed, the relaxed slabs of MoS2, 2H-Fe1Mo8S2 (002) and the optimized adsorbate N2 were allowed to interact using adsorption locator module found in the material studio 2017 package. The determined adsorption energies are summarized in the Table 1. One can find that N2 adsorption energy on MoS2 is -0.078 eV while the 2H-Fe1Mo8S2 is -0.14 eV. It releases that the 2H-Fe1Mo8S2 is superior in adsorption capacity than the pure MoS2 on the surface. N2 adsorption is favored in 2H-Fe1Mo8S2 surface having lower energy of formation than MoS2. Herein, Fe doped MoS2 can perform great ability in electrocatalysis no matter what position the doped Fe are located in.

|
Download:
|
| Scheme 1. Stimulate structure of MoS2 materials and Fe-Mo-S materials. | |
In conclusion, the Fe doped 2H-MoS2 materials supported by carbon cloth substrate was successfully fabricated via a nitrogen-free hydrothermal process. Its improved performance on nitrogen electro-fixation is obvious at -0.6 V vs. Ag/AgCl optimal potential under ambient condition after several tests. Consequently, the Fe doped 2H-MoS2 undoubtedly can realize the conversion of N2 to NH3 and obviously precede the 2H-MoS2, which is consistent with previous theoretical simulation results. Comparing with MoS2/CC, Fe-Mo-S-3/CC not only increases 10 times in the rate of production ammonia, but also 5 times in Faraday efficiency. The doping of Fe can significantly affect chemical states of Mo and S and the stacking interlayer distance, which may be facilitated to capture and electrocatalysis dinitrogen to ammonia at ambient condition.
Declaration of competing interestsThe authors declare that they have no known competing financial interests or personal relationships that could have appeared to influence the work reported in this paper.
AcknowledgmentsThe work was supported by Science and Technology Commission of Shanghai Municipality (Nos. 17ZR1441200, 18QA1402400 and 18230743400), National Natural Science Foundation of China (Nos. 21771124, 21901156).
Appendix A. Supplementary dataSupplementary material related to this article can be found, in the online version, at doi:https://doi.org/10.1016/j.cclet.2020.02.019.
| [1] |
X. Chen, N. Li, Z. Kong, et al., Mater. Horiz. 5 (2018) 9-27. DOI:10.1039/C7MH00557A |
| [2] |
X. Cui, C. Tang, Q. Zhang, Adv. Energy Mater 8 (2018) 1800369. DOI:10.1002/aenm.201800369 |
| [3] |
S.L. Foster, S.I.P. Bakovic, R.D. Duda, et al., Nat. Catal. 1 (2018) 490-500. DOI:10.1038/s41929-018-0092-7 |
| [4] |
K. Ithisuphalap, H. Zhang, L. Guo, et al., Small Method. 3 (2018) 1800352. |
| [5] |
D. Yan, H. Li, C. Chen, et al., Small Method 3 (2018) 1800331. |
| [6] |
P. Wang, F. Chang, W. Gao, et al., Nat. Chem. 9 (2017) 64-70. DOI:10.1038/nchem.2595 |
| [7] |
M. Kitano, Y. Inoue, Y. Yamazaki, et al., Nat. Chem. 4 (2012) 934-940. DOI:10.1038/nchem.1476 |
| [8] |
D. Bao, Q. Zhang, F.L. Meng, et al., Adv. Mater 29 (2017) 1700001. DOI:10.1002/adma.201700001 |
| [9] |
Y. Gong, J. Wu, M. Kitano, et al., Nat. Catal. 1 (2018) 178-185. DOI:10.1038/s41929-017-0022-0 |
| [10] |
L. Han, X. Liu, J. Chen, et al., Angew. Chem. Int. Ed. 58 (2019) 2321-2325. DOI:10.1002/anie.201811728 |
| [11] |
B.M. Hoffman, D. Lukoyanov, Z.Y. Yang, et al., Chem. Rev. 114 (2014) 4041-4062. DOI:10.1021/cr400641x |
| [12] |
J.S. Anderson, J. Rittle, J.C. Peters, Nature 501 (2013) 84-87. DOI:10.1038/nature12435 |
| [13] |
G. Ung, J.C. Peters, Angew. Chem. Int. Ed. 54 (2015) 532-535. |
| [14] |
R.B. Yelle, J.L. Crossland, N.K. Szymczak, D.R. Tyler, Inorg. Chem. Front. 48 (2008) 861-871. |
| [15] |
K.C. MacLeod, P.L. Holland, Nat. Chem. 5 (2013) 559-565. DOI:10.1038/nchem.1620 |
| [16] |
J. Liu, M.S. Kelley, W. Wu, et al., P. Natl. Acad. Sci. U. S. A. 113 (2016) 5530-5535. DOI:10.1073/pnas.1605512113 |
| [17] |
A. Banerjee, B.D. Yuhas, E.A. Margulies, et al., J. Am. Chem. Soc. 137 (2015) 2030-2034. DOI:10.1021/ja512491v |
| [18] |
K.A. Brown, D.F. Harris, M.B. Wilker, et al., Science 352 (2016) 448-450. DOI:10.1126/science.aaf2091 |
| [19] |
X. Guo, H. Du, F. Qu, J. Li, J. Mater, Chem. A 7 (2019) 3531-3543. |
| [20] |
Z. Lei, J. Zhan, L. Tang, et al., Adv. Energy Mater 8 (2018) 1703482. DOI:10.1002/aenm.201703482 |
| [21] |
L. Zhang, X. Ji, X. Ren, et al., Adv. Mater 30 (2018) 1800191. DOI:10.1002/adma.201800191 |
| [22] |
S. Sun, X. Li, W. Wang, et al., App. Catal. B -Environ. 200 (2017) 323-329. DOI:10.1016/j.apcatb.2016.07.025 |
| [23] |
L.M. S.C.H. Azofra, L. Cavallo, D.R. Macfarlane, Chem. Eur. J. 23 (2017) 8275-8279. DOI:10.1002/chem.201701113 |
| [24] |
S. Liu, M. Wang, T. Qian, et al., Nat. Commun 10 (2019) 3898. DOI:10.1038/s41467-019-11846-x |
| [25] |
S.Z. Andersen, V. Colic, S. Yang, et al., Nature 570 (2019) 504-508. DOI:10.1038/s41586-019-1260-x |
| [26] |
B. Hu, M. Hu, L. Seefeldt, T.L. Liu, ACS Energy Lett. 4 (2019) 1053-1054. DOI:10.1021/acsenergylett.9b00648 |
| [27] |
P. Chen, W. Xu, Y. Gao, et al., ACS Appl. Nano Mater. 1 (2018) 6976-6988. DOI:10.1021/acsanm.8b01792 |
| [28] |
H. Dong, Y. Xu, C. Zhang, et al., Inorg. Chem. Front. 5 (2018) 3099-3105. DOI:10.1039/C8QI00969D |
| [29] |
Z. He, R. Zhao, X. Chen, et al., ACS Appl. Mater. Interfaces 10 (2018) 42524-42533. DOI:10.1021/acsami.8b17145 |
| [30] |
L. Zhang, M. Li, A. Zou, et al., ACS Appl. Energy Mater. 2 (2018) 493-502. |
| [31] |
W. Jia, X. Zhou, Y. Huang, et al., ChemCatChem 11 (2018) 707-714. |