 2020, Vol. 31


b Suzhou Institute of Nano-tech and Nano-bionics, Chinese Academy of Sciences(CAS), Suzhou 215123, China;
c Institute of Materials Science and Devices, Suzhou University of Science and Technology, Suzhou 215009, China;
d Center for Integrated Nanotechnologies, Los Alamos National Laboratory, Los Alamos, NM 87544, United States
Nanobubble was originally thought to be very unstable because of the high inner pressure according to Young-Laplace equation. However, in the past twenty years, breakthroughs have been made in the solid-liquid interface [1-12], the generation, detection, and application of nanobubbles in solution [13, 14]. Attractively, nanobubble has many special properties, such as small size, ease of release from the tissue, enhanced gas dissolution capacity. Therefore, it exhibits many potential applications in medical science [15, 16], surface cleaning [17], wastewater treatment [18], catalysis [1, 2, 19, 20], optically heated nanoparticles [21-23] and electrochemistry [2, 3, 19, 24]. More and more attentions have been attracted by this rising research field.
The research of nanobubble mainly includes five aspects, i.e., generation [12], detection [4, 10, 25-29], stability mechanism [30-32], application [1, 2, 15-19] and evolution of nanobubbles [25, 27, 33]. In past twenty years, great achievements have been made in the first four of them. However, few attentions have been paid in the last aspect, i.e., the evolution of nanobubbles. Actually, the evolution of nanobubbles is very important, and has strong relationship with the other four aspects of nanobubble research. Therefore, there is an urgency to conduct more research on the evolution of nanobubble.
The process of evolution is very heterogeneous, and requires the study at single-nanobubble level. However, current techniques, such as AFM [4, 10, 26], in-situ FTIR/IRS [34], quartz crystal microbalance etc. [28, 29], have some limitations of time and/or spatial resolution in detecting single nanobubbles. Only very few nanobubbles have been studied with a high spatial resolution < 0.2 nm (height), but a low time resolution of 500-800 ms (time for acquiring one image) [33, 35]. The time resolution is the minimum time interval between two adjacent frames of images taken in the same area. High time resolution can capture small nanobubbles and their detailed changes. In order to understand the evolution further, it's better to detect the single nanobubbles in real time and in-situ with high time resolution and proper spatial resolution. It is also necessary to detect a large number of single nanobubbles in a time to get high statistical significance.
Recently, we successfully applied dark-field microscopy (DFM) to detect single nanobubbles that generated on hundreds of single Pd-Ag nanoplates from formic acid dehydrogenation with a high time resolution (50 ms) [1]. Using the same approach, we investigated the details of the evolution of single nanobubbles and made new discoveries that some nanobubbles in this system have three distinct states showing the change of nanobubbles in different sizes. Furthermore, we found rather than direct transitions, these three states transform among each other through some intermediate states. We built a kinetic model and assigned relative energy levels to different states to discuss the possible nature and mechanisms of the observed transition pathways. These results successfully indicate complicated mechanisms behind the evolution and stability of single nanobubbles.
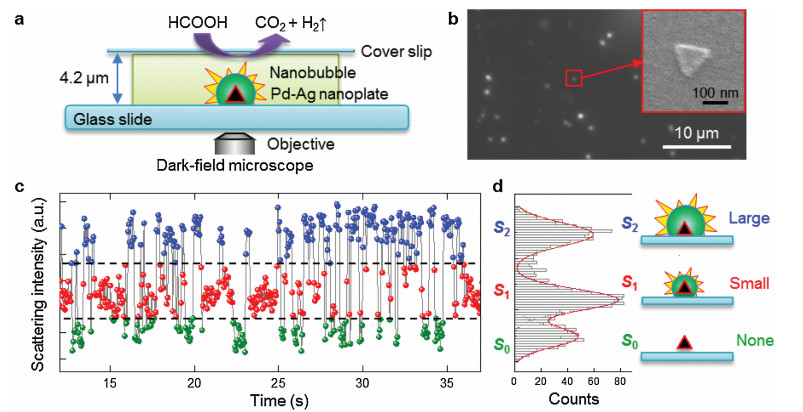
We used DFM (Fig. 1a) to detect the nanobubbles from the gas-generating catalysis of formic acid dehydrogenation on single PdAg nanoplates (Fig. 1b). The scattering intensity versus time trajectories could be obtained for each nanoplate (Fig. 1c and SI.1 section in Supporting information). We also measured the contact angle of the Pd-Ag nanoplate interface, which depends on formic acid concentration (Fig. S1 in Supporting information). The green dots in Fig. 1c represent the low intensity state without any nanobubble, while the red and blue dots represent high intensity states with nanobubbles. Besides the two-state behavior in our previous study [1], we can resolve three states in the intensity histograms of some individual trajectories as the example in Fig. 1c by applying Gaussian mixture model fitting on the distribution of intensities for each trajectory (Fig. 1d and Fig. S2 in Supporting information). Such three-state behavior only exists in part of all PdAg nanoplates (~2%) and some fractions (~11%) of a trajectory of one nanoplate. For each HCOOH concentration, we could find more than 30 fractions for further analysis. Each fraction has several hundreds to thousands of events.

|
Download:
|
| Fig. 1. Three distinct states of single nanobubbles monitored via dark-field microscope (DFM). (a) A microfluidic cell with Pd-Ag nanoplates catalyzing the dehydrogenation of HCOOH. (b) Scattering image of the Pd-Ag nanoplates. The insert is a zoomed-in SEM image of a single nanoplate. (c) An example scattering intensity vs. time trajectory at 1.67 mol/L HCOOH. (d) The intensity histogram of the trajectory in (c) and three different states were resolved by the fitting with a mixture of Gaussian functions (red curve). | |
Because the scattering intensity of nanobubble is correlated with its size, we could assign the different levels of scattering intensities to different sizes of nanobubbles. As shown in Fig. 1d, the lowest intensity level (S0) is the state without observable nanobubbles; the middle intensity level (S1) is the state of relatively small nanobubbles; and the highest intensity level (S2) is the state of relatively large nanobubbles. The observation of the three states of nanobubbles on the same Pd-Ag plates implies a more complicated process of the gas-generating catalysis.
The trajectory in Fig. 2a shows that one state can sustain for a while, and then transform to another state. When we inspected many trajectories, we found that each pair of the three states can transform between each other. Therefore, a full transition map can be established for this system (Fig. 2b). The transitions between S0 and S1 (S2) indicate the formation and dissolution of small (large) nanobubbles. And the transitions between S1 and S2 indicate the size increase and decrease of formed nanobubbles.

|
Download:
|
| Fig. 2. Transitions between the states in each pair of the resolved three states of nanobubbles. (a) Fraction of a scattering intensity trajectory from experiment with the transitions among different states. The dots are from experiment, and the red line is an idealized trajectory. (b) A full transition map to describe the transitions in this system. (c) A model trajectory to illustrate the waiting times of all six transitions. | |
For each transition, there is an important parameter, i.e., the waiting time (τ), which can be extracted from the scattering intensity trajectories (Fig. 2c). As shown in Fig. 2c, the waiting time (τ) is defined as the time length of Si (i=0, 1, 2) for the transition of Si to Sj (j=0, 1, 2, and i≠j). The time lengths of Si (i=0, 1, 2) have different physical meanings. Different lengths of waiting times of S0 (τ0→1 and τ0→2) represent the incubation time to generate a small or large nanobubble. Different lengths of waiting times of S1 (τ1→0 and τ1→2) and S2 (τ2→0 and τ2→1) represent different stabilities of small and large nanobubbles, respectively. A longer waiting time for S1 or S2 means a more stable nanobubble.
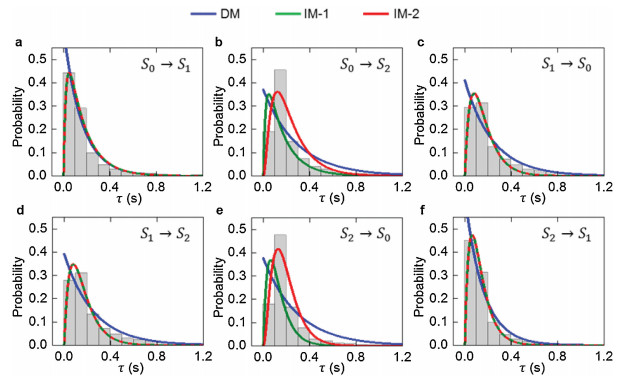
In order to understand the transition process of nanobubbles better, we combined many waiting times from multiple scattering intensity trajectories (Figs. 3a–f) and studied their distributions. Figs. 3a–f show that the waiting times for all transitions are very heterogeneous and generate broad histogram distributions. Based on the full transition map (Fig. 2b), we first used the simplest direct-transition model (DM) to fit the histograms of all the transitions (blue curves in Fig. 3). The single exponential function (Eq. 1) as follows:

|
Download:
|
| Fig. 3. Waiting time histograms of transitions for 1.00mol/L formic acid concentration. (a) S0→S1, (b) S0→S2, (c) S1→S0, (d) S1→S2, (e) S2→S0, and (f) S2→S1. The blue, green and red curves are the fitting results using direct-transition model, intermediate-state model-1 and intermediate-state model-2. The simple arithmetic average waiting times for all the transitions are: (a) 0.23s, (b) 0.25s, (c) 0.32s, (d) 0.31s, (e) 0.21s, (f) 0.20s. | |

|
(1) |
where A is the scaling factor, w1 is the weight of transitions of S0 to S1, ka is the transition rate constant, C is the concentration of formic acid, and t is the actual waiting time. The equations for other transitions as well as the derivations are given in SI.6 section of Supporting information. All the fittings of waiting time histograms in this paper are global fittings for the data across three formic acid concentrations: 1.00mol/L (Fig. 3), 1.67mol/L (Fig.S3 in Supporting information) and 3.00mol/L (Fig. S4 in Supporting information). These substrate concentrations would not affect the generation and evolution mechanisms of nanobubbles. Since the concentration effect is reflected in the parameter C, the global fittings in this system would keep the rate constants consistent across different concentration conditions and reduce the fitting errors for better interpretation.
For some of the transitions (S0→S1 and S2→S1), the fitting results by direct-transition model are close to the actual distributions (blue curves in Figs. 3a and f). However, for the other four transitions (S0→S2, S1→S0, S1→S2, and S2→S0), the fitted curves are quite off (Figs. 3b–e). These increase-decrease behaviors also exist under the conditions with other formic acid concentrations (Figs. S3 and S4). Therefore, these increase-decrease behaviors represent the general mechanisms behind the statetransition processes of the nanobubble system [36-40].
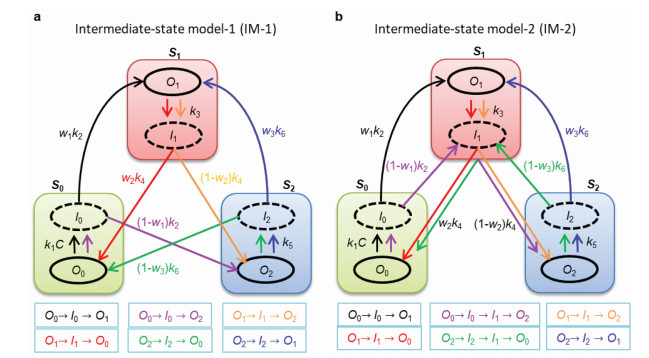
Based on this assumption, we proposed a more precise kinetic model (intermediate-state model-1, i.e., IM-1) (Fig. 4a). This model contains three distinct intermediate states (I0, I1, and I2) for three corresponding ordinary states (O0, O1, and O2, representing stable states of S0, S1, and S2). Therefore, each apparent state observed in our experiments contains two sub-states, i.e. one ordinarystate (O) and one intermediate state (I). All ordinary states have to go through the specific intermediate states before transforming into other ordinary states. We used this model to build equations to fit the waiting time histograms of all transitions at all different HCOOH concentrations globally (Eq. 2).

|
Download:
|
| Fig. 4. Two intermediate-state models to describe the transitions among different states of nanobubbles. (a) Intermediate-state model-1 (IM-1). (b) Intermediate-state model-2 (IM-2). Each state contains two sub-states, i.e., ordinary state and intermediate state. The ordinary states are drawn in solid circles, while the intermediate states are drawn in dashed circles. Arrows with the same color form a complete transition pathway from one ordinary state to another ordinary state as shown at the bottom of the scheme. | |

|
(2) |
In above equation, k1 and k2 are the rate constants, other parameters in above equation have similar meanings as those in Eq.1. The equations for other transitions as well as the derivations are given in SI.7 section of Supporting information. For most of the transitions (S0→S1, S1→S0, S1→S2 and S2→S1), the fitting results are veryclose tothe actual distributions (Figs. 3a, c, d and f). The fitting quality comparisons of DM and IM-1 are shown in Table S1 (Supporting information).
However, for the other two transitions (S0→S2 and S2→S0) the fitted curves are still deviated from the actual distribution of waiting times(green curves in Figs.3 band e). Thesedeviations also exist in the results at higher formic acid concentrations (Figs. S3 and S4). Therefore, the simple intermediate-state model (IM-1) is not precise enough to describe all the transitions. The deviations indicate that the transitions between S0 and S2 (no nanobubble and large nanobubble) have more complicated pathways than other transitions.
We assumed that the transitions between S0 and S2 (i.e., S0→S2 and S2→S0) have two intermediate states, while others have only one. These transitions can only exist in two situations (I0→I1 and I2→I1) as shown in Fig. 4b. This assumption is based on two reasons: First, it provides transition pathways containing multiple intermediate states (O0→I0→I1→O2 and O2→I2→I1→ O0) that can release some constraints in IM-1 when fitting the histograms of S0→S2 and S2→S0 transitions; second, the limitation in transition directions among intermediate states (I0→I1 and I2→I1) can avoid too much increase in the complexity of the kinetic model.
Based on the assumption, a new model named as intermediatestate model-2 (IM-2) was built in Fig. 4b. Different from the transitions in IM-1, each of the two transitions, i.e., S0→S2 and S2→S0, in IM-2 has two intermediate states. Therefore, IM-2 presents new equations for the two special transitions (S0→S2 and S2→S0) in SI.8 section of Supporting information, while IM-2 has the same equations as IM-1 for the other four transitions (S0→S1, S1→S0, S1→S2 and S2→S1). For example, for the waiting time histogram of transitions S0→S2, Eq. 3 was applied:

|
(3) |
The parameters in above equation have similar meanings as those in Eq. 2. The derivations of Eq. 3 and another equation for transitions S2→S0 are given in SI.8 section of Supporting information. The fitting results using IM-2 are shown with red curves in Fig. 3. For the transitions S0→S2 and S2→S0, the global fitting results using IM-2 (red curves in Fig. 3) are significantly better than those using IM-1 (green curves in Fig. 3) with improved R-squares from 0.66 (IM-1) to 0.89 (IM-2) for S0→S2 and from 0.64 (IM-1) to 0.94 (IM-2) for S2→S0, as shown in Table S1 of SI.5 section of Supporting information.
These fitting results supported our assumption that the transition pathways of S0→S2 and S2→S0 may include multiple intermediate states, and there could exist additional transitions among different intermediate states. Fitting the histograms of waiting times globally by IM-2, we extracted all the rate constants of transitions (Table S2 in Supporting information) and calculated the average life times of intermediate states (I0, I1, and I2) are ~150 ms, ~60 ms, ~40 ms, respectively. We explored whether the formic acid concentration plays a role in the probabilities of different states and transitions (Fig. S5 and SI.10 section in Supporting information). And the energy levels of different states are also discussed in Fig. S6 and SI.11 section in Supporting information.
According to the intermediate-state model above, the three intermediate states are necessary for all the transition pathways. During the S0 state, some very small bubbles were generated on a single Pd-Ag nanoplate, which are too small to be detected. When the density of these small bubbles reached a certain threshold, they merged together to form a single and larger bubble in order to reduce their total surface energies. Therefore, a complete pathway from one apparent state to another apparent state, through an intermediate state, is formed. The similar mechanism may also apply to the transitions between S1 and S2. Therefore, the experimentally observed "abrupt" changes actually reflect the hidden "gradual" formation and size-change of nanobubbles from multiple centers.
In this research, we successfully resolved three states of the evolution of single nanobubbles generated on single Pd-Ag nanoplates from formic acid dehydrogenation reaction by DFM. The three states could transform among each other through their corresponding intermediate states. We built an intermediate-state model to describe the kinetics of the evolution of nanobubbles and properties of the intermediate states. The model reveals that the evolution of nanobubbles is very complicated for different sizes of nanobubbles. Our discoveries here are very helpful for the fundamental understanding of the properties of nanobubbles and the implementation of their applications. Declaration of competing interest
The authors declare that they have no known competing financial interests or personal relationships that could have appeared to influence the work reported in this paper.
AcknowledgmentsThis work was supported by Ministry of Science and Technology of China (Nos. 2016YFA0200700, 2016YFE0105700), the National Natural Science Foundation of China (Nos. 21373264, 21573275), the Natural Science Foundation of Jiangsu Province (No. BK20150362), Suzhou Institute of Nano-tech and Nanobionics (No. Y3AAA11004), Thousand Youth Talents Plan (No. Y3BQA11001) and the Collaborative Innovation Center of Suzhou Nano Science and Technology.
Appendix A. Supplementary dataSupplementary material related to this article can be found, in the online version, at doi:https://doi.org/10.1016/j.cclet.2020.03.049.
| [1] |
S. Li, Y. Du, T. He, et al., J. Am. Chem. Soc. 139 (2017) 14277-14284. DOI:10.1021/jacs.7b08523 |
| [2] |
Q. Chen, H.S. Wiedenroth, S.R. German, H.S. White, J. Am. Chem. Soc. 137 (2015) 12064-12069. DOI:10.1021/jacs.5b07147 |
| [3] |
Q. Chen, L. Luo, H. Faraji, S.W. Feldberg, H.S. White, J. Phys. Chem. Lett. 5 (2014) 3539-3544. DOI:10.1021/jz501898r |
| [4] |
J.W.G. Tyrrell, P. Attard, Phys. Rev. Lett. 87 (2001) 176104.
|
| [5] |
J.H. Weijs, D. Lohse, Phys. Rev. Lett. 110 (2013) 054501.
|
| [6] |
Y. Wang, B. Bhushan, X. Zhao, Langmuir 25 (2009) 9328-9336. DOI:10.1021/la901186a |
| [7] |
B. Song, W. Walczyk, H. Schoenherr, Langmuir 27 (2011) 8223-8232. DOI:10.1021/la2014896 |
| [8] |
A.C. Simonsen, P.L. Hansen, B. Klösgen, J. Colloid Interface Sci. 273 (2004) 291-299. DOI:10.1016/j.jcis.2003.12.035 |
| [9] |
G. Pan, B. Yang, Chemphyschem 13 (2012) 2205-2212. DOI:10.1002/cphc.201100714 |
| [10] |
S.T. Lou, Z.Q. Ouyang, Y. Zhang, et al., J. Vac. Sci. Technol. B 18 (2000) 2573-2575. DOI:10.1116/1.1289925 |
| [11] |
C.U. Chan, C.D. Ohl, Phys. Rev. Lett. 109 (2012) 174501.
|
| [12] |
A. Agrawal, J. Park, D.Y. Ryu, et al., Nano Lett. 5 (2005) 1751-1756. DOI:10.1021/nl051103o |
| [13] |
F. Jin, X. Ye, C. Wu, J. Phys. Chem. B 111 (2007) 13143-13146. DOI:10.1021/jp077190l |
| [14] |
K. Kikuchi, Y. Tanaka, Y. Saihara, Z. Ogumi, Electrochim. Acta 52 (2006) 904-913. DOI:10.1016/j.electacta.2006.06.026 |
| [15] |
B. Wu, Q. Qiao, X. Han, et al., Tumor Biol. 37 (2016) 12113-12121. DOI:10.1007/s13277-016-5082-2 |
| [16] |
S.S. Thakur, M.S. Ward, A. Popat, et al., PLoS One 12 (2017) PLoS One. |
| [17] |
J. Zhu, H. An, M. Alheshibri, et al., Langmuir 32 (2016) 11203-11211. DOI:10.1021/acs.langmuir.6b01004 |
| [18] |
A. Gurung, O. Dahl, K. Jansson, Geosyst. Eng. 19 (2016) 133-142. DOI:10.1080/12269328.2016.1153987 |
| [19] |
L. Zhang, Y. Zhang, X. Zhang, et al., Langmuir 22 (2006) 8109-8113. DOI:10.1021/la060859f |
| [20] |
Y. Yang, Y. Tang, H. Jiang, et al., Chin. Chem. Lett. 30 (2019) 2089-2109. DOI:10.1016/j.cclet.2019.10.041 |
| [21] |
T. Katayama, K. Setoura, D. Werner, H. Miyasaka, S. Hashimoto, Langmuir 30 (2014) 9504-9513. DOI:10.1021/la500663x |
| [22] |
L. Hou, M. Yorulmaz, N.R. Verhart, M. Orrit, New J. Phys. 17 (2015) 013050. DOI:10.1088/1367-2630/17/1/013050 |
| [23] |
J. Lombard, T. Biben, S. Merabia, Phys. Rev. Lett. 112 (2014) 105701-105706. DOI:10.1103/PhysRevLett.112.105701 |
| [24] |
L. Luo, H.S. White, Langmuir 29 (2013) 11169-11175. DOI:10.1021/la402496z |
| [25] |
S. Yang, P. Tsai, E.S. Kooij, et al., Langmuir 25 (2009) 1466-1474. DOI:10.1021/la8027513 |
| [26] |
N. Ishida, T. Inoue, M. Miyahara, K. Higashitani, Langmuir 16 (2000) 6377-6380. DOI:10.1021/la000219r |
| [27] |
R. Steitz, T. Gutberlet, T. Hauss, et al., Langmuir 19 (2003) 2409-2418. DOI:10.1021/la026731p |
| [28] |
G. Liu, Z. Wu, V.S.J. Craig, J. Phys. Chem. C 112 (2008) 16748-16753. DOI:10.1021/jp805143c |
| [29] |
X.H. Zhang, Phys. Chem. Chem. Phys. 10 (2008) 6842-6848. DOI:10.1039/b810587a |
| [30] |
S. Wang, M. Liu, Y. Dong, J. Phys-Condens. Mat. 25 (2013) 184007. DOI:10.1088/0953-8984/25/18/184007 |
| [31] |
H. Peng, G.R. Birkett, A.V. Nguyen, Adv.ColloidInterfaceSci. 222 (2015) 573-580. |
| [32] |
M.P. Brenner, D. Lohse, Phys. Rev. Lett. 101 (2008) 214505. DOI:10.1103/PhysRevLett.101.214505 |
| [33] |
Y. Wang, B. Bhushan, X. Zhao, Nanotechnology 20 (2009) 045301. DOI:10.1088/0957-4484/20/4/045301 |
| [34] |
J.D. Miller, Y. Hu, S. Veeramasuneni, Y. Lu, Colloids Surf. A 154 (1999) 137-147. DOI:10.1016/S0927-7757(98)00891-7 |
| [35] |
S. Yang, S.M. Dammer, N. Bremond, et al., Langmuir 23 (2007) 7072-7077. DOI:10.1021/la070004i |
| [36] |
P. Tamarat, A. Maali, B. Lounis, M. Orrit, J. Phys. Chem. A 104 (2000) 1-16. |
| [37] |
X.S. Xie, H.P. Lu, J. Biol. Chem. 274 (1999) 15967-15970. DOI:10.1074/jbc.274.23.15967 |
| [38] |
G. De Cremer, B.F. Sels, D.E. de Vos, J. Hofkens, M.B.J. Roeffaers, Chem. Soc. Rev. 39 (2010) 4703-4717. DOI:10.1039/c0cs00047g |
| [39] |
D.L. Floyd, S.C. Harrison, A.M. van Oijen, Biophys. J. 99 (2010) 360-366. DOI:10.1016/j.bpj.2010.04.049 |
| [40] |
T. Cordes, S.A. Blum, Nat. Chem. 5 (2013) 993-999. DOI:10.1038/nchem.1800 |