 2020, Vol. 31


Supercapacitor is an especially promising energy storage technology to efficiently utilized new sustainable energy sources owing to its highly power density, fast charge/discharge rate and long cycle life [1-3]. Carbon-based materials, conducting polymers and metal oxides/hydroxides are main three kinds of electrode materials for supercapacitors, which have been extensively investigated [4-6]. Compared with these conventional electrode materials, metal-organic frameworks (MOFs) are one of the most suitable advanced functional materials to be applied as electrode for supercapacitors because of their controllable pore sizes and metal ions with redox activities [7-13]. However, most MOFs are generally to sacrifice for the preparation of nano porous carbons, metal oxides/hydroxides and metal oxide/carbon composites, attributing to their poor electrical conductivities and stability [14-21]. Although conductive additives and polymer binders could improve the poor conductivity at the expense of reducing the effective surface area [22, 23], further studies are extremely desired to achieve higher storage capacity of MOFs. Under such a premise, researches on the application of conductive MOFs to supercapacitors have been developed. Recently, Dincǎ and coworkers reported a 2D conductive layers Ni-MOF, Ni3(HITP)2, successfully fabricated as the active electrode material in an EDLC without any other additives [24]. Afterwards, Xu et al. fabricated a conductive Cu-MOF nanowire arrays, which directly grown on carbon fiber papers as the sole electrodes and eliminate the interference of conductive additives or polymer binders to achieve a high capacitance [23]. Additionally, Pang et al. reported a hexagonal Ni-MOF with favorable {001} exposed facets and the cross-linked mesh structure on the surface, resulting in preeminent electrochemical performance [25]. However, due to the instability and low conductivity of most MOFs materials, few MOFs can be used directly as electrode materials for supercapacitors.
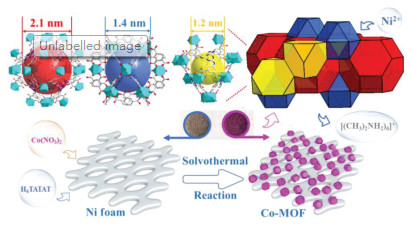
Herein, we use an anionic Co-MOF ([(CH3)2NH2]6 [Co(H2O)6]3{Co6(η6-TATAT)4(H2O)12}·6H2O) previously reported by our group [26], which can be directly grown onto the nickel foam in a controlled manner and used as integrated electrodes for supercapacitors without any other conductive additives and additive binders. The anionic Co-MOF crystallizes in cubic space group with the rht topology, was balanced by the redox-active guest [Co(H2O)6]2+ and protonated [(CH3)2NH2]2+. The Co-MOF features three large sized nanocages with diameter of 2.1 nm, 1.4 nm and 1.2 nm in 1:1:2 ratio as in Fig. 1, the calculated total accessible volume is as high as 61.6%. Large pore size and high porosity are very beneficial for fast ion and electron transfer [27-29]. Although effective porosity and specific surface of the MOF material might be reduced owing to guest molecules in the cages, the conductivity of the Co-MOF is still high and the experimental data of the resistivity and conductivity using 4-point probe method have been listed in Table S1 (Supporting information). The calculated average conductivity of the Co-MOF is 1.42 ×10⁻³ S/cm, which is higher than most of reported MOFs [7, 30]. The high conductivity may be benefit from both the unique anionic framework itself and balanced ions in the structure. The [Co(H2O)6]2+ redox-active guest molecules in the anionic frameworks not only act as charge carriers themselves, but also act as charge dopants to induce free charge carriers in the MOF framework through guest-framework charge-transfer interactions [31]. Additionally, the ion-exchange among the [Co(H2O)6]2+ and [(CH3)2NH2]2+ molecules in the structure and K+ in aqueous electrolyte could further induce free charge in the process of charge-discharge measurements. Furthermore, the surface of nickel foam could dissolve partially in the presence of the hexacarboxylic acid ligand in reaction process, and cetyltrimethylammonium bromide (CTAB) could change the content of dissolved Ni2+ in reaction system, which might influence the properties of final synthesized Co-MOF.

|
Download:
|
| Fig. 1. The structure of the Co-MOF and the in-situ growth design of Co-MOF on Ni foam. | |
All the chemicals and solvents were directly used after commercial purchase without further purification except for H6TATAT(5, 5', 5"-(1, 3, 5-triazine-2, 4, 6-triyltriimino)tri-1, 3-benzene dicarboxylic acid). In a typical synthesis, 0.3 mmol Co(NO3)2·6H2O and 0.05 mmol H6TATAT were dissolved in a mixed solvent of DMF and H2O (v/v = 6/1). Then selected two cut-out pieces of Ni foam with the same mass and the same diameter of 12 mm were added into a 23 mL Teflon-lined stainless-steel vessel containing the mixed solvent and heated at 70 ℃ for 36 h. After cooling down to room temperature, the obtained two pieces of Ni foam grown Co-MOF were washed with DMF and CH3OH and then immersed in methanol for 2 days. During the active period, fresh solvent was exchanged every 24 h and finally remove the methanol under high vacuum (< 10-8 bar) at 70 ℃. Finally, pressed the obtained Ni foam grown Co-MOF under 10 MPa pressure as working electrodes. Six cutout pieces of Ni foam added into three 23 mL Teflon-lined stainless steel containing the same mixed solvent without Co (NO3)2·6H2O, respectively, and heated at 70 ℃ for 36 h. After washing with pure water and ethanol, these six Ni foam pieces were dried under high vacuum (< 10-8 bar) at 70 ℃, and as reference samples to calculated the mass of experimental Ni foam. Based on the typical synthesis, CTAB were added to the mixed solution of Co(NO3)2·6H2O and H6TATAT in different molar ratio of ligand (1, 2, 4, 6, 8), respectively, before Ni foam added. Other experimental steps were consistent with the typical synthesis process.
The powder X-ray diffraction patterns were collected by a Rigku D/max-2200 with Cu-Kα radiation (λ = 1.54184 Å), 35 kV, 30 mA, with a scanning rate of 0.03°/s (2θ) at room temperature. The X-ray photoelectron spectroscopy (XPS) were characterized by a ESCALAB250Xi. The scanning electron microscopy (SEM) and energy dispersive spectrometry (EDS) analyses were performed on a SU5000.
Cyclic voltammograms (CV) and galvanostatic charge-discharge curves were measured on a CHI660E electrochemical workstation (Chenhua, Shanghai, China). The electrochemical experiments were carried out using a typical three-electrode cell in 3.0 mol/L KOH electrolyte. The samples were used as working electrodes and platinum as the counter electrode and Hg/HgO electrode as a reference electrode. The mass loading of active materials on Ni foam was determined by calculated the mass difference between the loading Ni foam and reference Ni foams. Generally, the mass loading was at the range of 4 mg to 6 mg.
The specific capacitance of Co-MOF electrodes was calculated from the discharge curves according to the equation below:
|
where Cs is the specific capacitance (F/g), I is the discharge current (A), Δt is the discharge time (s), m is the mass of the active materials (g) and ΔV is the potential voltage (V).
The scheme of the in-situ growth design of Co-MOF on Ni foam illustrates in Fig. 1. The cut-off pieces of Ni foams were added into a mixed solvent of DMF and H2O, which has been dissolved a certain molar ratio of Co(NO3)2·6H2O and H6TATAT (5, 5', 5"-(1, 3, 5-triazine- 2, 4, 6-triyltriimino)tri-1, 3-benzenedicarboxylic acid). After a standard solvothermal reaction with the reaction temperature of 70 ℃ for 36 h, the Ni foam has been covered evenly with purple crystals of Co-MOF. The as-synthesized samples characterized by XRD and compared with crystal sample and simulated curves (Fig. 2a). The XRD pattern of Co-MOF is corresponding to the simulated one, and the major peaks of {100}, {003}, {300} facets are obviously observed, the diffraction peaks of {101}, {111}, {200}, {004} facets are existed as well. The result demonstrates that the Co-MOF can be grown directly on the Ni foam through the in-situ strategy. X-ray photoelectron spectroscopy (XPS) were measured to further explore the chemical composition of the Co-MOF sample and the results are presented in Figs. 2b–d. The full survey scan spectrum indicates that the existence of Co, Ni, O, N and C elements. Among them, Co, O, N and C are the elements composition of reactants. The fitting peaks at 797.2 eV and 781.9 eV with a spin energy separation of 15.3 eV are attributed to the state of Co 2p1/2 and Co 2p3/2 in the high-resolution Co 2p spectrum, and two broad peaks could be identified as shake-up satellites (Sat.) owing to spin-orbit coupling. Additionally, the energy bands of 874.3 eV and 856.4 eV corresponding to the state of Ni 2p1/2 and Ni 2p3/2 with a spin energy separation of 17.9 eV, and two additional satellite peaks could be observed owing to spin-orbit coupling. The XPS results demonstrate that Ni element enters the structure in the as-synthesized samples at the valence state of Ni2+ [32]. The Ni is derived from the partial dissolution of Ni foam during the reaction under the existence of the hexacarboxylic acid ligand and partially dissolved Ni2+ ions enters the as-synthesized products. The anionic framework of Co-MOF could capture these free Ni2+ ions in cages or surface during reaction process through the electrostatic interactions.

|
Download:
|
| Fig. 2. (a) XRD patterns of the Co-MOF and (b-d) XPS spectra of the as-synthesized Co-MOF sample: (b) The full survey scan spectrum, (c) Co 2p, (d) Ni 2p. | |
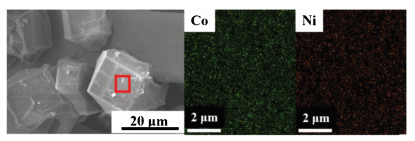
To further verify the composition of as-synthesized samples, energy-dispersive X-ray spectroscopy (EDS) and elemental mapping images were measured. The Co-MOF crystals grow in an embedded form on the surface of Ni foam and the average diameter of Co-MOF crystals exhibit about 20 μm (Fig. 3). The metal atomic rate of Co-MOF measured through EDS listed in Table 1, which confirms that Ni2+ ions already enters the as-synthesized products and the atomic ratio to Co is 38.86%. Moreover, the elemental mapping of Co-MOF shows both Co and Ni distributed uniformly in selective region, corresponding to the result of XPS.

|
Download:
|
| Fig. 3. SEM and elemental mapping images of Co-MOF. | |
|
|
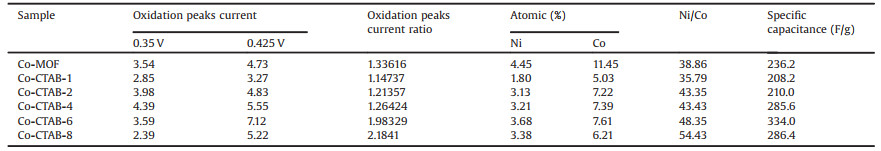
Table 1 The oxidation peaks current and atomic of Co-MOF with different concentration of CTAB. |
Different concentrates of KOH electrolytes were studied to define the optimal electrochemical environment (Fig. S6 in Supporting information), and cyclic voltammetry (CV) and galvanostatic charge-discharge (GCD) were measured to investigate the pseudocapacitive performances of as-synthesized samples with the potential range of 0.0-0.5 V in 3 mol/L KOH aqueous solution electrolyte. Fig. 4a exhibits the CV curves of Co-MOF in 3 mol/L KOH at different scan rates from 5 mV/s to 200 mV/s. Apparent redox peaks could be observed in anodic and cathodic sweeps indicates that Co-MOF performs pseudocapacitive characteristics and all of these CV curves illustrate a similar shape. Meanwhile, the currents of the redox peaks gradually improve with the increasing of the scan rate, and the redox peaks even could be observed at a high scan rate at 150 mV/s, indicating that Co-MOF electrodes perform excellent kinetic reversibility and rate performance [32, 33]. In addition, the positions of anodic and cathodic peaks shift slightly as the scan rate increases, which mainly caused by the polarization of electrodes, revealing the Co-MOF electrodes possess the feature of fast ion/electron transport rate and low resistance [34, 35]. The GCD curves of Co-MOF were carried out at various current densities with the potential range of 0.0-0.5 V (Fig. 4b). The calculated value of specific capacitance is 236.2 F/g at 1 A/g and a higher specific capacitance of 240 F/g can be achieved at 0.5 A/g. When the current density up to 10 A/g, still 61% of capacitance could retain with the value of 144 A/g compared with the value at 1 A/g, indicating the superior rate capability of Co-MOF. The diffusion rate of electrolyte ions and the charge transfer process are insufficient to satisfy the electrochemical reaction, resulting in the storage capacity decreases as the current density increasing [36, 37].

|
Download:
|
| Fig. 4. (a) CV curves of Co-MOF at different scan rate in 3 mol/L KOH; (b) the charge/ discharge curves of Co-MOF at different current density. | |
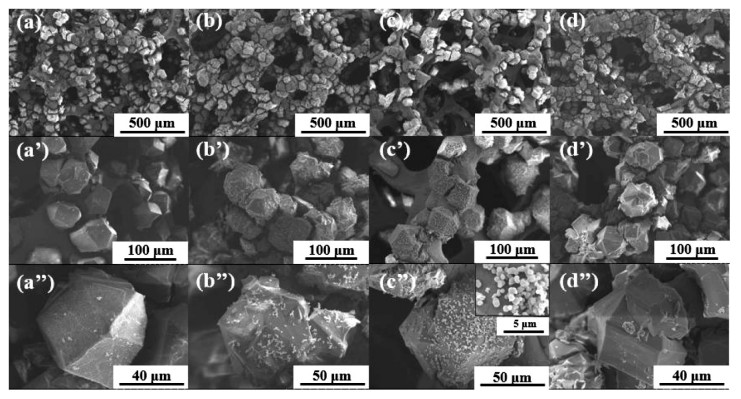
In order to further improve the capacitance properties, a structure-capping surfactant of CTAB were used to change the growth environment of Co-MOF. Vary concentrate of CTAB were added in the reacted solution before programmed heating. The structure and morphology of Co-MOF reacted under different concentrations of CTAB were characterized by SEM, as shown in Fig. 5. After adding CTAB, the crystals sizes of all samples are increased to a diameter about 50 μm. With the increasing of CTAB, more and more small crystal particles with diameters nearly 1~2 μm attached to the surface of the embedded large-sized crystal grains and tend to distribute uniformly. The elemental mapping of Co-CTAB-6 reveals that the metal elements distribute uniformly as well, no matter whether the small crystal particles exist (Fig. S2 in Supporting information). The EDS testing performed on different position of the sample further convinced the same composition of the embedded large-sized crystal grains and the small crystal particles. As shown in Fig. S2, the atomic rates of Ni/Co of the small particles and large crystal grains are both around 50%, revealing the same composition with different morphology. However, the crystal structure begins to collapse when the amount of CTAB increased to 8 times that of the ligand.

|
Download:
|
| Fig. 5. SEM images of (a) Co-CTAB-1, (b) Co-CTAB-2, (c) Co-CTAB-6 and (d) Co-CTAB-8. | |
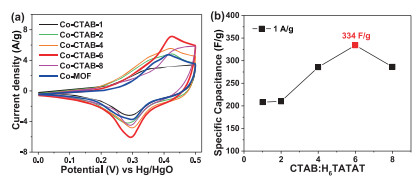
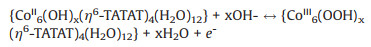
Fig. 6a illustrates the CV curves of Co-MOF under different ratios of CTAB:H6TATAT at 10 mV/s. All CV curves exhibit a reduction peak at nearly 0.294 V and two oxidation peaks at around 0.35 V and 0.425 V, respectively. Additionally, oxidation peaks current ratio of these two oxidation peaks has been summarized in Fig. 7c and Table 1. After the addition of CTAB, the oxidation peak current ratio has the same change trend as the Ni/Co element ratio. As the content of CTAB increases, the proportion of Ni in crystals increases as well as the oxidation peak current ratio, indicating that the oxidation peaks are corresponding to the Co and Ni oxidation process, respectively. Based on the above measurements, the charge storage mechanism of Co-MOF could be expounded by the following equations (Eqs. 1 and 2):

|
Download:
|
| Fig. 6. (a) CV curves (10 mV/s) and (b) specific capacitance (1 A/g) of Co-MOF obtained under different concentrations of CTAB. | |

|
Download:
|
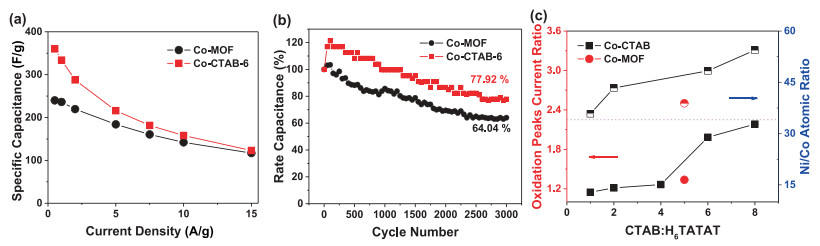
| Fig. 7. The comparison of Co-MOF and Co-CTAB-6: (a) specific capacitance; (b) rate capacitance and (c) oxidation peaks current ratio and Ni/Co atomic ratio. | |

|
(1) |
|
(2) |
Moreover, the [Co(H2O)6]2+ in the anionic framework as redoxactive guest molecules also reacted in the redox process, which similar to the redox reaction of cobalt on the node of Co-MOF framework and can be explained by the following equation:

|
(3) |
Furthermore, the guest [Co(H2O)6]2+ and protonated [(CH3)2NH2]2+ molecules balance and support the anionic framework to prevent the collapse of the structure, thus ensuring the stability of Co-MOF and providing enough reaction surface area of electrolyte and Co-MOF as well as the fast ion and electron transfer.
With the increase of the content of CTAB, the integrated areas of CV curves gradually expanded (Fig. 6a) and the specific capacitance could up to 334 F/g at 1 A/g and 360 F/g at 0.5 A/g of Co-CTAB-6 sample (Fig. 6b). The specific capacitance of Co-CTAB-6 at 10 A/g decays to 158 F/g, only 47% capacitance retained compared with the value at 1 A/g. Although poor rate performance of Co-CTAB-6 exhibits, the overall capacitance is higher than that of the Co-MOF sample (Fig. 7a). Alternatively, the cycle stability of Co-CTAB-6 is superior than Co-MOF, as shown in Fig. 7b. The specific capacitance of Co-CTAB-6 increases in the initial 100 cycles owing to the increase of wettability of the active electrode materials in electrolyte as well as the electro activation process of the active MOF materials at the electrode-electrolyte interface [38, 39], and then gradually declines. After 3000 times cycling, the capacitance remains 77.92% of Co-CTAB-6, revealing that the Co-CTAB-6 electrodes exhibit superior stable performance. While the capacitance of Co-MOF remains 64.04% only and continue to decrease as the cycle number increases. However, the integrated area of CoCTAB-8 sample has been reduced and the corresponding capacitance decreased as well. The specific capacitance of Co-CTAB-8 reduces to 286.4 F/g at 1 A/g, attributing to the collapsed structure of crystal grains. Combined with the morphology images of SEM (Fig. 5), structural integrity and uniformly small crystal particles attached to the surface of larger-sized grains promote the storage properties of the Co-MOF materials. In addition, the content of CTAB changes the growth environment of Co-MOF on Ni foam in the reaction process, resulting in the difference of Ni proportion in final products. The atomic ratio of Ni/Co closes to 50% leads to the best storage performance.
In summary, a conductive anionic Co-MOF cage with zeolite framework was designed in-situ grown on the Ni foam as the electrodes for supercapacitors without any conductive additives. And the final electrodes exhibit superior electric performance with a specific capacitance of 236.2 F/g at 1 A/g as well as good rate capability. The superior electrical conductivity may benefit from the unique anionic framework, large internal pore volumes, and the [Co(H2O)6]2+ redox-active guest molecules in cages. In addition, the adding of CTAB in different proportions could modify the morphology of Co-MOF through changing the reaction environment. Obviously, 6 molar ratio of CTAB and ligand is the best result. Co-CTAB-6 shows a higher specific capacitance of 334 F/g at 1 A/g and cycle stability has also been improved, the capacitance can still remain 77.92% after 3000 times cycling. This work points to the anionic framework of MOFs is advantaged as active electrochemical materials, in which electron transfer between guest molecules and metal ions or organic ligands helps to create electron transport channels and high charge density.
Declaration of competing interestThe authors declare that they have no known competing financial interests or personal relationships that could have appeared to influence the work reported in this paper.
AcknowledgmentsWe gratefully acknowledge the National Key Research and Development Program of China (Nos. 2017YFB0102200, 2017YFB0102900), the National Natural Science Foundation of China (No. 21571126) and the Shanghai Key Laboratory of High Temperature Superconductors (Nos. 14DZ2260700, 16DZ0504300) for financial support.
Appendix A. Supplementary dataSupplementarymaterial related to this article canbefound, in the online version, at doi:https://doi.org/10.1016/j.cclet.2020.04.017.
| [1] |
A. Banerjee, K.E. Halvorsen, A. Eastmond-Spencer, S.R. Sweitz, Environ. Manage. 59 (2017) 912-923. DOI:10.1007/s00267-017-0848-x |
| [2] |
H. Zhang, J. Nai, L. Yu, X.W. (David) Lou, Joule 1 (2017) 77-107. DOI:10.1016/j.joule.2017.08.008 |
| [3] |
P. Huang, C. Lethien, S. Pinaud, et al., Science 351 (2016) 691-695. DOI:10.1126/science.aad3345 |
| [4] |
G. Wang, L. Zhang, J. Zhang, Chem. Soc. Rev. 41 (2012) 797-828. DOI:10.1039/C1CS15060J |
| [5] |
X. Chen, R. Paul, L. Dai, Natl. Sci. Rev. 4 (2017) 453-489. DOI:10.1093/nsr/nwx009 |
| [6] |
T. Kou, B. Yao, T. Liu, Y. Li, J. Mater. Chem. A (2017) 17151-17173. |
| [7] |
A. Morozan, F. Jaouen, Energy Environ. Sci. 5 (2012) 9269-9290. DOI:10.1039/c2ee22989g |
| [8] |
S.L. Li, Q. Xu, Energy Environ. Sci. 6 (2013) 1656-1683. DOI:10.1039/c3ee40507a |
| [9] |
F.S. Ke, Y.S. Wu, H. Deng, J. Solid State Chem. 223 (2015) 109-121. DOI:10.1016/j.jssc.2014.07.008 |
| [10] |
L. Wang, Y. Han, X. Feng, J. Zhou, P. Qi, B. Wang, Coord. Chem. Rev. 307 (2016) 361-381. DOI:10.1016/j.ccr.2015.09.002 |
| [11] |
G. Xu, P. Nie, H. Dou, B. Ding, L. Li, X. Zhang, Mater. Today. 20 (2017) 191-209. DOI:10.1016/j.mattod.2016.10.003 |
| [12] |
X. Xiao, L. Zou, H. Pang, Q. Xu, Chem. Soc. Rev. 49 (2020) 301-331. DOI:10.1039/C7CS00614D |
| [13] |
X. Li, X. Yang, H. Xue, H. Pang, Q. Xu, EnergyChem (2020) 100027. |
| [14] |
L.F. Chen, Y. Lu, L. Yu, X.W. (David) Lou, Energy Environ. Sci. 10 (2017) 1777-1783. DOI:10.1039/C7EE00488E |
| [15] |
P. Pachfule, D. Shinde, M. Majumder, Q. Xu, Nat. Chem. 8 (2016) 718-724. DOI:10.1038/nchem.2515 |
| [16] |
B.Y. Guan, L. Yu, X. Wang, S. Song, X.W.D. Lou, Adv. Mater. 29 (2017) 1605051. DOI:10.1002/adma.201605051 |
| [17] |
Y. Han, S. Zhang, N. Shen, D. Li, X. Li, Mater. Lett. 188 (2017) 1-4. DOI:10.1016/j.matlet.2016.09.051 |
| [18] |
X. Cao, B. Zheng, W. Shi, et al., Adv. Mater. 27 (2015) 4695-4701. DOI:10.1002/adma.201501310 |
| [19] |
F. Cao, M. Zhao, Y. Yu, et al., J. Am. Chem. Soc. 138 (2016) 6924-6927. DOI:10.1021/jacs.6b02540 |
| [20] |
Y. Li, Y. Shan, H. Pang, Chin. Chem. Lett. 31 (2020). DOI:10.1016/j.cclet.2020.03.027 |
| [21] |
L. Jin, X. Li, C. Liu, H. Pang, Chin. Chem. Lett. 30 (2019) 10-13. |
| [22] |
L. Shen, B. Ding, P. Nie, G. Cao, X. Zhang, Adv. Energy Mater. 3 (2013) 1484-1489. DOI:10.1002/aenm.201300456 |
| [23] |
W. Li, K. Ding, H. Tian, et al., Adv. Funct. Mater. 27 (2017) 1702067. DOI:10.1002/adfm.201702067 |
| [24] |
D. Sheberla, J.C. Bachman, J.S. Elias, et al., Nat. Mater. 16 (2016) 220-224. |
| [25] |
Y. Li, Y. Xu, Y. Liu, H. Pang, Small 15 (2019) 1-8. |
| [26] |
Z. Zhu, Y.L. Bai, L. Zhang, D. Sun, J. Fang, S. Zhu, Chem. Commun. 50 (2014) 14674-14677. DOI:10.1039/C4CC07365G |
| [27] |
X. Cao, C. Tan, M. Sindoro, H. Zhang, Chem. Soc. Rev. 46 (2017) 2660-2677. DOI:10.1039/C6CS00426A |
| [28] |
X. Ren, H. Fan, J. Ma, et al., Appl. Surf. Sci. 441 (2018) 194-203. DOI:10.1016/j.apsusc.2018.02.013 |
| [29] |
X. Wu, B. Ding, C. Zhang, B. Li, Z. Fan, Carbon 153 (2019) 225-233. DOI:10.1016/j.carbon.2019.07.020 |
| [30] |
W. Xia, A. Mahmood, R. Zou, Q. Xu, Energy Environ. Sci. 8 (2015) 1837-1866. DOI:10.1039/C5EE00762C |
| [31] |
L. Sun, M.G. Campbell, M. Dincə, Angew. Chem. Int. Ed. 55 (2016) 3566-3579. DOI:10.1002/anie.201506219 |
| [32] |
Y. Wang, Y. Liu, H. Wang, et al., ACS Appl. Energy Mater. 2 (2019) 2063-2071. DOI:10.1021/acsaem.8b02128 |
| [33] |
Q. Li, C. Lu, C. Chen, et al., Energy Storage Mater. 8 (2017) 59-67. DOI:10.1016/j.ensm.2017.04.002 |
| [34] |
X. Wu, Z. Han, X. Zheng, et al., Nano Energy 31 (2017) 410-417. DOI:10.1016/j.nanoen.2016.11.035 |
| [35] |
S.G. Mohamed, I. Hussain, J.J. Shim, Nanoscale 10 (2018) 6620-6628. DOI:10.1039/C7NR07338K |
| [36] |
A.J.C. Mary, A.C. Bose, ChemistrySelect 4 (2019) 160-170. DOI:10.1002/slct.201803135 |
| [37] |
B. Liu, B. Liu, Q. Wang, et al., ACS Appl. Mater. Interfaces 5 (2013) 10011-10017. DOI:10.1021/am402339d |
| [38] |
X. Zhang, J. Luo, P. Tang, et al., Nano Energy. 31 (2017) 311-321. DOI:10.1016/j.nanoen.2016.11.024 |
| [39] |
X. Deng, J. Li, S. Zhu, et al., J. Alloys Compd. 693 (2017) 16-24. DOI:10.1016/j.jallcom.2016.09.096 |