 2020, Vol. 31


b Key Laboratory of Superlight Materials and Surface Technology of Ministry of Education, College of Materials Science and Chemical Engineering, Harbin Engineering University, Harbin 150010, China;
c Department of Mechanical Engineering, The Hong Kong Polytechnic University, Hong Kong, China
In the large-scale energy storage system, lithium ion batteries have been not meet the requirements due to the limited metal lithium resources, the serious safety and environmental problems. Rechargeable aqueous metal ion batteries have become more and more promising owning to their low cost, convenient assembly and excellent security [1-4]. Many kinds of aqueous rechargeable batteries based on polyvalent metal ion charge carriers, such as Zn2+, Mg2+ and Al3+, have been proposed because multiple electron transfer can achieve high capacity [5-7]. Among them, aqueous Zn ion batteries (ZIBs) have become one of the most promising candidates for grid-scale energy storage device due to a series of unique properties of metal zinc anodes: 1) high theoretical capacity (820 mAh/g) and energy density (5851 mAh/mL); 2) high natural abundance, low cost and no toxicity; 3) low redox potential (-0.76 V vs. standard hydrogen electrode); 4) excellent electrochemical stability in water [8-11]. Mn-based oxides with tunnel structure were first used as the main research objects of aqueous zinc ion batteries cathode materials, such as α-MnO2 [12], β-MnO2 [13], α-Mn2O3 [14] and Mn3O4 [15]. However, the Jahn-Teller deformation of the manganese oxide cathode material during the electrochemical reaction induces the induction of manganese dissolution, which results in poor rate performance and rapid capacity decrease in long-term cycling [16]. Prussian blue analogs (zinc hexacyanoferrate and copper hexacyanoferrate) were also studied as potential Zn2+ host materials, but suffered low capacity in spite of their stable structure [17, 18]. Therefore, it is essential to explore cathode materials with higher energy density and stability.
Recently, vanadium-based electrode materials, such as V6O13 [19], NaV3O8 [20], ZnxV2O5·nH2O [21], VO2 [22], (NH4)0.5V2O5 [23] and H2V3O8 [24] have attracted great attention due to their high capacity and long-term cycle stability, an open framework crystal structure and various oxidation states [25]. Xia et al. proposed a Ca0.25V2O5·0.83H2O nanobelt cathode material, which exhibited an energy density of 267 Wh/kg and a high capacity of 340 mAh/g at about 60 mA/g [26]. Sambandam et al. found that α-Zn2V2O7 nanowires has a common intercalation of H+ and Zn2+ during the discharge and offers a superior specific energy of 166 Wh/kg and high capacity retention of 85% over 1000 cycles at a high current of 4 A/g [27]. Liang et al. prepared Na5V12O24 (Na1.25V3O8) nanobelts with high capacity of 281 mAh/g at 500 mA/g in the voltage window of 0.4–1.4 V and delivers long-term cyclic stability with a capacity retention of 71% at 4 A/g for 2000 cycles [28].
In this paper, Na1.25V3O8 nanosheets as a cathode material for ZIBs were prepared by sol-gel method. We found that when the cell is charged to 1.9 V in the first cycle, Na1.25V3O8 phase was transformed to Na2V6O16 by electrochemical induced de-sodium. The results exhibit a high discharge capacity of 390 mAh/g at 0.1 A/g after the first cycle, high rate performance (162 mAh/g at 10 A/g) and superior cycle stability (179 mAh/g with a high capacity retention of 88.2% of the maximum capacity after 2000 cycles). The mechanism of the phase transformation is also investigated.
During the preparation of electrode materials, all chemicals were of analytical grade and used without further purification. Na1.25V3O8 nanosheets were prepared by sol-gel method. In a typical procedure, 3.64 g V2O5 and 7.56 g H2C2O4 were added to 100 ml deionized water and stirred at 80 ℃ to form a blue solution. Then, 1.15 g NaNO3 was added until a gel was formed under continued heating and stirring for about 4 h. The obtained gel dried at 110 ℃ for 10 h, and last calcined in air at 400 ℃ for 8 h.
Characterization and performance testing of synthetic materials are investigated by various means. The crystallographic structure and phase purify of the as-prepared products were measured by power X-ray diffraction analyzer (XRD, 7000, Shimadzu) with Cu Kα radiation (λ =1.5406 Å). The morphology and structure of the samples were characterized by using scanning electron microscope (SEM, Hitachi-4800) and high-resolution transmission electron microscope (HRTEM, JEM-2100 PLUS, 200 kV). X-ray photoelectron spectra (XPS) studies were conducted with a Kratos Axis Ultra DLD photoelectron spectrometer. The galvanostatic charge/discharge tests were at room temperature by Land CT 2001 automatic battery testers. Cycling voltammetry (CV) was measured by Bio-Logic VSP-300 multichannel electrochemical workstations. The electrochemical tests were performed with coin-type cells (CR2032). Firstly, the active materials and carbon black (super P) were weighed at a mass ratio of 7:2 and mixed average for 1 h. Next, 10 wt% polymer binder (polytetrafluoroethylene, PTFE) solution was added to the mixture through a pipette and stirred for 10 min to increasing the flexibility of the mixture. Last, the mud-like mixture was pressed onto a 1 cm carbon paper disc. After drying in air at 60 ℃ for 6 h, a working electrode was obtained. The coin cells were assembled in open air atmosphere using a zinc foil (Alfa Aesar) as the anode, a glass fibre (GF/D, Whatman) as the separator and a Na1.25V3O8 nanosheets electrode as the cathode. 3 mol/L Zn(CF3SO3)2 as an additive in H2O was used as the electrolyte.
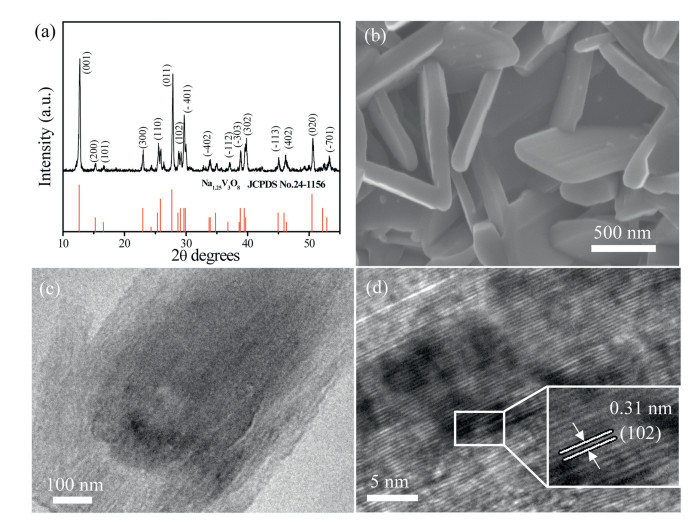
From the X-ray diffraction test results in Fig. 1a, it can be seen that all the diffraction peaks can be well indexed to the monoclinic structure of Na1.25V3O8 (JCPDS No. 24-1156) with space group P21/m (11). XPS analysis was performed to investigate the chemical state of the prepared samples. Fig. S1a (Supporting information) shows the full measurement scan spectrum of Na1.25V3O8. A series of peaks from C 1s, V 2p, O 1s and Na 1s were clearly observed, in which the spectra were calibrated using the C 1s peak at 284.6 eV. Fig. S1b (Supporting information) presents the high-resolution V 2p spectrum. After fitting and analyzing the peaks, it is found that the peaks at 516.0 eV for V 2p3/2 and 523.8 eV for V 2p1/2 can be assigned to vanadium in +4 oxidation state, respectively. Other peaks located at binding energies of 517.2 and 524.8 eV correspond to the V 2p3/2 and V 2p1/2 of vanadium in the +5 oxidation state, respectively [29]. O 1s spectrum (Fig. S1c Supporting information) is devoted into three peaks centered at 529.9 eV, 531.7 eV and 533 eV, where the peak at 529.9 eV can be interpreted as a metal-oxygen bond. The peak at 531.7 eV and 533.0 eV can be attributed to the fact that C=O and C—OH loosely combine oxygen on the surface, respectively [30].

|
Download:
|
| Fig. 1. (a) XRD patterns of the as-synthesized products. (b) High magnification SEM images of Na1.25V3O8 nanosheets. (c) TEM images of the Na1.25V3O8 nanosheets. (d) HRTEM image of Na1.25V3O8 nanosheets. | |
The morphology and structure of the synthesized Na1.25V3O8 nanosheets was studied by FE-SEM and TEM. From the low magnification FESEM images, the Na1.25V3O8 nanosheets shape is regular and uniform, as shown in Fig. S2 (Supporting information). Fig. 1b presents high magnification SEM images, indicating that the prepared Na1.25V3O8 nanosheets possess a width of ~500 nm and an average thickness of ~100 nm. Figs. 1c and d deliver the TEM and HRTEM images of Na1.25V3O8 nanosheets, respectively. It is obviously found that the lattice spacing is 0.31 nm, which matches well with the (102) plane of the monoclinic structured Na1.25V3O8 nanosheets, indicating the growth direction of the material is along the [102] axis.
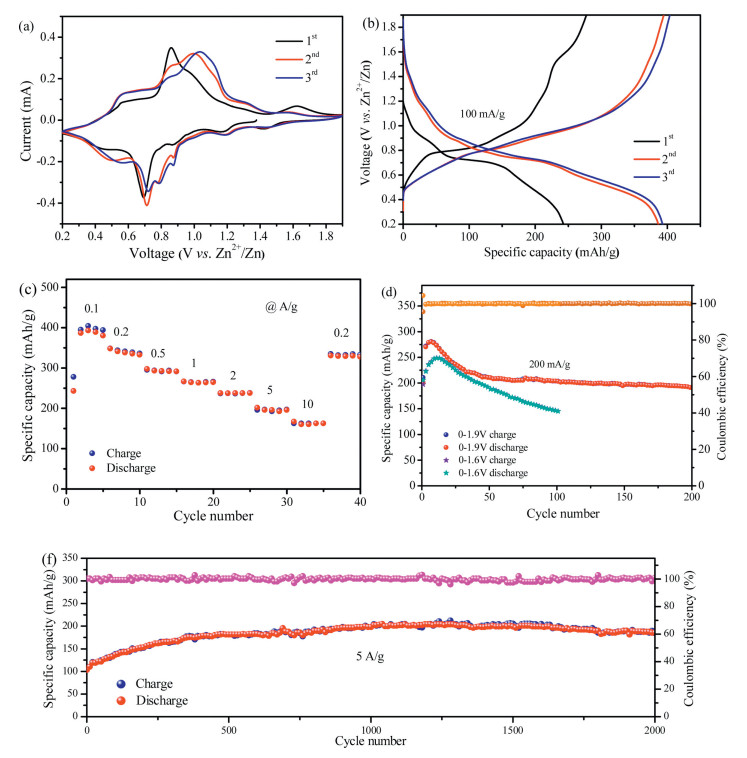
In order to investigate the electrochemical performance of Na1.25V3O8 nanosheets, a series of electrochemical tests were performed on the assembled Zn//Na1.25V3O8 coin cell. Cyclic voltammetry of the battery was measured using a scan rate of 0.1 mV/s with a potential range of 0.2–1.9 V, as shown in Fig. 2a. Four different reduction peaks appear at around 1.2 V, 0.9 V, 0.7 V and 0.4 V, which might be attributed to the multi-step electrochemical embedding process of Zn2+ in the layered framework.Moreover, in the anode scan, the oxidation peaks observed at about 0.55 V, 0.86 V, 1.0 V and 1.6 V demonstrated the de-intercalation process of Zn2+ ions in the layered structure. Among the reduction and oxidation peaks, the redox couples at 0.7 V/ 0.86 V and 0.9 V/ 1.0 V can be attributed to V5+/V4+ redox couples, and the redox couples at 0.4 V/0.55 V represent the V4+/V3+ redox couple. A new redox couples at about 0.8 V/1.0 V appeared in the cathode scan of the subsequent cycle, which is similar to the redox couples of Na2V6O16·2.14H2O [31]. In addition, the oxidation peak at 1.6 V disappears in the next cycles, which is not reported in previous literatures as the charge cutoff voltage is usually 1.6 V. In addition, second and third cycles of the CV curve show similar redox peaks with good overlap, demonstrating good electrochemical reversibility of intercalation/de-intercalation of zinc ions of the Na1.25V3O8 electrode.

|
Download:
|
| Fig. 2. (a) Cyclic voltammograms of Na1.25V3O8 cathode at the scan rate of 0.1 mV/s with the electrochemical window of 0.2-1.9 V for the first three cycles. (b) Discharge/ charge curves of the Na1.25V3O8 cathode at 0.2 A/g within the voltage window of 0.2-1.9 V and 0.2-1.6 V, respectively. (c) Rate performance of Na1.25V3O8 cathode at different current densities. (d) Cycle performance at a current rate of 200 mA/g. (e) Long-cycling stability at 5 A/g. | |
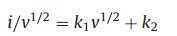
Fig. 2b shows the corresponding discharge/charge curves at a current density of 100 mA/g. At the first cycle, the Na1.25V3O8 electrode shows a discharge capacity of 242 mAh/g. However, a high charge capacity of 278 mAh/g can be obtained with a plat appeared at about 1.6 V. In the next two cycles, the discharge specific capacities increase to about 390 mAh/g with ~100% coulombic efficiency. The similar charge/discharge curves indicate the structural reversibility of the electrode after the first cycle. The rate performance of the Na1.25V3O8 electrode is shown in Fig. 2c. With current density gradually increased, the Na1.25V3O8 electrode exhibits an average discharge capacity of 382, 340, 293, 263, 239, 196 and 162 mA/g at 0.1, 0.2, 0.5, 1, 2, 5 and 10 A/g, respectively. When the current density is gradually back to 0.2 A/g, an average discharge capacity of 330 mAh/g can be obtained, indicating a good rate performance and reversibility of the Na1.25V3O8 electrode for Zn insertion/extraction reactions. Fig. 2d shows the results of a constant current charge and discharge test of Na1.25V3O8 cell at 200 mA/g. The capacity of Na1.25V3O8 electrode increases gradually after the first cycle, which can be attributed to the electrode activation process [17]. A maximum capacity (280 mAh/g) of Na1.25V3O8 electrode can be obtained after about seven cycles. The capacity decreases to 210 mAh/g after 50 cycles with 75% coulombic efficiency. However, the cell could deliver a reversible capacity of 191 mAh/g with a 90.1% coulombic efficiency after next 150 cycles, indicating a stable cycle ability of Na1.25V3O8 electrode. In addition, we also test the cycle performance of Na1.25V3O8 electrode at the current density of 200 mA/g in the voltage window of 0.2–1.6 V. The discharge capacity decreases to 145 mAh/g after 100 cycles with a retention of 58%, indicating a low cycling stability. Fig. 2e shows the cycling performance of Na1.25V3O8 electrode at high current density of 5 A/g in the voltage range from to 0.2 V to 1.9 V. The capacity of the electrode shows a slowly increasing process in the first 1000 cycles and reaches a maximum capacity of 203 mAh/g, which can be attributed to the sodium removal slowly from the host structure at the fast charge-discharge process. After 2000 cycles, a capacity of 179 mAh/g is retained with a high capaciy retention of 88.2% of the maximum capacity, indicating an excellent cycle stability of Na1.25V3O8 electrode in the fast charge/discharge process. To further understand the electrochemical reaction kinetics of the Na1.25V3O8 nanosheet electrode, pseudocapacitive charge storage and diffusion-controlled processes of the electrode are quantitatively analyzed through CV curve measurements (Fig. 3a) at various scanning rates (0.1–1.0 mV/s). With the increased scan rates from 0.1 mV/s to 1.0 mV/s, the CV curves display similar shapes and gradual broaden peaks can be observed. Based on the sweep voltammetry test data, a general method for analyzing the electrochemical kinetics processes is conducted by the following equation [32]:

|
(1) |

|
Download:
|
| Fig. 3. (a) CV profles from the Na1.25V3O8 electrode at various scan rate from 0.1 mV/s to 1.0 mV/s. (b) log i versus log v plots according to the CV data at selected oxidation/reduction states. (c) CV curve displaying the capacitive contribution (gray region) to the total current at 0.5 mV/s. (d) Normalized contribution ratios of diffusion and capacitive capacity at different scan rate. (e, f) GITT curves and the corresponding Zn2+ diffusion coefficient of Na1.25V3O8 vs. Zn2+/Zn in the first discharge process. | |
where i is peak current, v is scan rate, a and b are variable parameters. The b value of 0.5 depicts the diffusion-controlled process, while the value is 1.0 indicates that the capacitor-like process. The b values of the five peaks were determined to be 0.94, 0.70, 0.81, 0.85 and 0.99 (Fig. 3b), for Na1.25V3O8 electrode, by the slope of the log(i) versus log(v) curve, demonstrating that a capacity contribution from surface-induced capacitive behavior. Therefore, it is inferred that the electrochemical kinetics regulation primarily capacitor-like process. Furthermore, the ratio of capacitive contribution in total capacity can be calculated by separating the diffusion control and pseudocapacitive current response, as described belows [33]:

|
(2) |
or
|
(3) |
k1 and k2 correspond to capacitive and diffusion-limited redox reactions at a particular voltage, respectively. As shown in Fig. 3c, 73% of the current can be attributed to the capacitive behavior response at a scan rate of 0.5 mV/s, which is responsible for excellent rate capability of the Na1.25V3O8 electrode. In addition, contribution ratios of capacitive mechanisms at different scan rates are calculated, as delivered in Fig. 3d. About 58% of the total capacity is displayed capacitive at a comparatively slow rate of 0.1 mV/s and the capacitive contribution ratios gradually enhance with improvement of the scan rate. When the scan rate reaches 1.0 mV/s, over 80% of the redox reaction occurs through the capacitive behavior, indicating that the capacitance contribution dominates the total capacity.
The kinetics of zinc ion diffusion in Na1.25V3O8 cathode was estimated by galvanostatic intermittent titration technique (GITT). In GITT test (Fig. 3e), the cell is discharged at a constant current of 0.1 A/g for 10 min, followed by a 30 min open circuit step to bring the voltage back to equilibrium. This process is repeated until the voltage reaches 0.2 V. The ionic diffusion coefficient in Na1.25V3O8 electrodes can be evaluated by a simplified equation [34]:

|
(4) |
where τ is the duration time of the current pulse, mB is the mass of the active material in the electrode, Vm is the molar volume of the electrode, MB is the molecular weight, S is the electrode material area, △Eτ represents the voltage change during the constant current pulse. △Es is related to the change in the steady-state voltage of the corresponding step. During the discharge process, the diffusion coefficient of zinc ions decrease rapidly at 0.75 V, which can be attributed to the phase transition with the intercalation of zinc ions. After calculation (Fig. 3f), the GITTdetermined zinc ion diffusion coeffcient is ≈10-11-10-13 cm2/s with the voltage dropped gradually, which can be due to the stronger columbic interaction of the insertion zinc ions. The diffusion coefficient is higher than the zinc ion diffusion in MnO2- based cathodes (e.g., α-MnO2 [9], 10-16-10-17 cm2/s; layered-MnO2 [35], 10-12-10-14 cm2/s) and the Li+ diffusion coeffcients in LiFePO4 and LiCoO2 electrodes (≈10-12-10-14 cm2/s) [36, 37].
For further understanding the electrochemical process of Zn2+ insertion/extraction and the mechanism of the plat at 1.6 V during the first charge process, ex-situ XRD measurements were performed to analyze the structure and phase change of Na1.25V3O8 during the front two cycles in Fig. 4a. In the discharge progressed, the diffraction peak of the (001) plane of Na1.25V3O8 slightly shifted from 2θ = 12.5° to 12.9°, indicating a decrease in the interlayer spacing. This reduction in the interplanar spacing indicates an improvement in the structural coordination owing to the strong electrostatic interaction between the intercalated zinc ions and the (V3+O8)- layers [17]. When discharged to 0.2 V, the diffraction peak with increasing intensity at about 2θ = 8° can be attributed to the new phase Zn4(OH)6SO4·5H2O formed on the surface of the Na1.25V3O8 electrode [17]. Then the peaks gradually disappear during the subsequent charging process, indicating the reversible of Zn4(OH)6SO4·5H2O phase in the cycles. Interestingly, after the first charge to 1.9 V, the peak intensity of (001) plane of Na1.25V3O8 reduces and some new peaks at 2θ = 11.7°, 39.8°, 40.1° and 46.1° appears, which can be attributed to the formation of Na2V6O16 phase (JCPDS No. 22-1412). Some Na+ ions break away from the structure of Na1.25V3O8 when charged to 1.9 V, leading to some phase transition from Na1.25V3O8 to Na2V6O16. This may be the reason that the reversible capacity of the cell increases significantly in the second cycle, as the high capacities of Na2V6O16·2.14H2O and Na2V6O16·3H2O have reported in past work [17, 27]. After the end of the 2nd cycle, both of the main peaks of Na2V6O16 and Na1.25V3O8 can be still found, indicating mixture phases exist together in the initial two charge-discharge processes. We also give insights into the evolution of valence state for V element during Zn insertion/de-intercalation, as being explored by XPS in Figs. 4b-d. In the initial state, V 2p3/2 signal can be divided into two peaks of 516.5 and 517.2 eV corresponding to V4+ and V5+, respectively. The peaks at 523.6 eV and 524.8 eV correspond to V4+ 2p1/2 and V5+ 2p1/2, respectively [27]. With the intercalation of Zn2+ and the reduction of Na1.25V3O8 (Fig. 4c), the signal of V4+ increased significantly and the V5+ component decreased, which could be ascribed to the reduction of V5+ to V4+. At the fully charge state (Fig. 4d), the V 2p spectra almost return to its initial state, but a new peak at 516.9 eV corresponded to V5+ 2p3/2 appeared, which is similar to that of Na2V6O16·2.14H2O [31]. The result proved that some Na1.25V3O8 phase was transformed to Na2V6O16 after the first cycle. Fig. S3 (Supporting information) shows the XPS spectrum of Na element at the initial state and after charged to 1.9 V, respectively. After charged to 1.9 V, the intensity of Na 1s characteristic peak is weaker than the initial state, which shows some Na elements are released from the Na1.25V3O8 structure during the charging process. The schematic illustration of the above reaction mechanism of Na1.25V3O8 is proposed in Fig. 4e.

|
Download:
|
| Fig. 4. (a) Ex-situ XRD arrays for Na1.25V3O8 at different discharge/charge states for ZIBs. (b-d) Ex situ high resolution XPS spectrum at different discharge/charge states of Na1.25V3O8. (e) Schematic illustration of the reaction mechanism of Na1.25V3O8. | |
In addition, the XRD of the Na1.25V3O8 electrode after 50 cycle at 200 mA/g and 2000 cycles at 5 A/g are shown in Figs. S4a and b (Supporting information), respectively. Interestingly, the phase of Na1.25V3O8 is changed to zinc pyrovanadate (Zn3(OH)2V2O7·2H2O, JCPDS No. 50-0570). The phase transformation has also been found in the previous reports, and the reason could be due to the strong electrostatic interaction (bonds) between the inserted [Zn(H2O)4]2+ and the vanadium-oxygen layers, which leads to the decrease of lattice spacing and the formation of Zn3(OH)2V2O7·2H2O (Fig. 4e) [38-40]. Fig. S4c (Supporting information) shows an SEM image of the electrode after 2000 cycles at 5 A/g. It can be seen that the morphology of the Na1.25V3O8 nanosheets is well maintained even after 2000 cycles, indicating that the material has excellent structural stability. In order to evaluate the practical potential of our proposed electrode and corresponding cell, the performance of Na1.25V3O8 electrode is compared with several other recently reported vanadium-based electrode materials in Fig. S4d (Supporting information). The energy density and the power density of the electrodes can be calculated by the following equations [41]:
|
(5) |
|
(6) |
where Q denotes the discharge capacity (Ah); m, i and U are the mass of the active material (kg), discharge current (A) and the main operating voltage (V), respectively. Impressively, this device delivers a maximum energy density of ≈416.9 Wh/kg with power density 143.6 W/kg. Based on the active mass of the cathode material, it still exhibits a high energy density of 164.6 Wh/kg at a high power density of 14451.4 W/kg. It can be seen that our cells offer better performance than cells based on Na2V6O16·3H2O [11], Ca0.24V2O5·0.83H2O [26], Zn2V2O7 [27], Zn0.25V2O5·nH2O [40] and H2V3O8 [42] cathodes.
In summary, we synthesized Na1.25V3O8 nanosheets by sol-gel method and reported its superior properties as a cathode material for aqueous zinc ion batteries. When charged to 1.9 V in the first cycle, the phase of Na1.25V3O8 was transformed to Na2V6O16 by electrochemical induced de-sodium. Then, the cathode delivers 390 mAh/g high capacities at a current density of 0.1 A/g and exhibits excellent rate performance and superior cycle stability. This work demonstrates a new way to improve the electrochemical performance of the layered vanadium-based materials by electrochemical induced phase transformation, which could be applied in other ternary compound for aqueous metal ions batteries.
Declaration of competing interestThe authors declare that they have no known competing financial interests or personal relationships that could have appeared to influence the work reported in this paper.
AcknowledgmentsThis work was supported by the National Key Research and Development Program of China (No. 2017YFB1103000), National Natural Science Foundation of China (Nos. 51772193, 51702063), Nature Science Fund of Liaoning Province (No. 20180550200) and the Hong Kong Scholars Programs (No. XJ2019024).
Appendix A. Supplementary dataSupplementary material related to this article canbefound, in the online version, at doi:https://doi.org/10.1016/j.cclet.2020.02.052.
| [1] |
N. Zhang, F. Cheng, Y. Liu, et al., J. Am. Chem. Soc. 138 (2016) 12894. DOI:10.1021/jacs.6b05958 |
| [2] |
M. Li, J.S. Meng, Q. Li, et al., Adv. Funct. Mater. 28 (2018) 1802016. DOI:10.1002/adfm.201802016 |
| [3] |
J.H. Huang, Z. Wang, M.Y. Hou, et al., Nat. Commun. 9 (2018) 2906. DOI:10.1038/s41467-018-04949-4 |
| [4] |
D.L. Chao, C.R. Zhu, M. Song, et al., Adv. Mater. 30 (2018) 1803181. DOI:10.1002/adma.201803181 |
| [5] |
W. Kaveevivitchai, A. Manthiram, J. Mater. Chem. A 4 (2016) 18737-18741. DOI:10.1039/C6TA07747A |
| [6] |
C. Xu, B. Li, H. Du, F. Kang, Angew. Chem. Int. Ed. 51 (2012) 933. DOI:10.1002/anie.201106307 |
| [7] |
M.H. Alfaruqi, V. Mathew, J. Song, et al., Chem. Mater. 29 (2017) 1684. DOI:10.1021/acs.chemmater.6b05092 |
| [8] |
B.Y. Tang, L.T. Shan, S.Q. Liang, J. Zhou, Energy Environ. Sci. 12 (2019) 3288-3304. DOI:10.1039/C9EE02526J |
| [9] |
S. Guo, S.Q. Liang, B.S. Zhang, et al., ACS Nano 13 (2019) 13456-13464. DOI:10.1021/acsnano.9b07042 |
| [10] |
C.P. Li, X.D. Shi, S.Q. Liang, et al., Chem. Eng. J. 379 (2020) 122248. DOI:10.1016/j.cej.2019.122248 |
| [11] |
V. Soundharrajan, B. Sambandam, S. Kim, et al., Nano Lett. 18 (2018) 2402-2410. DOI:10.1021/acs.nanolett.7b05403 |
| [12] |
B. Lee, C.S. Yoon, H.R. Lee, et al., Sci. Rep. 4 (2014) 6066. |
| [13] |
S. Islam, M.H. Alfaruqi, V. Mathew, et al., J. Mater. Chem. A 5 (2017) 23299-23309. DOI:10.1039/C7TA07170A |
| [14] |
B. Jiang, C. Xu, C. Wu, et al., Electrochim. Acta 229 (2017) 422-428. DOI:10.1016/j.electacta.2017.01.163 |
| [15] |
J. Hao, J. Mou, J. Zhang, et al., Electrochim. Acta 259 (2018) 170-178. DOI:10.1016/j.electacta.2017.10.166 |
| [16] |
M.H. Alfaruqi, S. Islam, J. Gim, et al., Chem. Phys. Lett. 650 (2016) 64-68. DOI:10.1016/j.cplett.2016.02.067 |
| [17] |
K. Lu, B. Song, Y. Zhang, H. Ma, J. Zhang, J. Mater. Chem. A 5 (2017) 23628-23633. DOI:10.1039/C7TA07834J |
| [18] |
Z. Jia, B. Wang, Y. Wang, Mater. Chem. Phys. 149 (2015) 601-606. |
| [19] |
L.M. Zhu, W.X. Li, L.L. Xie, Q. Yang, X.Y. Gao, Chem. Eng. J. 372 (2019) 1056-1065. DOI:10.1016/j.cej.2019.05.009 |
| [20] |
J. Shin, D.S. Choi, H.J. Lee, Y.S. Jung, J.W. Choi, Adv. Energy Mater. 9 (2019) 1900083. DOI:10.1002/aenm.201900083 |
| [21] |
D. Kundu, B.D. Adams, V. Duffort, S.H. Vajargah, L.F. Nazar, Nat. Energy 1 (2016) 16119. DOI:10.1038/nenergy.2016.119 |
| [22] |
Z.L. Li, S. Ganapathy, Y.L. Xu, et al., Adv. Energy Mater. 9 (2019) 1900237. DOI:10.1002/aenm.201900237 |
| [23] |
D. Bin, Y. Liu, Yang Beibei, et al., ACS Appl. Mater. Interfaces 11 (2019) 20796-20803. DOI:10.1021/acsami.9b03159 |
| [24] |
Q. Pang, C. Sun, Y. Yu, et al., Adv. Energy Mater. 8 (2018) 1800144. DOI:10.1002/aenm.201800144 |
| [25] |
G.Z. Fang, J. Zhou, A.Q. Pan, S.Q. Liang, ACS Energy Lett. 3 (2018) 2480-2501. DOI:10.1021/acsenergylett.8b01426 |
| [26] |
C. Xia, J. Guo, P. Li, X.X. Zhang, H.N. Alshareef, Angew. Chem. Int. Ed. 57 (2018) 3943-3948. DOI:10.1002/anie.201713291 |
| [27] |
B. Sambandam, V. Soundharrajan, S. Kim, et al., J. Mater. Chem. A 6 (2018) 3850-3856. DOI:10.1039/C7TA11237H |
| [28] |
X. Guo, G.Z. Fang, W.Y. Zhang, et al., Adv. Energy Mater. 8 (2018) 1801819. DOI:10.1002/aenm.201801819 |
| [29] |
G.A. Sawatzky, D. Post, Phys. Rev. B 20 (1979) 1546. DOI:10.1103/PhysRevB.20.1546 |
| [30] |
Z. Wang, Q. Ru, X.Q. Chen, et al., ChemElectroChem. 4 (2017) 2218-2224. DOI:10.1002/celc.201700420 |
| [31] |
F. Hu, D. Xie, D.P. Zhao, G.H. Song, K. Zhu, J. Energy Chem. 38 (2019) 185-191. DOI:10.1016/j.jechem.2019.03.036 |
| [32] |
D. Wang, Q.L. Wei, J.Z. Sheng, et al., Phys. Chem. Chem. Phys. 18 (2016) 12074-12079. DOI:10.1039/C6CP00745G |
| [33] |
Y. Fang, R. Hu, B. Liu, et al., J. Mater. Chem. A 7 (2019) 5363-5372. DOI:10.1039/C8TA12069B |
| [34] |
X.H. Rui, N. Ding, J. Liu, C. Li, C.H. Chen, Electrochim. Acta 55 (2010) 2384-2390. DOI:10.1016/j.electacta.2009.11.096 |
| [35] |
B. Lee, H.R. Lee, H. Kim, et al., Chem. Commun. 51 (2015) 9265-9268. DOI:10.1039/C5CC02585K |
| [36] |
C. Xia, J. Guo, Y.J. Lei, et al., Adv. Mater. 30 (2018) 1705580. DOI:10.1002/adma.201705580 |
| [37] |
M.S. Whittingham, Chem. Rev. 104 (2004) 4271-4302. DOI:10.1021/cr020731c |
| [38] |
X.Y. Chen, L.B. Wang, H. Li, F.Y. Cheng, J. Chen, J. Energy Chem. 38 (2019) 20-25. DOI:10.1016/j.jechem.2018.12.023 |
| [39] |
M. Yan, P. He, Y. Chen, et al., Adv. Mater. 30 (2018) 1703725. DOI:10.1002/adma.201703725 |
| [40] |
D. Kundu, B.D. Adams, V. Duffort, S.H. Vajargah, L.F. Nazar, Nat. Energy 1 (2016) 16119. DOI:10.1038/nenergy.2016.119 |
| [41] |
B.Y. Tang, J. Zhou, G.Z. Fang, et al., J. Electrochem. Soc. 166 (2019) A480-A486. DOI:10.1149/2.0081904jes |
| [42] |
P. He, Y. Quan, X. Xu, et al., Small 13 (2017) 1702551. DOI:10.1002/smll.201702551 |