 2020, Vol. 31


b Laboratory of Clean Energy Chemistry and Materials, State Key Laboratory of Solid Lubrication, Lanzhou Institute of Chemical Physics, Chinese Academy of Sciences, Lanzhou 730000, China
Lithium-ion batteries (LIBs), as one kind of very important commercial energy storage devices have been an unreplaced part of the portable electronic devices and electric vehicles [1-6]. However, LIBs cannot meet the continuously increasing demands, partly owing to the relatively limited/expensive and unevenly distributed lithium resources. As a new energy storage device having the similar working principles to LIBs, sodium ion (Na+) batteries (SIBs) have attracted attention due to the relatively wide distribution and low cost of sodium [7-9], and are considered the most likely alternative to LIBs. However, it is worth noting that for both SIBs and LIBs, high power density is a big challenge [10, 11]. Electrochemical capacitors (ECs) can deliver a much higher power density, and meanwhile exhibit superior cycling stability to LIBs and SIBs [12-19]. However, practical application of ECs is severely limited by their low energy density.
In recent years, hybrid capacitors (HCs) generally composed of a capacitor-type cathode and a battery-type anode have been proposed with the combination of the advantages of both batteries and ECs, i.e., the high energy and power densities [20]. Among HCs, SIHCs are of great interest because of their relatively high performance and low material cost [21, 22]. However, the sluggish kinetic process of ions in the battery-type anode materials needs to be addressed to match the swift electrochemical process in the capacitor-type cathode for achieving high performance required in practical application. It thus stimulates exploration of more suitable anode materials for SIHCs. Carbonbased materials including expanded graphite, carbon spheres, carbon fibers, porous carbon, amorphous carbon and hard carbon have been considered and intensely studied because of their unique characteristics such as relatively stable structure, good electrochemical stability and electrical conductance, natural richness, low cost and environmental friendliness [23-30]. Moreover, Na+ storage can be improved by doping heteroatoms such as boron (B), nitrogen (N), oxygen (O), sulfur (S), phosphorus (P), fluorine (F) owing to the improved electrical conductivity, increased active sites and/or surface wettability for the modified carbon materials by heteroatoms [31].
In 2013, Huang et al. first reported the improved Na+ storage performance of functionalized interconnected N-doped carbon nanofibers, which deliver a high capacity (134.2 mA h/g at 200 mA/g) and retain a high rate performance (73 mAh/g at 20 A/g) [32]. Thereafter, a series of N-doped carbon materials were reported as the anode materials, including N-doped porous carbon nanosheets, 3D N-doped graphene foams, N-doped ordered mesoporous carbon, porous N-doped carbon sphere, N-containing hollow carbon microspheres, mesoporous N-doped carbon hollow spheres, etc. [11]. Very recently, co-doping of multiple heteroatoms in carbon materials has attracted attention for Na+ storage improvement, which can be generally attributed to the synergetic effects of enhanced electrical conductance, increased active sites and/or enlarged interlayer distance of the carbon materials by the doped atoms [33-36]. For example, Zhou et al. prepared N and S codoped carbon by gas-solid reaction, and the related material exhibits the relatively high and reversible capacities of ~350 and 110 mAh/g at the current densities of 0.05 and 10 A/g, respectively [37]. Li et al. prepared N and P co-doped carbon microspheres via a hydrothermal method followed by thermal annealing, and a reversible capacity of ~305 mAh/g at 1 A/g and a good rate performance of ~136 mAh/g at 5 A/g can be delivered [38]. Although there are some advances regarding the Na+ storage in carbon materials co-doped by multiple heteroatoms, reports of the related full HCs are still rare.
In this paper, N and S co-doped nanotube-like carbon (NS-NTC) is introduced as the anode material. The half-cell measurement with the optimal NS-NTC as the anode and Na foil as the counter electrode indicates that a reversible capacity of ~304.8 mAh/g at 0.2 A/g and a good rate performance of ~124.8 mAh/g at 10 A/g in a potential window of 0.01–2.5 V can be realized. The SIHC assembled using the optimal NS-NTC as the anode and the activated polyaniline-derived carbon (APDC) as the cathode with the active mass ratio of 1:1 delivers the energy densities of ~100.9 Wh/kg at 250 W/kg and ~50.69 Wh/kg even at 12, 500 W/kg. Further test indicates that ~72% capacity retention of the SIHC can be achieved after 1500 cycles at 2 A/g.
Herein, all related chemical reagents were used directly and without further purification. Aniline (AR, 99.5%), ammonium persulfate (APS) (AR, 98.0%), citric acid (AR, 99.5%), hydrochloric acid (HCl) (36%–38%), Na2S2O3 and Polyvinylpyrrolidone (PVP) were purchased from Sinopharm chemical reagent Co., Ltd., China.
PANI nanotubes were first synthesized by low-temperature oxidative polymerization of aniline with APS in the citric acid solution [39]. The S-loaded PANI nanotubes were then prepared following the steps [40-42]: (1) 1 g PANI was dispersed into 400 mL of deionized (DI) water by sonication and then stirred at 25 ℃, which was followed by addition of 30 mg PVP and 7.6 g Na2S2O3; (2) 100 mL of HCl (1 mol/L) was dropwise added into the above mixture, and stirred at 25 ℃ for 6 h; (3) The S-loaded PANI nanotubes were collected by centrifugation, and then washed with DI water, followed by drying at 60 ℃ overnight.
NS-NTC was prepared by carbonization of the as-prepared S-loaded PANI nanotubes in a tube furnace for 2 h under argon ambient. The carbonization temperature was 550, 600 and 650 ℃ and the corresponding carbonized samples were denoted as NS-NTC-550, NS-NTC-600 and NS-NTC-650, respectively. For comparison, N-doped NTC by directly carbonizing PANI nanotubes without loading S at 600 ℃ was also prepared and denoted as N-NTC-600.
APDC as the cathode in the assembled SIHCs was prepared by carbonization of PANI nanotubes without loading S and the followed activation by KOH based on our previous work [38, 43]. First, PANI nanotubes were carbonized in a tube furnace at 800 ℃ for 1 h at a heating rate of 5 ℃/min under argon atmosphere. Then, 0.5 g carbonized powder was impregnated with 3 g KOH in a mixed solvent of 2 mL ethanol and 3 mL DI water, and dried by magnetic stirring at 80 ℃. The mixture was then annealed at 800 ℃ for 1 h with a heating rate of 5 ℃/min under argon atmosphere. After annealing, the sample was washed using the dilute HCl solution and DI water until pH 7. Finally, the products were collected and dried at 60 ℃ in an oven.
The morphology was investigated using field emission scanning electron microscope (FESEM, JSM-5601LV, Japan). The microstructure and chemical composition were characterized by transmission electron microscope (TEM, JEOL 2100 FEG), micro-Raman spectroscopy (LabRAM HR Evolution) with an excitation wavelength of 532 nm and powder X-ray diffraction (XRD, Smart APEX Ⅱ). The nitrogen adsorption–desorption isotherm measurements were carried out by an ASAP 2020 volumetric adsorption analyzer (Micromerit-ics, USA)at 77 K. Elemental content and surface composition were measured by X-ray photoelectron spectroscopy (ESCALAB 250Xi) with monochromatic Al-Kα radiation (hv =1486.6 eV) at 210 W.
The anodes were prepared by mixing NS-NTC, carbon black and polyvinylidene difluoride (PVDF) with a mass ratio of 8:1:1 in N-methyl-2-pyrrolidone (NMP) solvent. The mixture slurry was coated on a copper foil with a diameter of 1.2 cm, and then dried at 110 ℃ for 12 h under vacuum. The Na+ half cells were assembled in 2032 coin cells using NS-NTC as the working electrode, metallic Na foil as the counter electrode and 1 mol/L NaClO4 in a mixture of ethylene carbonate (EC) and dimethyl carbonate (DMC) (50:50, volume ratio) as the electrolyte. Here, it is worth noting that the mass loading of NS-NTC for both half cells and full capacitors is ~0.8 –1.5 mg.
The SIHC devices were assembled with NS-NTC as the anode and APDC as the cathode in 2032 coin cells. For preparation of the cathodes, mixture of 90 wt% APDC and 10 wt% binder (polytetrafluoroethylene, PTFE) was coated on an aluminum foil current collector, and then dried at 150 ℃ for 12 h under vacuum. Device assembling was conducted in an argon-filled glovebox. The mass ratio of the anode and cathode active materials, i.e., NS-NTC and APDC was adjusted to 2:1, 1:1, 1:2 and 1:3 for performance optimization.
All the electrochemical measurements were performed at room temperature. Cyclic voltammetry (CV) and galvanostatic charge/discharge (GCD) measurements were conducted on the electrochemical workstations (CHI660D, Shanghai, China and Autolab, PGSTAT 302 N, Metrohm, Switzerland). The cycling tests of the half cells and SIHCs were carried out using a Land battery tester (LAND Electronic Co., Ltd., China).
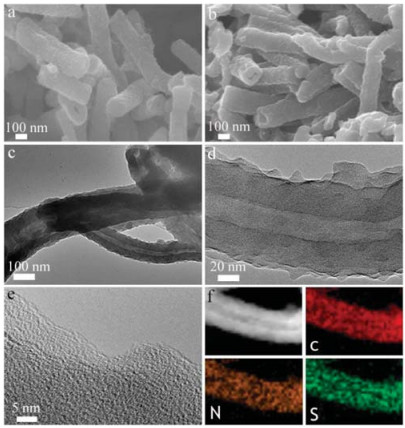
The structural information of a typical NS-NTC sample, i.e., NS-NTC-600 characterized by SEM and TEM is compiled in Fig. 1. It is evident that the NS-NTC with relatively uniform sizes well inherits the tubular structure of its precursor, PANI nanotubes, as clearly seen from Figs. 1a and b. Figs. 1c and d exhibit lowmagnification TEM images of NS-NTC-600, further confirming the tubular structure. Moreover, the high-magnification TEM image of NS-NTC-600 indicates the relatively poor crystallinity (Fig. 1e). Elemental mappings of the C, N and S elements exhibit that their distributions in NS-NTC-600 are relatively uniform, as shown in Fig. 1f. Meanwhile, the nanotubular structure of APDC as the cathode materials can be seen in Fig. S1 (Supporting information).

|
Download:
|
| Fig. 1. SEM images of (a) PANI nanotubes and (b) NS-NTC-600. (c, d) Lowmagnification TEM images of NS-NTC-600. (e) High-magnification TEM of NSNTC-600. (f) Element mappings of NS-NTC-600. | |
XRD patterns of the N-NTC-600 and NS-NTC samples are shown in Fig. 2a. Two broad peaks, corresponding to the (002) and (101) planes of graphite can be observed, and imply the poor crystallinity and/or plenty of defects of the products, consistent to the TEM characterization [44, 45]. Their Raman spectra are summarized in Fig. 2b and there are two peaks around ~1350 and 1560 cm-1 designated as D and G bands that indicate the information of the disordered and graphitization (ordered) phases, respectively [44, 46]. The intensity ratio of the D and G bands (ID/IG) is generally employed to characterize the disorder degree of carbon materials. The calculated ID/IG values for N-NTC-600, NS-NTC-550, NS-NTC- 600 and NS-NTC-650 are about 0.857, 0.870, 0.868 and 0.861, respectively. The larger ID/IG values for N and S co-doped samples compared with the case of N-NTC can be attributed to the increased disorder degree owing to S doping. Moreover, ID/IG reduces with the annealing temperature for the NS-NTC samples due to the reduced N and S contents (Fig. 5d).

|
Download:
|
| Fig. 2. (a) XRD patterns, (b) Raman spectra, (c) nitrogen adsorption-desorption isotherms, and (d) pore size distribution of N-NTC-600 and NS-NTC samples. | |
To understand the pore structure and pore size distribution (both are closely correlated to Na+ storage), nitrogen adsorption– desorption isotherm measurement was carried out for the N-NTC and NS-NTC samples, and summarized in Figs. 2c and d (The related data for APDC are compiled in Fig. S2 in Supporting information). The specific surface area (SSA) is ~322, 336 and 451 m2/g for NS-NTC-550, NS-NTC-600 and NS-NTC-650, respectively. As a distinct comparison, the SSA of N-NTC-600 is only ~84 m2/g, indicating the significant influence of S doping. The pore size distribution (Fig. 2d) indicates that there are plenty of micropores and meantime exist some mesopores and macropores in the samples. The co-existence of the pores with different sizes is beneficial to the transmission of ions and to the wettability of electrolyte, thus improving the rate performance and cycle stability of the related electrodes [47].
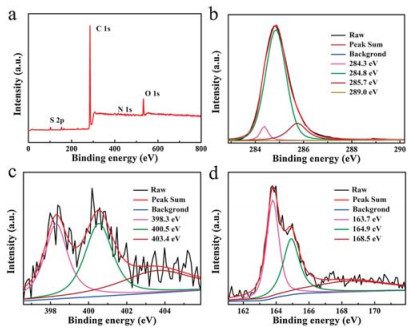
Fig. 3 shows the XPS spectra of NS-NTC-600 (For others, one can find in Fig. S3 in Supporting information). Four elements, i.e., S 2p, C 1s, N 1s and O 1s as denoted in the survey spectrum of Fig. 3a can be observed, and the calculated contents for these four elements are 1.01%, 90.03%, 1.58% and 7.39%, respectively. To further unveil the binding state, high-resolution spectra of C 1s, N 1s and S 2p are decomposed, and exhibited in Figs. 3b–d.

|
Download:
|
| Fig. 3. (a) XPS survey spectrum of NS-NTC-600, and the corresponding highresolution XPS spectra of C (b) 1s, (c) N 1s and (d) S 2p. | |
It is found that the C 1s signal is mainly composed of two peaks centering around 284.4 and 288.9 eV, which correspond to C—C and C=O bonds, respectively. Besides these two evident components, two small peaks around 284.0 and 286.3 eV can be observed, and correspond to C—S and C—N bonds. As shown in Fig. 3c, the N 1s signal can be unfolded into three peaks at ~398.3, 400.5 and 403.4 eV, which are attributed to pyridinic N, pyrrolic N and the oxidation state of N. Owing to the stronger electronegativity of N than carbon, N doping could effectively increase the conductivity of the carbon materials and meanwhile provides additional active sites. The high-resolution S 2p spectrum of NS-NTC-600 is shown in Fig. 3d, and can be unfolded into three peaks around 163.7, 164.9 and 168.5 eV, corresponding to S 2p3/2, S 2p1/2 and oxidized sulfur species (—C—SO4—C— or —C—SO3—C—) [48-50]. The doped S atoms are mainly located at the edge of the carbon material and generate defect/active sites [50].
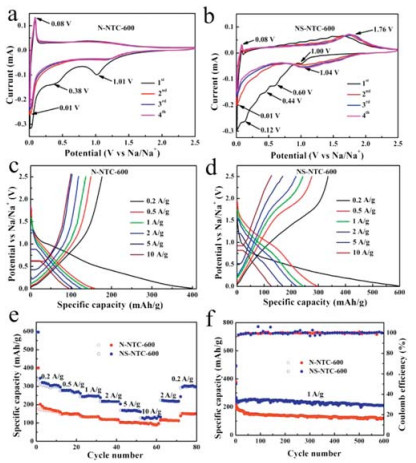
CV curves of the half cells recorded in the voltage range of 0.01–2.5 V at 0.2 mV/s are summarized in Fig. 4a and b. It is evident that there are two cathodic peaks around 0.38 and 1.01 V vs. Na/Na+ in the first cycle for N-NTC-600 (Fig. 4a), which are ascribed to the electrolyte decomposition and the formation of a solid electrolyte interface (SEI) and disappear in the subsequent cycles. Moreover, a pair of obvious peaks around 0.01 and 0.08 V indicate the insertion and extraction of Na+ in micropores. Compared to N-NTC-600, four smaller cathodic peaks around 0.12, 0.44, 0.60 and 1.00 V in the first cycle can be observed and disappears in the subsequent cycles for NS-NTC-600 (Fig. 4b), which are associated with the formation of SEI in the first cycle [51, 52]. Moreover, the cathodic peak around 1.04 V and anode peak of ~1.76 V can be assigned to conversion of S—C—S/C=S bonds [33]. One notes that similar to the N-NTC case, two peaks around 0.01 and 0.08 V are also observed, corresponding to the insertion and extraction of Na+ in micropores, respectively [53].

|
Download:
|
| Fig. 4. Electrochemical performances of N-NTC-600 and NS-NTC-600. The CV curves of (a) N-NTC-600 and (b) NS-NTC-600 in 0.01–2.5 V at a scan rate of 0.2 mV/s. The GCD curves of (c) N-NTC-600 and (d) NS-NTC-600 at different current densities. (e) Rate performance and (f) cycling test at 1 A/g of N- NTC-600 and NS-NTC-600. | |
Figs. 4c and d show the GCD curves of the corresponding half cells measured at different current densities in the voltage range of 0.01–2.5 V. Compared with N-NTC-600, besides the enhanced Na+ storage capability, there are two distinct platforms around 1.76 and 1.04 V for the charging and discharging curves of NS-NTC-600, respectively, which can be attributed to the S doping. Fig. 4e summarizes the rate performance, and NS-NTC-600 exhibits superior performance to N-NTC-600, which could be attributed to the increased active sites for Na+ storage and to the improved insertion and extraction of Na+ in the active material because of the N and S co-doping. The cycling performance of N-NTC-600 and NS-NTC-600 recorded at a constant current density of 1 A/g between 0.01 and 2.5 V is shown in Fig. 4f. After the irreversible capacity loss in the first cycle, the second discharge capacity reaches ~265.0 mAh/g, and a reversible capacity of ~211.0 mAh/g can still be obtained even after 600 cycles with a capacity retention of ~79.6% relative to the capacity of the second cycle for NS-NTC-600. As a distinct comparison, the specific capacity of N-NCT is only ~117.0 mAh/g after 600 cycles, further indicating the positive contribution of the synergistic effects of N and S co-doping to Na+ storage.
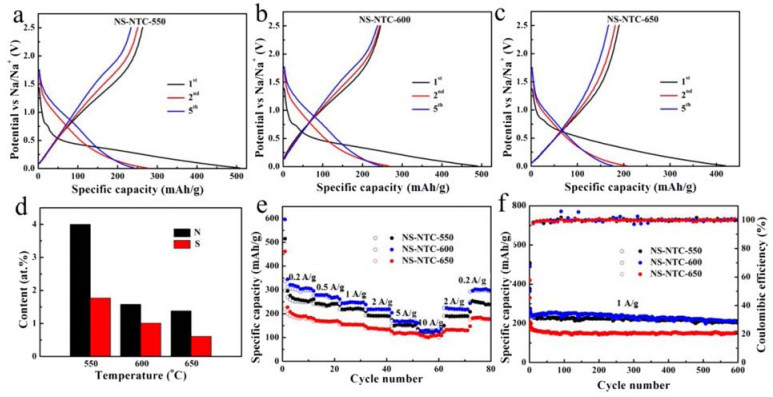
Comparison of the electrochemical performance was also conducted for the NS-NTC samples to understand the effect of annealing temperature. Figs. 5a–c show the corresponding GCD curves measured at a current density of 1 A/g. The charging platform around 1.76 V and discharging platform near 1.04 V as seen in Fig. 4d for NS-NTC-600 at low current densities can also be observed and are even more evident for NS-NTC-550, as compared to the data for NS-NTC-600 shown in Fig. 5b. However, for NS-NTC-650, the corresponding charging and discharging platforms almost vanish. This phenomenon can be attributed to the reduced S content in NS-NTC with annealing temperature, as verified by the data presented in Fig. 5d.

|
Download:
|
| Fig. 5. GCD profiles of (a) NS-NTC-550, (b) NS-NTC-600 and (c) NS-NTC-650 at a current density of 1 A/g. (d) The N and S contents at different annealing temperatures obtained from XPS measurement. (e) Rate performance and (f) cycling test of the NS-NTC samples at 1 A/g. | |
Figs. 5e and f show the rate performance and cycling stability test of the NS-NTC samples. One notes that compared to NS-NTC-550 and NS-NTC-650, NS-NTC-600 exhibits superior performance of a high reversible capacity of ~304.8 mAh/g at 0.2 A/g and an excellent rate performance of ~124.8 mAh/g at 10 A/g. The optimal Na+ storage of NS-NTC-600 can be understood from the structural change with the annealing temperature. From the aforementioned discussion, one notes that the SSA of NS-NTC enhances but the N and S contents reduce with the annealing temperature. It is well known that the enhanced SSA provides more active sites for Na+ storage and more contact area for the electrolyte with the active material, and however, the reduced N and S contents degrade electrical conductance and wettability of the electrolyte on the active material surface [26]. Accordingly, there exists an optimal annealing temperature, i.e., 600 ℃ in this study for NS-NTC to deliver the optimized performance.
On the basis of the investigation of Na+ half cells, assembling of SIHCs and performance study were conducted. For our SIHCs, energy storage is fulfilled by a reversible redox process of Na in the NS-NTC anodes and adsorption/desorption of ClO4-, i.e., the electrical double-layer capacitor (EDLC) behavior in the APDC cathodes (for more detailed information, one can see the electrochemical properties of the APDC cathodes shown in Fig. S4 in Supporting information). Before assembling the SIHCs, galvanostatic testing of ten cycles at 0.2 A/g between 0.01–2.5 V (vs. Na/Na+) and the following discharging to a cut-off voltage of 0.01 V (vs. Na/Na+) were carried out in Na+ half cells tointroduceNa in the active materials. Considering the issue of capacity balancing between the anodes and cathodes, four batches of SIHCs with different mass ratios of NS-NTC to APDC of 2:1, 1:1, 1:2 and 1:3 were assembled for optimization of device performance.
Figs. 6a–c show CV, GCD and cycling testing of the optimal SIHC with the 1:1 mass ratio of NS-NTC toAPDC (Comparison of the GCD data for the SIHCs with different active mass ratios can be found in Fig. S5 in Supporting information). As can be seen in Fig. 6a, the CV curves at different scan rates are more close to a rectangular shape, thus indicating that the majority of the capacity is contributed by the EDLC behavior [54]. Moreover, the quasi-symmetric GCD curves (Fig. 6b) indicate the excellent charging/discharging characteristics and a neglectable voltage drop in the related SIHC. From the cycling testing of the optimal SIHC as shown in Fig. 6c, one can observe that the capacity retentions of ~79% after 1000 cycles and ~72% after 1500 cycles with high coulombic efficiencies can be achieved at a current density of 2 A/g, indicating a good charging/discharging reversibility.

|
Download:
|
| Fig. 6. (a) CV at different scan rates, (b) GCD at different current densities and (c) cycling performance of the NS-NTC-600//APDC SIHC with the active mass ratio of NS-NTC-600 to APDC of 1:1. (d) Ragone plots of the NS-NTC-600//APDC SIHCs with different active mass ratios (The inset shows a (3V) lightened 'SIHC' pattern assembled by 42 parallel-connected LEDs by the optimal SIHC with the active mass ratio of NS-NTC-600 to APDC of 1:1.). (e) Ragone plots the related performance comparison of different SIHCs. | |
Fig. 6d exhibits the Ragone plots of the SIHCs with different active mass ratios, where the power and energy densities are calculated based on the total mass of the anode and cathode active materials, i.e., NS-NTC and APDC. The optimal device with the active mass ratio of 1:1 can deliver the energy densities of ~100.2 Wh/kg at 250 W/kg and ~50.69 Wh/kg even at 12, 500 W/kg. The inset of Fig. 6d shows the photograph of a (3 V) lightened 'SIHC' pattern assembled by 42 parallel-connected light-emitting diodes, implying the potential in practical applications of the SIHCs. In the meantime, comparison of the energy and power densities of the optimal SIHC in this study with the reported values for the SIHCs, including AC//Ti(O, N) [21], MWTOG//AC [55], NOFC//PSNC [56], NTO//PSC [57], NaTi2PO4/rGO//AC [58], Na2Ti2O4(OH)2//RHDPC-KOH [59], N-TiO2//AC [60], MG//PVDFHFP//DC [61] and TiO2@CNT@C//BAC [62] is exhibited in Fig. 6e, further indicating the competitive performance of the SIHCs based on the NS-NTC anodes.
In this paper, nitrogen and sulfur co-doped nanotube-like carbon (NS-NTC) by a simple carbonization process of the presynthesized high S-loaded polyaniline nanotubes is introduced as the anode of the sodium ion (Na+) hybrid capacitors. The experimental results indicate that a high reversible capacity of ~304.8 mAh/g at 0.2 A/g and an excellent rate performance of ~124.8 mAh/g at 10 A/g in a voltage window of 0.01–2.5 V (vs. Na/Na+) can be delivered by the optimal NS-NTC in the half-cell configuration. Moreover, the high energy densities of ~100.2 Wh/kg at 250 W/kg and ~50.69 Wh/kg at 12, 500 W/kg are achieved for the full hybrid capacitor assembled using the optimal NS-NTC as the anode, the activated polyaniline-derived carbon as the cathode (1:1, active mass ratio) and 1 mol/L NaClO4 in a mixture of ethylene carbonate and dimethyl carbonate (50:50, volume ratio) as the electrolyte. Comparison of the energy and power densities of the optimal SIHC fabricated in this study with the reported values indicates the competitive performance of the SIHCs using NS-NTC as the anode.
Declaration of competing interestThe authors declare that they have no known competing financial interests or personal relationships that could have appeared to influence the work reported in this paper.
AcknowledgmentsThis work is financially supported from the National Natural Science Foundation of China (Nos. 61376068, 11304132 and 11304133) and the Fundamental Research Funds for the Central Universities (Nos. lzujbky-2017-178 and lzujbky-2017-181).
Appendix A. Supplementary dataSupplementary material related to this article can be found, in the online version, at doi:https://doi.org/10.1016/j.cclet.2019.11.017.
| [1] |
X. Sun, G.P. Hao, X. Lu, et al., J. Mater. Chem. A 4 (2016) 10166-10173. DOI:10.1039/C6TA03098J |
| [2] |
L. Wu, J. Lang, S. Wang, P. Zhang, X. Yan, Electrochim. Acta 203 (2016) 128-135. DOI:10.1016/j.electacta.2016.04.036 |
| [3] |
Z. Sun, X. Wang, T. Cai, Z. Meng, W.Q. Han, RSC Adv. 6 (2016) 40799-40805. DOI:10.1039/C6RA04885D |
| [4] |
Z. Xia, C. Arbizzani, L. Ortolani, et al., Flatchem. 3 (2017) 8-15. DOI:10.1016/j.flatc.2017.04.003 |
| [5] |
A.L. Monacaa, F.D. Giorgioa, M.L. Focaretea, et al., J. Electrochem. Soc. 164 (2017) 6431-6439. DOI:10.1149/2.0651701jes |
| [6] |
Y. Xiang, G. Zheng, G. Zhong, et al., Solid State Ion. 318 (2018) 19-26. DOI:10.1016/j.ssi.2017.11.025 |
| [7] |
Y. Von Lim, S. Huang, Y. Zhang, et al., Energy Storage Mater. 15 (2018) 98-107. DOI:10.1016/j.ensm.2018.03.009 |
| [8] |
J.Y. Hwang, S.T. Myung, Y.K. Sun, Chem. Soc. Rev. 46 (2017) 3529-3614. DOI:10.1039/C6CS00776G |
| [9] |
M. Wang, Z. Yang, W. Li, L. Gu, Y. Yu, Small 12 (2016) 2559-2566. DOI:10.1002/smll.201600101 |
| [10] |
W. Li, C. Han, W. Wang, et al., Adv. Energy Mater. 7 (2017) 1700274. DOI:10.1002/aenm.201700274 |
| [11] |
H. Kang, Y. Liu, K. Cao, et al., J. Mater. Chem. A 3 (2015) 17899-17913. DOI:10.1039/C5TA03181H |
| [12] |
L. Liu, B. Shen, D. Jiang, et al., Adv. Energy Mater. 6 (2016) 1600763. DOI:10.1002/aenm.201600763 |
| [13] |
Y. Sun, X. Yan, Solar RRL 1 (2017) 1700002. DOI:10.1002/solr.201700002 |
| [14] |
Z.Y. Lin, X.B. Yan, J.W. Lang, R.T. Wang, L.B. Kong, J. Power Sources 279 (2015) 358-364. DOI:10.1016/j.jpowsour.2015.01.034 |
| [15] |
J. Sun, Y. Huang, C. Fu, et al., Nano Energy 27 (2016) 230-237. DOI:10.1016/j.nanoen.2016.07.008 |
| [16] |
M.S. Zhu, Y. Huang, Y. Huang, et al., Adv. Mater. 29 (2017) 1605137. DOI:10.1002/adma.201605137 |
| [17] |
T. Yao, X. Guo, S. Qin, et al., Nano-Micro Lett. 9 (2017) 38. DOI:10.1007/s40820-017-0141-9 |
| [18] |
T. Yao, Y. Li, D. Liu, et al., J. Power Sources 379 (2018) 167-173. DOI:10.1016/j.jpowsour.2018.01.039 |
| [19] |
Q. Dou, L. Liu, B. Yang, J. Lang, X. Yan, Nat. Commun. 8 (2017) 2188. DOI:10.1038/s41467-017-02152-5 |
| [20] |
R. Wang, J. Lang, P. Zhang, Z. Lin, X. Yan, Adv. Funct. Mater. 25 (2015) 2270-2278. DOI:10.1002/adfm.201404472 |
| [21] |
J. Dong, Y. Jiang, Q. Li, et al., J. Mater. Chem. A 5 (2017) 10827-10835. DOI:10.1039/C7TA00463J |
| [22] |
S. Dong, X. Chen, L. Gu, et al., ACS Appl. Mater. Interfaces 3 (2011) 93-98. DOI:10.1021/am100951h |
| [23] |
H. Wang, D. Mitlin, J. Ding, Z. Li, K. Cui, J. Mater. Chem. A 4 (2016) 5149-5158. DOI:10.1039/C6TA01392A |
| [24] |
J. Ding, H. Wang, Z. Li, et al., Energy Environ. Sci. 8 (2015) 941-955. DOI:10.1039/C4EE02986K |
| [25] |
D. Xu, C. Chen, J. Xie, et al., Adv. Energy Mater. 6 (2016) 1501929. DOI:10.1002/aenm.201501929 |
| [26] |
L. Xiao, Y. Cao, W.A. Henderson, et al., Nano Energy 19 (2016) 279-288. DOI:10.1016/j.nanoen.2015.10.034 |
| [27] |
Y. Cao, L. Xiao, M.L. Sushko, et al., Nano Lett. 12 (2012) 3783-3787. DOI:10.1021/nl3016957 |
| [28] |
R. Wang, J. Lang, X. Yan, Sci. China Chem. 57 (2014) 1570-1578. DOI:10.1007/s11426-014-5123-x |
| [29] |
H. Li, J. Lang, S. Lei, et al., Adv. Functional Mater. 28 (2018) 1800757. DOI:10.1002/adfm.201800757 |
| [30] |
J. Zhu, Y. Li, B. Yang, et al., Small 14 (2018) 1801836. DOI:10.1002/smll.201801836 |
| [31] |
Y. Qu, Z. Zhang, K. Du, et al., Carbon 105 (2016) 103-112. DOI:10.1016/j.carbon.2016.04.029 |
| [32] |
Z. Wang, L. Qie, L. Yuan, et al., Carbon 55 (2013) 328-334. DOI:10.1016/j.carbon.2012.12.072 |
| [33] |
J. Jin, X. Qiao, F. Cheng, H. Fan, Carbon 122 (2017) 114-121. DOI:10.1016/j.carbon.2017.06.044 |
| [34] |
H. Hou, L. Shao, Y. Zhang, et al., Adv. Sci. 4 (2017) 1600243. DOI:10.1002/advs.201600243 |
| [35] |
L. Qie, W. Chen, X. Xiong, et al., Adv. Sci. 2 (2015) 1500195. |
| [36] |
Y. Liu, Y. Qiao, G. Wei, et al., Energy Storage Mater. 11 (2018) 274-281. DOI:10.1016/j.ensm.2017.09.003 |
| [37] |
J. Yang, X. Zhou, D. Wu, X. Zhao, Z. Zhou, Adv. Mater. 29 (2017) 1604108. DOI:10.1002/adma.201604108 |
| [38] |
Y. Li, Z. Wang, L. Li, et al., Carbon 99 (2016) 556-563. DOI:10.1016/j.carbon.2015.12.066 |
| [39] |
J. Yin, X. Xia, L. Xiang, X. Zhao, Carbon 48 (2010) 2958-2967. DOI:10.1016/j.carbon.2010.04.035 |
| [40] |
Y. He, X. Han, Y. Du, et al., Nano Res. 11 (2018) 2573-2585. DOI:10.1007/s12274-017-1882-y |
| [41] |
Z.W. Seh, W. Li, J.J. Cha, et al., Nat. Commun. 4 (2013) 1331. DOI:10.1038/ncomms2327 |
| [42] |
L. Xiao, Y. Cao, J. Xiao, et al., Adv. Mater. 24 (2012) 1176-1181. DOI:10.1002/adma.201103392 |
| [43] |
Y. Ding, B. Yang, J. Chen, et al., Sci. China Mater. 61 (2018) 285-295. |
| [44] |
S. Qin, T. Yao, X. Guo, et al., Appl. Surf. Sci. 440 (2018) 741-747. DOI:10.1016/j.apsusc.2018.01.266 |
| [45] |
W. Li, M. Zhou, H. Li, et al., Energy Environ. Sci. 8 (2015) 2916-2921. DOI:10.1039/C5EE01985K |
| [46] |
L. Zou, Y. Lai, H. Hu, et al., Chemistry 23 (2017) 14261-14266. DOI:10.1002/chem.201702182 |
| [47] |
D. Yan, X. Xu, T. Lu, et al., J. Power Sources 316 (2016) 132-138. DOI:10.1016/j.jpowsour.2016.03.050 |
| [48] |
C. Yang, J. Xiong, X. Ou, C. Wu, X. Xiong, Mater. Today Energy 8 (2018) 37-44. DOI:10.1016/j.mtener.2018.02.001 |
| [49] |
Q.L. Zhu, P. Pachfule, P. Strubel, et al., Energy Storage Mater. 13 (2018) 72-79. DOI:10.1016/j.ensm.2017.12.027 |
| [50] |
Y. Li, G. Wang, T. Wei, Z. Fan, P. Yan, Nano Energy 19 (2016) 165-175. DOI:10.1016/j.nanoen.2015.10.038 |
| [51] |
K. Tang, L. Fu, R.J. White, et al., Adv. Energy Mater. 2 (2012) 873-877. DOI:10.1002/aenm.201100691 |
| [52] |
A. Chojnacka, X. Pan, P. Jezowski, F. Beguin, Energy Storage Mater. 22 (2019) 200-206. DOI:10.1016/j.ensm.2019.07.016 |
| [53] |
S. Chen, J. Wang, L. Fan, et al., Adv. Energy Mater. 8 (2018) 1800140. DOI:10.1002/aenm.201800140 |
| [54] |
P. Wang, R. Wang, J. Lang, et al., J. Mater. Chem. A 25 (2016) 9760-9766. |
| [55] |
Z. Le, F. Liu, P. Nie, et al., ACS Nano 11 (2017) 2952-2960. DOI:10.1021/acsnano.6b08332 |
| [56] |
J. Ding, Z. Li, K. Cui, et al., Nano Energy 23 (2016) 129-137. DOI:10.1016/j.nanoen.2016.03.014 |
| [57] |
H. Li, L. Peng, Y. Zhu, X. Zhang, G. Yu, Nano Lett. 16 (2016) 5938-5943. DOI:10.1021/acs.nanolett.6b02932 |
| [58] |
H.K. Roh, M.S. Kim, K.Y. Chung, et al., J. Mater. Chem. A 5 (2017) 17506-17516. DOI:10.1039/C7TA05252A |
| [59] |
B. Babu, M.M. Shaijumon, J. Power Sources 353 (2017) 85-94. DOI:10.1016/j.jpowsour.2017.03.143 |
| [60] |
S. Liu, Z. Cai, J. Zhou, et al., J. Mater. Chem. A 4 (2016) 18278. DOI:10.1039/C6TA08472A |
| [61] |
F. Wang, X. Wang, Z. Chang, et al., Adv. Mater. 27 (2015) 6962. DOI:10.1002/adma.201503097 |
| [62] |
Y.E. Zhu, L. Yang, J. Sheng, et al., Adv. Energy Mater. 7 (2017) 1701222. DOI:10.1002/aenm.201701222 |