 2020, Vol. 31


b Department of Materials Science and Engineering, City University of Hong Kong, Hong Kong SAR, China;
c Center for Advanced material Diagnostic Technology, Shenzhen Technology University, Shenzhen 518118, China
Luminescent metal-organic frameworks (LMOFs) are a unique class of crystalline solids with highly attractive fluorescent, phosphorescent and scintillation properties, showing promise for a wide variety of applications [1, 2]. LMOF chemical sensors respresent one promising fluorescent probe due to large surface area, structure designability and high stability [3-6], and were well-investegated for the detection of explosive molecules [7-9], volatile organic compounds (VOCs), metal ions and other guest substances [10-13]. Metal ions, such as Cu2+ and Fe3+, are of great importance both in the body of the organism [14] and in versatile production applications. However, excessive Cu2+ and Fe3+ ions will cause a threat to our body [15], including vomiting, diarrhea, intestinal damage, liver and kidney damage [16]. Therefore, it is particularly important to monitor the Cu2+ and Fe3+ concentrations in the aqueous solution. To handle these challenges, chemical sensors [17, 18] have been developed to be one of the effective strategies over past decades. A typical fluorescent probe consists of a recognition group (acceptor), a fluorophore, and a linker that connects the two [19]. The combination of the receptor and the substrate leads to a change in the photophysical properties of the receptor molecule, which is manifested by the sudden quenching or enhancement of the fluorophore moiety [20]. The potential metal ion fluorescent probe involves rational design, feasible synthesis and selective photo-responsive behavior towards target metal ions, such as Fe3+ and Cu2+ ions [21, 22]. Therefore, the prospect to develop materials with above properties cannot be overestimated.
Two-dimensional metal-organic nanosheets (MONs) [23-27] have recently emerged as a new class of materials. Compared with traditional two-dimensional materials such as graphene, boron nitride, black phosphorus, metal-oxides and others [28-30], MONs offers chemical diversity, structural tunability and other remarkable properties, allowing them to be tuned for a wide variety of applications. Until now, the main synthetic routes of MONs can be classified into "top-down" and "bottom-up" methodologies. The dynamic interaction within layers of the MOF structures opens up opportunities for "bottom-up" solution processing of MONs under mild condition [25, 24-27]. While, examples of luminescent MONs combining both luminescent properties and 2D structure are limited, and less attention has been focused on the exploration of luminescent MONs.
In the present study, the luminescent layered MOF C6H4N5OZn (1) was achieved by the hydrothermal reaction of ZnCl2, 4-cyanopyridine, sodium azide. The in situ embedded pyridine tetrazolium unit in 1 is a good fluorophore in the design of fluorescent molecular probes with high quantum yield, moderate fluorescence emission wavelength, and excellent light stability. Under excitation wavelengths of 254 and 365 nm, the luminescent MOF 1 exhibit blue emission, and applied for the effective fluorescent detection of Fe3+ and Cu2+ with remarkable selectivity and sensitivity. Ligand intercalation experiments were also conducted to demonstrate the feasible chemical exfoliation of 1, forming luminescent MONs. What is more, when exposed in air for 12 months, the structure of 1 remained intact (based on PXRD), indicating the oustanding stability of this luminescent materials.
The structure of 1 was determined and analyzed by single crystal and powder X-ray diffraction (SXRD and PXRD) methods. Photoluminescence (PL) spectroscopy, thermogravimetric analysis (TGA) measurements were performed to characterize their optical and thermal properties. Fluorescence titration experiment showed that the compound 1 was selectively sensitive to analytes in the aqueous suspension by fluorescence quenching [31-34]. PXRD, SEM and TEM were applied to characterize the structure of 1 after chemical exfoliation through the ligand intercalation-promoted layer separation.
All chemical reagents and solvents are obtained from regular commercial sources and do not require further purification. The luminescence spectra of the as-made solid compounds were recorded with a fluorescence spectrophotometer at room temperature. Ultraviolet-visible spectra were collected at room temperature using a Shimadzu UV-2550 spectrophotometer. Thermogravimetric analyses (TGA)were collected using a TGA 209 F3 analyzer. The crystal sample was loaded on a platinum plate and heated at a ramp rate of 15 ℃/min from 30 to 800 ℃ under a nitrogen flow (50 mL/min). Powder samples were evenly spread on glass slides with no emission wavelength in the visible range. The internal quantum yields (IQYs) were measured on a Hamamatsu C9920-03 absolute quantum yield measurement system with a 150 W xenon monochromatic lamp and 3.3 in an integrating sphere. Powder X-ray diffraction (PXRD) datawere recorded on a Bruker D8 Advance X-ray diffractometer with Mo-Kα radiation (λ = 0.71073 Å). The data were recorded at room temperature in a 2θ range of 5°-50° with a scan speed of 6° surface morphologies of the asprepared samples were characterized using field scanning electron microscopy (FESEM) (Carl Zeiss, Germany). Transmission Electron Microscope (TEM) (JEM-2001 F, Japan)wasused to characterize theMONs. Atomic ForceMicroscope (AFM) (Ntegra Spectra, Russia) was used to characterize the Layer thickness and surface roughness of the MONs.
Synthetic procedures of 1: A mixture of ZnCl2 (2 mmol, 0.2726 g), 4-cyanopyridine (2 mmol, 0.2082 g), sodium azide (3 mmol, 0.195 g), and deionized water (3.0 mL) were added in a 5 mL glass liner, then perform ultrasound and disperse evenly. The glass liner was then placed in a 20 mL polytetrafluoroethylene liner. Finally, the Teflon liner was transferred to a stainless steel autoclave and placed in an oven at 160 ℃ for 3 days. White crystals were obtained with a yield of 75% after the oven was allowed to cool down.
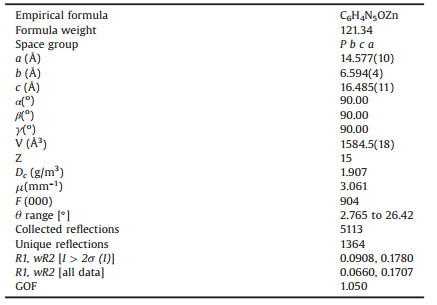
Single crystal diffraction intensity data of 1 were collected on a Agilent Technologies SuperNova Single Crystal Diffractometer at 293(2) K equipped with graphite-monochromatic Mo Kα radiation (λ = 0.71073 Å). Data processing including empirical absorption correction was performed using SADABS. The structures of 1 were solved by direct methods and refined by the full-matrix method by means of the SHELXLTL software package (full matrix least-squares techniques) in the Olex2 package [35]. The selected crystal parameters, data collection, and refinements are summarized in Table 1.
|
|
Table 1 Crystallographic data for 1. |
The fluorescent detection capability of compound 1 was detected by the fluorescence titration [36] experiment at r.t. in a fluorescence spectrometer with an excitation wavelength (λex) of 338 nm and an emission wavelength (λem) of 380 nm. The standard experimental steps were as following: the as-made sample 1 (0.01 mmol) was firstly grinded into fine powder, and uniformly dispersed in the deionized water (20 mL) solution by ultrasonic stirring for about 40 min to prepare a stock solution (0.5 mmol/L). The analyte aliquots were added to a quartz cuvette containing above stock solution. The analytical solution was transferred to a 4 mL centrifuge tube and covered with a lid. The tube was shaken up and down. The solution was immediately poured into a quartz dish and the change in luminescence was recorded under 338 nm excitation.
In a typical exfoliation experiment, 80 mg of 1 and 80 mg of OBA were grounded and dispersed in 10 mL of DMF and sonicated at r.t. using a Dekang DK-100D Ultrasonic Cleaner (10 L, 50 Hz, 240 W) for 120 min. The samples were then allowed to stay at r.t. for 120 min. The top 3/4 of the supernatant was decanted into a clean vial and used for the TEM and AFM studies of the nanosheets.
The phase purity of compound 1 was assessed by PXRD test. The experimental results are consistent with the simulated PXRD peak positions, indicating that the compound is a pure crystalline phase (Fig. S1 in Supporting information). The intensity differences may be due to the preferred orientation of the powder sample. The thermal stability of compound 1 was measured by TGA experiment (Fig. S2 in Supporting information). Different from the known zincbased MOFs (such as MOF-5), which tend to dissociate when exposed to humid atmosphere and water [37], 1 is highly stable in air for more than 12 months and various solvents (such as water, DMF, ethanol, acetonitrile), as confirmed by the PXRD experiment (Fig. S1).
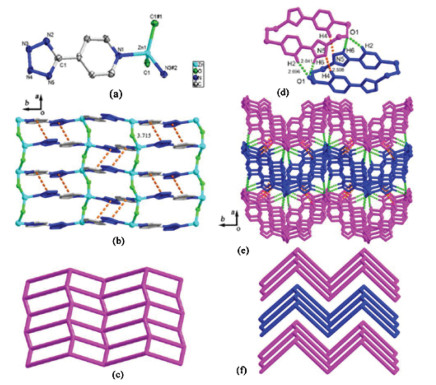
Single crystal X-ray diffraction studies show that 1 crystallizes in the orthorhombic space group Pbca with in situ embedded tetrazolium ring. Each Zn atom is bonded to two N (Npyridine and Ntetrazolium) atoms and two O atoms in the asymmetric unit (Fig. 1a). The bond distances of Zn-N range from 2.018 Å to 2.079 Å and Zn-O bond distance range from 1.937 Å to 1.940 Å (Table S1 in Supporting information). In the structure, Zn and O atoms are interconnected to build a one-dimensional zigzag Zn-O chain, which is further coordinated by the ligand to give rise to a 4-c two-dimensional net with a topolopy symbol of {4^4.6^2} (sql type) (Figs. 1b and c). There exist face-to-face π…π interactions between the pyridine and the tetrazolium ring inside the layers, and the centroid-to-centroid distance is 3.715 Å (Fig. 1b). Three kinds of hydrogen bonds serve for linking two adjacent layers (H6…O1, 2.041 Å; H2…O1, 2.696 Å; H4…N5, 2.598 Å, Fig. 1d and Table S2 in Supporting information), and giving a three-dimensional supramolecular network (Figs. 1e and f).

|
Download:
|
| Fig. 1. (a) The asymmetric unit of 1, one Zn atom is bonded to two N atoms and two O atoms. (b) Pyridine and tetrazolium offset face-to-face stacking in 1. (c) Two-dimensional topography of compound 1 from the b-axis. The framework was simplified as a 4-c net with sql symbol {4^4.6^2}. (d) H-bonding stacking in compound 1. (e) A three-dimensional supramolecular network structure is formed between the layers of 1 by hydrogen bonding. (f) A three-dimensional topography. | |
Compound 1 featured blue light emission under an excitation wavelength of 338 nm (Fig. S3 in Supporting information). The Commission International de I'Eclairage (CIE) coordinates of 1 is (0.157, 0.026) (Table S3 in Supporting information). The detection capability of 1 towards metal ions in the aqueous solution was studied here. Firstly, metal ion aqueous solution was ultrasonically dispersed and diluted to 10 mmol/L, and the luminescent changes were recorded at room temperature under the excitation wavelength of 338 nm (Fig. 2, Figs. S4 and S6 in Supporting information). After an equal amount of certain metal ion was added into the aqueous solution (in eleven parts, labeled in order are Ni+, Co2+, Cd3+, Pb2+, Eu3+, Gd3+, Na+, Mg2+, Cr3+, Fe3+, Cu2+) of 1, it was found that the fluorescent intensity of tested fluorescent probe molecule solution with Fe3+ and Cu2+ was dramatically decreased (Fig. 2), and the color of solution containing Fe3+ was quickly turned to yellow after slight ultrasonic dispersion, while that of Cu2+ turn blue. This unique phenomenon confirmed the high sensing selectivity of 1 towards the detection of Fe3+ and Cu2+, which can be readily discerned through naked eyes under daylight (Fig S8 in Supporting information). To further examine the sensing ability of 1, fluorescence titration experiment was performed by monitoring the fluorescent intensity change with the gradual addition of analytes. As shown in Figs. S5 and S7 (Supporting information), the luminescent intensity of 1 decreases gradually accompanied by the growing amount of analytes. The quenching efficiency was quantified using the Stern-Volmer (SV) equation [38-41]:

|

|
Download:
|
| Fig. 2. Fluorescence responses of 1 towards various cations in aqueous solution. | |
I0 and I are the luminescent intensities of suspensions before and after the addition of analytes respectively; [Q] is the molar concentration of analytes; KSV is the quenching constant which was used to quantitatively evaluate the sensing efficiency of the compound.
As shown in Fig. S4, with the addition of Fe3+, the luminescent intensities of the solution decreased accordingly. Fluorescence spectral changes were recorded from 350 nm to 500 nm. Sensing efficiency of 1 towards Fe3+ was evaluated yielding a quenching contant KSV of 9.89 × 10³ mol-1 deduced from Stern-Volmer (SV) equation (Fig. S5). When it comes to the sensing ability of 1 towards copper ion-containing solution, the same quenching effect was observed with the growing amount of Cu2+ in solution (Fig. S6). KSV was calculated to be 4.47 × 10³ mol-1 for Cu2+ (Fig. S7). As described above, both KSV values indicate the fluorescent sensing efficiency of 1 is comparable with most of known polymers and LMOF [42-48]. It is interesting that the sensing efficiency of 1 for Fe3+ is higher than that of Cu2+ in the term of KSV value and the sensing ability towards both metal ions can be directly perceived from the color transition of the aqueous solution. Inductively coupled plasma measurement of the quenching solution indicates the release of zinc ions, owing to the dissociation of MOF (Table S4 in Supporting information). The dramatic fluorescence quenching effect could be identified from the ion exchange between the host Zn-O chains and guest Fe3+ and Cu2+, leading to the MOF dissociation in the final solution.
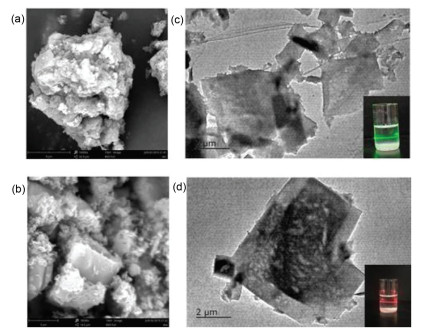
Weakly interaction (π…π interaction and hydrogen bond) in the layered MOF 1 affords the opportunities for the ligand intercalation and chemical exfoliation [25-27]. Here, 4, 4'-oxybis benzoic acid (OBA) and triphenylamine (TPA) were applied as two candidates which may interact with the subunits of the fameworks and aim to aid the exfoliation of the layers. The crystalline sample of 1 were grounded with OBA, then sonicated in DMF with a concentration of 5 mg/mL for 120 min and the resulting suspension was allowed to stay for 120 min. The white solid (1-DMF, 1-TPA and 1-OBA) remained at the bottom of the glass vial was centrifuged and air dried for SEM, PXRD and UV-vis absorption measurements (Fig. 3, Figs. S9 and S10 in Supporting information). When irradiated with a laser, the clear supernatant apparently showed evidence of Tyndal scattering (Fig. 3c), indicating the formation of a MOF nanosheet suspension. The same Tyndal phenomenon was observed in the TPA treated sample (Fig. 3d). TEM images of the exfoliated nanosheets obtained from the two supernatant of 1-TPA and 1-OBA were shown in Figs. 3c and d, respectively. AFM height measurement (Fig. S9) confirmed that 1 nanosheets had a thickness of 35 ± 5 nm and a lateral length of 37 ± 1.2 nm. The thinnest nanosheet was composed of 40 layers.

|
Download:
|
| Fig. 3. (a) SEM of a sample of 1-TPA, after TPA intercalation; (b) SEM of a sample of 1-OBA, after OBA intercalation; (c) TEM and Tyndal scattering effect of 1-TPA; (d) TEM and Tyndal scattering effect of 1-OBA. | |
Compared with large block crystals of original 1 (Fig. S12 in Supporting information), SEM images of 1-OBA and 1-TPA (Fig. S11 in Supporting information, patterns b and c) showed clearly the layered structure, owning to guest-assisted layer exfoliation. Furthermore, PXRD analysis of the frameworks demonstrate the structural transition under the host-guest interactions with respect to that of as-made 1. PXRD patterns (Fig. S11, patterns e, f and g) of 1-OBA and 1-TPA indicate the formation of a new phase which could be indexed and refined in the tetragonal space group P4 (Supporting information). This could be attributed to the slipping of the layers and the structural rearrangement. Analysis of PXRD pattern (Fig. S11, pattern d) of 1-DMF (exfoliated in guestfree DMF) clearly showed a mixture of two phases, indicating a gradual transition from the orthorhombic 1 to the tetragonal 1-OBA/1-TPA structure.
In conclusion, a highly stable and luminescent Zn(Ⅱ)-MOF was demonstrated to exhibit selective detection towards Fe3+ and Cu2+ through both the color changes and the fluorescent quenching effect in the aqueous solution. By simultaneously performing fluorescence titration on Fe3+ and Cu2+, it is found that the KSV value of ferric ions is twice that of divalent copper ions, which further indicates the MOF potential for the development of fluorescent probe strategies. Efficient guest-assisted chemical exfoliation is successfully carried out by "bottom up" solution process methodology, showing the facile preparation of luminescent MONs. From the view point of structural and functional designability, the present research work provides the helpful evidence for the achievement of luminescent MOFs and MONs with high stability, chemical sensing capability and thin layers.
AcknowledgmentsThis work was financially supported by the National Natural Science Foundation of China (No. 21671084); NSF of Jiangsu Province (No. BK20131244); Six talent peaks project in Jiangsu Province (No. 2014-XCL-008); the Qing Lan Project of Jiangsu Province; the Innovation Program of Graduate Students in Jiangsu Province (No. KYLX16-0508); a Project Funded by the Priority Academic Program Development of Jiangsu Higher Education Institution; Innovation Program for Graduate Student from Jiangsu University of Science and Technology (No. YCX15S-19) and the Foundation of Jiangsu Educational Committee (No. 16KJB430011).
Appendix A. Supplementary dataSupplementary material related to this article can befound, in the online version, at doi:https://doi.org/10.1016/j.cclet.2019.09.024.
| [1] |
Y. Cui, Y. Yue, G. Qian, B. Chen, Chem. Rev. 112 (2012) 1126-1162. DOI:10.1021/cr200101d |
| [2] |
Y. Zhang, S. Yuan, G. Day, et al., Coord. Chem. Rev. 354 (2018) 28-45. DOI:10.1016/j.ccr.2017.06.007 |
| [3] |
T. Islamoglu, S. Goswami, Z. Li, et al., Acc. Chem. Res. 50 (2017) 805-813. DOI:10.1021/acs.accounts.6b00577 |
| [4] |
Q. Zhang, C. Zhang, L. Cao, et al., J. Am. Chem. Soc. 138 (2016) 5308-5315. DOI:10.1021/jacs.6b01345 |
| [5] |
S.Z. Zhan, M. Li, S.W. Ng, D. Li, Chem. Eur. J. 19 (2013) 10217-10225. DOI:10.1002/chem.201204632 |
| [6] |
G. Liu, D.Q. Feng, X. Mu, et al., J. Mater. Chem. B 1 (2013) 2128-2131. DOI:10.1039/c3tb20208a |
| [7] |
A. Wang, Y.L. Hou, F. Kang, et al., J. Mater. Chem. 7 (2012) 2207-2211. |
| [8] |
S. Pramanik, C. Zheng, X. Zhang, T.J. Emge, J. Li, J. Am. Chem. Soc. 133 (2012) 4153-4155. |
| [9] |
Z. Hu, K. Tan, W.P. Lustig, et al., Chem. Sci. 5 (2014) 4873-4877. DOI:10.1039/C4SC02157F |
| [10] |
S.M. Zhang, Z. Chang, T.L. Hu, X.H. Bu, Inorg. Chem. 49 (2010) 11581-11586. DOI:10.1021/ic1017467 |
| [11] |
Z. Chang, D.H. Yang, J. Xu, T.L. Hu, X.H. Bu, Adv. Mater. 27 (2015) 5432-5441. DOI:10.1002/adma.201501523 |
| [12] |
J. Liu, H.B. Zhang, Y.X. Tan, et al., Inorg. Chem. 53 (2014) 1500-1506. DOI:10.1021/ic402467g |
| [13] |
B. Gole, A.K. Bar, P.S. Mukherjee, Chem. Commun. (Camb.) 47 (2011) 12137-12139. DOI:10.1039/c1cc15594f |
| [14] |
S.S. Nagarkar, B. Joarder, A.K. Chaudhari, S. Mukherjee, S.K. Ghosh, Angew. Chem. Int. Ed. 125 (2013) 2953-2957. DOI:10.1002/ange.201208885 |
| [15] |
S.S. Nagarkar, A.V. Desai, S.K. Ghosh, Chem. Commun. (Camb.) 50 (2014) 8915-8918. DOI:10.1039/C4CC03053B |
| [16] |
Y. Xiao, Y. Cui, Q. Zheng, S. Xiang, G. Qian, Chem. Commun. (Camb.) 30 (2010) 5503-5505. |
| [17] |
J. Geng, Y. Liu, J. Li, et al., Sensor. Actuat. B -Chem. 222 (2016) 612-617. DOI:10.1016/j.snb.2015.08.076 |
| [18] |
D.K. Singha, P. Mahata, Inorg. Chem. 13 (2015) 6373-6375. |
| [19] |
M.D. Allendorf, C.A. Bauer, R.K. Bhaktaa, R.J.T. Houk, Chem. Soc. Rev. 38 (2009) 1330-1352. DOI:10.1039/b802352m |
| [20] |
Z. Hu, B.J. Deibert, J. Li, Chem. Soc. Rev. 43 (2014) 5815-5840. DOI:10.1039/C4CS00010B |
| [21] |
H.J. Kalinowski, J.L. Fabris, W.J. Bock, 24th International Conference on Optical Fibre Sensors, 2015.
|
| [22] |
X. Zhao, D. Liu, H. Huang, C. Zhong, Microporous Mesoporous Mater. 224 (2016) 149-154. DOI:10.1016/j.micromeso.2015.11.042 |
| [23] |
Y.J. Ding, Y.P. Chen, X.L. Zhang, et al., J. Am. Chem. Soc. 27 (2017) 9136-9139. |
| [24] |
M. Zhao, Y. Huang, Y.W. Peng, et al., Chem. Soc. Rev. 16 (2018) 6001-6046. |
| [25] |
D.J. Ashworth, J.A. Foster, J. Mater. Chem. A Mater. Energy Sustain. 6 (2018) 16292-16307. DOI:10.1039/C8TA03159B |
| [26] |
W.W. Zhao, J.L. Peng, W.K. Wang, et al., Coord. Chem. Rev. 377 (2018) 44-63. DOI:10.1016/j.ccr.2018.08.023 |
| [27] |
M. Ko, L. Mendecki, K.A. Mirica, Chem. Commun. (Camb.) 54 (2018) 7873-7891. DOI:10.1039/C8CC02871K |
| [28] |
Y.Z. Fu, Q. Han, Q. Chen, et al., Chem. Commun. (Camb.) 48 (2012) 2322-2324. DOI:10.1039/c2cc17301h |
| [29] |
J.G. Li, H.C. Sun, L. Lv, et al., ACS Appl. Mater. Inter. 11 (2019) 8106-8114. DOI:10.1021/acsami.8b22133 |
| [30] |
L. Lv, Z.X. Yang, K. Chen, C.D. Wang, Y.J. Xiong, Adv. Energy Mater. (2019) 1803358. |
| [31] |
L.Z. Chen, F.M. Wang, X.X. Cao, Chin. J. Struct. Chem. 31 (2012) 1417-1422. |
| [32] |
L.Z. Chen, X.X. Cao, F.M. Wang, G.L. Xie, Inorg. Chem. 28 (2012) 1291-1297. |
| [33] |
L.Z. Chen, Q. Ji, Y.Y. Dan, Chin. J. Struct. Chem. 35 (2016) 1728-1735. |
| [34] |
F.M. Wang, Z.Y. Zhou, W. Liu, et al., Dalton Trans. 46 (2017) 956-961. DOI:10.1039/C6DT03883B |
| [35] |
L.Z. Chen, F.M. Wang, S. Hong, J. Coord. Chem. 65 (2012) 439-452. DOI:10.1080/00958972.2012.654786 |
| [36] |
P. Wang, J. Fu, K. Yao, et al., Sensor. Actuat. B -Chem. 273 (2018) 1070-1076. DOI:10.1016/j.snb.2018.07.028 |
| [37] |
A.J. Howarth, Y. Liu, P. Li, et al., Nat. Rev. Mater. 1 (2016) 15018. DOI:10.1038/natrevmats.2015.18 |
| [38] |
C.H. Chen, X.S. Wang, L. Li, Y.B. Huang, R. Cao, Dalton Trans. 47 (2018) 3452-3458. DOI:10.1039/C8DT00088C |
| [39] |
X.X. Jia, R.X. Yao, F.Q. Zhang, X.M. Zhang, Inorg. Chem. 56 (2017) 2690. DOI:10.1021/acs.inorgchem.6b02872 |
| [40] |
C. Xing, Z. Shi, M. Yu, S. Wang, Polymer 49 (2018) 2698-2703. |
| [41] |
Q. Jin, L.Z. Chen, Chin. J. Inorg. Chem. 33 (2017) 8-15. |
| [42] |
R. Kagit, M. Yildirim, O. Ozay, et al., Inorg. Chem. 53 (2014) 2144-2151. DOI:10.1021/ic402783x |
| [43] |
B.L. Sui, S. Tang, T.H. Liu, et al., ACS Appl. Mater. Interfaces 6 (2014) 18408-18412. DOI:10.1021/am506262u |
| [44] |
X.Y. Mu, L. Qi, J. Qiao, H.M. Ma, Anal. Methods 6 (2014) 6445-6451. DOI:10.1039/C4AY01137F |
| [45] |
A. Ananthanarayanan, X.W. Wang, P. Routh, et al., Adv. Funct. Mater. 24 (2014) 3021-3026. DOI:10.1002/adfm.201303441 |
| [46] |
X.Y. Dong, R. Wang, J.Z. Wang, et al., J. Mater. Chem. A:Mater. Energy Sustain. 3 (2015) 641-647. DOI:10.1039/C4TA04421E |
| [47] |
Y.T. Liang, G.P. Yang, B. Liu, et al., Dalton Trans. 44 (2015) 13325-13330. DOI:10.1039/C5DT01421B |
| [48] |
H. Xu, H.C. Hu, C.S. Cao, B. Zhao, Inorg. Chem. 54 (2015) 4585-4587. DOI:10.1021/acs.inorgchem.5b00113 |