 2020, Vol. 31


b Department of Physics & Department of Chemistry, College of Science, Shanghai University, Shanghai 200444, China
Systems for air quality monitoring are of great importance in different fields, such as precision instruments production, textile, food storage, domestic environments. The requirements for practical application of humidity sensors can be summarized as follows: good sensitivity over a wide range of humidity, short response time, good reproducibility, small hysteresis, high stability, negligible temperature dependence and low cost [1-5]. Among numerous humidity sensors, the low humidity ones have wide applications, such as in manufacture, clinic, biotechnology, agriculture and meteorology. As a result, it is critically important to design and synthesize the humidity-sensing substances, so as to investigate at low humidity conditions. Additionally, the clear sensing mechanism contributes to effectively designing low humidity sensors with high performance.
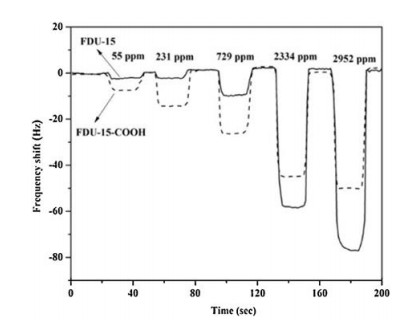
At present, numerous sensing technologies are available to detect humidity worldwide. Additionally, great efforts are devoted to explore the humidity detection techniques, like impedance, quartz crystal microbalance (QCM), optic, field effect transistors (FET), surface acoustic wave (SAW) and capacity. Of the abovementioned technologies, QCM is able to stably determine changes with a low mass [6]. As a result, sensors based on QCM can be the potential solution to detect the low humidity. Sauerbrey [7-9] had first quantitatively obtained the association of frequency change in piezoelectric crystal △f (Hz) with mass change resulted from loading onto the surface of piezoelectric crystal (Eq. 1).
|
(1) |
where f0 (106 Hz) represents the basic frequency of non-loaded piezoelectric crystal, △m (g) stands for the mass change on crystal surface, and A (cm2) suggests the electrode surface area. QCM has attracted more and more attention since its first introduction by King to the analytical chemical field.
Great efforts are made to modify the mesoporous materials from basic to practical points of view, since the preparation of the ordered mesoporous silica [10-13]. So far, a variety of mesoporous materials are prepared and used to be the humidity-sensing substances [14], like the mesoporous materials or zeolites [15-18]. The above porous substances have huge surface area, connected channel and controllable pore size; as a result, they are beneficial for water molecule absorption and remarkably improving the humidity-sensing property. Currently, various sensing substances are synthesized to coat the QCM electrode for detecting humidity as well as the volatile organic compounds (VOCs), including the Nafion-Ag [19], modified fullerene layers [20, 21], nanosized zeolite [22], polypyrene [23], carbon nanotube/Nafion nanocomposites [24, 25], ZnO nanoparticles [26], PAMAM–Au and PAMAM dendrimer nanoparticles, and the mesoporous silica SBA-15 thin film [27]. Nonetheless, low humidity sensitivity is remarkably low compared with that at high humidity, which has restricted the actual application. In recent years, increasing attention is paid to the ordered mesoporous carbon (OMC) in different fields of application, like adsorption [28], catalysis [29, 30], energy storage [31-33] and biomedical engineering [34]. OMCs are characterized by numerous merits, such as great mechanical and chemical stability, high thermal conductivity, low density, favorable electrical conductivity, biocompatibility and low cost. Particularly, mesoporous carbon is utilized to be the efficient humidity-sensing material thanks to its connected channel, controllable pore size and huge surface area. Additionally, the OMCs-based low-humidity QCM sensor is insufficiently investigated yet. As a result, this study was carried out aiming to improve the sensing properties of OMCs at ultra-low humidity and ambient temperature.
An easy approach was demonstrated in the current study to produce the functional OMC FDU-15-COOH based on FDU-15 by oxidation treatment at liquid phase. Typically, the FDU-15-COOH-based QCM sensor exhibited an ultra-low-humidity impedance and favorable humidity-sensing performance (such as long-term stability, hysteresis, sensitivity and response time). Additionally, the underlying mechanism of sensing was also explored.
The typical Chemicals are Tetraethoxysilane (TEOS, 98 wt%), ammonium persulfate [(NH4)2S2O8, APS], Mg(NO3)2·6H2O, MgCl2·6H2O, LiCl·H2O, KCl, NaCl, phenol, CuSO4, NaOH, formaldehyde (HCHO, 37 wt%), hydrochloric acid (HCl, 37 wt%) and anhydrous ethanol were provided by Sinopharm Chemical Reagent Co., Ltd. The triblock copolymer, namely, the poly (ethylene oxide)-block-poly (propylene oxide)-block-poly (ethylene oxide) (Pluronic F127, PEO106PPO70PEO106, Mw = 12, 600) was provided by BASF. Each chemical was used as received and was not further purified. The water used in each experiment was deionized water.
Then, 0.61 g phenol was dissolved within the flask at 40-42 ℃ in the representative process, followed by mixing using the aqueous solution of 20 wt% NaOH (0.13 g) via stirring. Formaldehyde (1.05 g) was dropwise added 10 min later at < 50 ℃, and the resultant mixture was subsequently cooled down until ambient temperature following another 1 h of stirring at 70-75 ℃, afterwards, the mixture pH was adjusted at about 7.0 using the HCl solution. Later, the precursor was subjected to vacuum drying at < 50 ℃, and the end product was then dissolved into ethanol again.
The OMC FDU-15 was prepare according to the solvent evaporation-induced self-assembly (EISA) approach [35], with copolymer F127 being used to be the template whereas the soluble lowmolecular weight (LMW) formaldehyde (resol) and phenol polymer was used to be the precursor.Inthe representative procedure[36], the ethanol solution of above-mentioned precursors that contained formaldehyde (0.39 g, 13.0 mmol) and phenol (0.61 g, 6.50 mmol) wasaddedunder10 minof stirring, so as to prepare the homogeneous solution containing F127/phenol/formaldehyde/ethanol at a molar ratio of 0.012:1:2:67. Afterwards, the prepared solution was put into thedish, and the ethanol was evaporated under ambient temperature for 5–8 h, so as to acquire the transparent membrane. Then, the membrane was heatedfor 24 h within the 100 ℃ oven, for the sake of phenolic resin the copolymerization. Afterwards, the as-prepared products were subjected to 5 h of calcinations under N2 atmosphere at 350 ℃ and the heating rate at 1 ℃/min. And the acidic APS solution is the gentler oxidant that has a lower degree of carbon destruction than those in other potent oxidants [37, 38]. Typically, 30 mL of the newly prepared acidic APS solution (1.0 mol/L) and 0.5 g OMC FDU-15 were put in the round-bottom flask that was air-proofed through the liquid seal setting. Then, the mixture was subjected to 12 h of stirring and refluxing at 60 ℃, and later the solids would be filtered, followed by ethanol and water washing. Eventually, FDU-15-COOH was subjected to vacuum drying overnight at 60 ℃.
Using the setup modified in our previous study, the quartz crystals were AT-cut [34]. In addition, gold electrodes were coated onto the QCM resonators (ANT Technologies Corp., Taiwan) by means of vapor deposition, so that they could be used as electrodes. Based on the Sauerbrey equation, the frequency drift (FD) was decreased in proportion to the increased mass (Dm), with the resonance frequency of 107 Hz (AT-cut).
Typically, 10 mg FDU-15-COOH and FDU-15 were respectively added to the deionized water (10 mL) under 600 s of stirring to obtain the homogeneous solution, which serves as a coating solution. Afterwards, QCM chips were immersed within the solution, followed by drying at 353 K within the bake oven. Following solvent evaporation, the as-prepared QCM sensors were fabricated, which were coated with FDU-15-COOH and FDU-15.
The required water vapor concentration was generated by adjusting the proportions of dry and humid air [33]. The main device for generating the testing gases was a divided flow humidity generator because of the limitation of saturated brine method. A low-humidity hygrometer (HYGROCLIP IC-3, Rotronic Inc.) and a QCM sensor were connected with an outlet of the divided of low humidity generator, and the low-humidity hygrometer was used as the reference standard to adjust the QCM sensor. The volume ratio of the moist air was regulated according to the reading of the lowhumidity hygrometer calibrating to the CMS/NML (Center for Measurement Standards/National Measurement Laboratory, Taiwan) humidity laboratory. The volume ratio of the moist air was calculated by the following equation (Eqs. 2 and 3):

|
(2) |

|
(3) |
where Vv represents the water vapor volume, V stands for total volume, indicates partial water vapor pressure, and P suggests the total pressure. To carry out the measuring process, firstly, the synthesized dry air was penetrated into the detection chamber till the QCM frequency was stable. Afterwards, water vapor at expected content was imported to the detection chamber. Finally, the synthesized dry air was penetrated into the detection chamber till the QCM frequency reached the original level. In each experiment, the original moist air volume ratio was 2.77 ppmv.
The Dmax 2500 V diffractometer was adopted to collect X-ray diffraction (XRD) data, Cu Kα radiation was used as the source of Xray (λ = 1.5418 Å), and the scan speed was set at 0.5°/min. In addition, the JEOL JEM-2010 F electron microscope (accelerating voltage, 120 kV) was employed to record images from transmission electron microscopy (TEM). Prior to TEM observation, all samples were subjected to ethanol sonication initially, followed by dropcast onto the copper grid coated with carbon and air-drying. The AVATAR 370 was adopted to analyze the Fourier transform infrared spectroscopy (FT-IR). The Micromeritics ASAP 2020 system was employed to measure the nitrogen sorption isotherms at approximately 77 K. Then, ≥ 0.1 g sample was subjected to 12 h of degassing at 373 K. Besides, the pore size and surface area were acquired through Barrett–Joyner–Halenda (BJH) and Brunauer– Emmett–Teller (BET) approaches, separately. In addition, the saturated aqueous solutions of various salts, including MgCl2, LiCl, NaCl, Mg (NO3)2, CuSO4 and KCl within the sealed glass vessel under room temperature, yielded 33.1% RH, 11.3% RH, 75.5% RH, 55.8% RH, 96.1% RH and 85.1% RH, respectively.
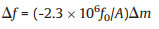
The small-angle XRD patterns of FDU-15 (Fig. 1a) and FDU-15-COOH shows three well-resolved diffraction peaks, which can be indexed to (100), (110) and (200) reflections, further indicating the existence of the ordered mesostructure. Moreover, the intensity of the diffraction peak corresponding to (100) of FDU-15-COOH was lower than FDU-15, because the -COOH functional groups attached to the inside wall of the pores, which decreased the order degree of FDU-15-COOH. In order to further explore the structural features, the obtained FDU-15 and FDU-15-COOH were characterized by TEM, highly ordered hexagonal mesostructure can be observed in Figs. 1b and c.

|
Download:
|
| Fig. 1. (a) Small-angle XRD patterns of FDU-15 and FDU-15-COOH. TEM images of (b) FDU-15 and (c) FDU-15-COOH. | |
There were some typical bands in the FT-IR spectra for FDU-15-COOH and FDU-15 (Fig. 2). Among them, the broad band observed at about 3433 cm-1 was majorly attributed to O—H stretching vibrations in the water adsorbed, as well as to the -COOH groups to some extent. In addition, weak bands were also seen at about 1643, 1490 and 1412 cm-1, which were potentially assigned to the presence of C¼C groups in the aromatic structures on the surface, as well as the low C—H and quinine C¼O groups contents in the carbon materials [38-40]. Following modification, a novel intense band was observed at 1721 cm-1, which was indexed to the carbonyl in the nonaromatic carboxyl group [41, 42]. Additionally, the bands at 1005 and 1228 cm-1 were indexed to the C—O bonds of carboxylic, phenolic, ester, and etheric groups, which had implied excessive oxide production on the surface.

|
Download:
|
| Fig. 2. The FT-IR spectra of FDU-15 and FDU-15-COOH. | |
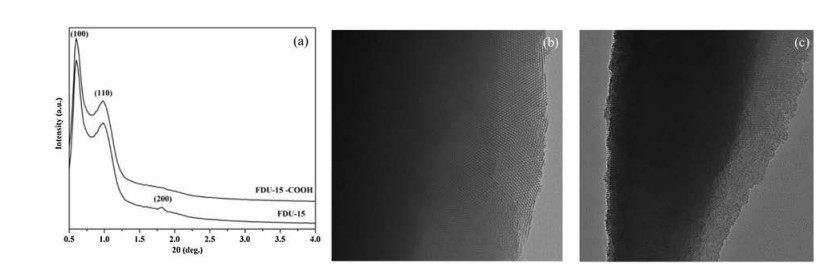
The N2 adsorption-desorption isotherms of FDU-15 and FDU-15-COOH shown in Fig. 3a demonstrate that both of them were type Ⅳ with a clear H2-type hysteresis loop. The BET surface area decreased from 535 m2/g (FDU-15) to 320 m2/g (FDU-15-COOH). Meanwhile, as shown in Fig. 3b, the pore diameter decreases from 3.66 nm to 2.63 nm. The decrease of surface area and pore diameter may be caused by the existence of the -COOH embedding on the internal surface of the FDU-15 channel.

|
Download:
|
| Fig. 3. (a) Nitrogen adsorption-desorption isotherms and (b) pore size distribution of FDU-15 and FDU-15-COOH. | |
In order to further study the humidity sensing properties and determine the optimum testing condition of FDU-15 and FDU-15-COOH, the QCM transducers were employed to measure the sensing performance of different relative humidity. During the whole testing process, most of the tests were performed at room temperature (25.0 ± 1.0 ℃) unless specified.
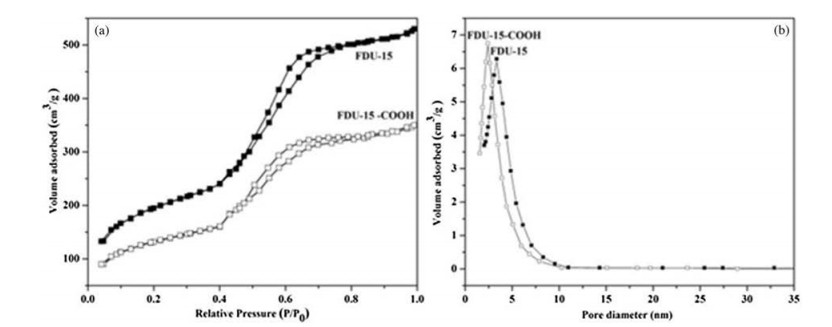
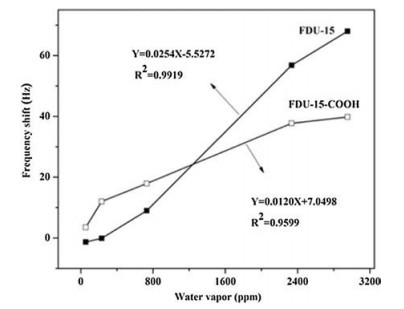
Fig. 4 presents the frequency shifts as a function of time of FDU-15-COOH and FDU-15 thin films at different moist air volume ratiosfrom 55 ppmv to 2952 ppmv. Fig. 5 displays the calibration curve results for FDU-15-COOH and FDU-15 thin films. Table 1 summarizes the sensitivities corresponding to FDU-15-COOH and FDU-15. At the moist air volume ratio of 55 ppmv, the sensitivities of FDU-15-COOH and FDU-15 thin films were 0.1769 and 0.0657, respectively (Table 1), which suggested high FDU-15-COOHthin film response compared with that of FDU-15 thin film at ultra-low humidity (< 729 ppmv). Specifically, the -COOH sites located on the FDU-15-COOH contributed to forming the low-energy adsorption sites, and they were used to be the nucleation sites for the condensation of analyte. As a result, FDU-15-COOH film had high low humidity sensitivity relative to that of FDU-15, and this was because that water vapor was more likely to be adsorbed onto the polar oxygen-containing defrects (-COOH) through forming the hydrogen (H) bonds. Nonetheless, at the moist air volume ratio of > 729 ppmv, the FDU-15 thin film sensitivity was increased relative to that of FDU-15-COOH, which was ascribed to the active reaction sites at a higher moist air volume ratio. Additionally, the surface area of BET for FDU-15 (535 m2/g) was apparently high compared with that of FDU-15-COOH (320 m2/g), which was to the advantage of water adsorption (Fig. 4 and Table 1).

|
Download:
|
| Fig. 4. Frequency shifts (Hz) as a function of time (s) for different volume ratio of the moist air for FDU-15 and FDU-15–COOH. | |

|
Download:
|
| Fig. 5. Frequency change (△Hz) as a function of volume ratio (ppmv) for FDU-15 and FDU-15-COOH. | |
|
|
Table 1 Sensitivity to humidity of FDU-15, FDU-15-COOH thin films coated on QCM for different volume ratios of moist air (ppmv was defined as the volume ratio subtracted by the initial volume ratio of moisture air (2.77 ppmv)). |

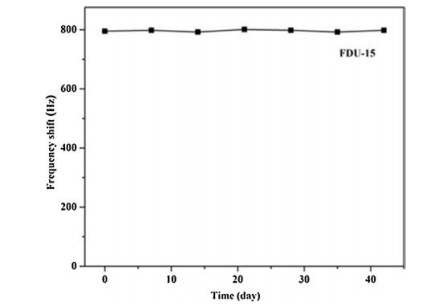
Fig. 6 exhibits the great long-term stability of frequency at 11.3 RH%, which suggested that the humidity sensor based on FDU-15 QCM was appropriate to low-humidity conditions. Consequently, the following mechanisms of sensing were expected: Under lowhumidity environments, FDU-15-COOH was able to construct the adsorption-desorption balance between -COOH group and water molecule, as a result of the interaction between hydrogen and bond. Nevertheless, water molecules were more likely to be adsorbed on FDU-15 surface than on FDU-15-COOH thin film at high humidity conditions, resulting in the decreased QCM resonant frequency.

|
Download:
|
| Fig. 6. The long-term frequency stability at 11.3% RH. | |
Therefore, the FDU-15-COOH thin film have higher sensitivity to low-humidity than FDU-15, which was attributed to the fact that water vapor preferred to adsorb on polar oxygen-containing defects (-COOH) via the formation of hydrogen (H) bonds. However, when the volume ratio of moist air increased to above 729 ppmv, the sensitivity of FDU-15 was higher than that of FDU-15-COOH thin film, due to the appearance of active sites for reaction at higher volume ratio of moist air. Moreover, the BET surface area of the FDU-15 (535 m2/g) was much higher that that of FDU-15-COOH (320 m2/g), which are beneficial to water adsorption (Fig. 4 and Table 1). Fig. 6 shows the high long-term frequency stability at 11.3% RH, indicating that the FDU-15 QCM humidity sensor is suitable for the low humidity condition.
In summary, the sensing mechanism was speculated as follows: in the low humidity environment, FDU-15-COOH can establish an adsorption-desorption equilibrium between water molecules and -COOH groups due to the hydrogen-bond interaction. However, in a relative high humidity environment, the water molecules preferred to adsorb on the surface of FDU-15 thin film rather than FDU-15-COOH, leading the further decrease of resonant frequency of QCM.
Declaration of competing interestThe authors declare that they have no known competing financial interests or personal relationships that could have appeared to influence the work reported in this paper.
| [1] |
K.O. Rocha, S.M. Zanetti, Sens. Actuator. B-Chem. 157 (2011) 654-661. DOI:10.1016/j.snb.2011.05.048 |
| [2] |
B.M. Kulwick, J. Am. Ceram. Soc. 74 (1991) 697-708. DOI:10.1111/j.1151-2916.1991.tb06911.x |
| [3] |
G.N. Chaudhari, A.M. Bende, A.B. Bodade, S.S. Patil, V.S. Sapkal, Sens. Actuator. B-Chem. 115 (2006) 297-302. DOI:10.1016/j.snb.2005.09.014 |
| [4] |
P.G. Su, Sens. Actuator. A-Phys. 179 (2012) 44-49. DOI:10.1016/j.sna.2012.03.018 |
| [5] |
P.R. Story, D.W. Galipeau, R.D. Mileham, Sens. Actuator. B-Chem. 25 (1995) 681-685. DOI:10.1016/0925-4005(95)85150-X |
| [6] |
A.J. Cunningham, Introduction toBioanalytical Sensors, Wiley, New York, 1998, pp. 307.
|
| [7] |
L. Li, H. Song, X. Chen, Electrochim. Acta 51 (2006) 5715-5720. DOI:10.1016/j.electacta.2006.03.005 |
| [8] |
G. Sauerbrey, Z. Phys. 155 (1959) 206-222. DOI:10.1007/BF01337937 |
| [9] |
A. Erol, S. Okur, B. Comba, O. Mermer, M.C. Arıkan, Sens. Actuator. B-Chem. 145 (2010) 174-180. DOI:10.1016/j.snb.2009.11.051 |
| [10] |
B. Yuliarto, Y. Kumai, S.J. Inagaki, H.S. Zhou, Sens. Actuator. B-Chem 138 (2009) 417-421. DOI:10.1016/j.snb.2009.02.026 |
| [11] |
T. Yanagisawa, T. Shimizu, K. Kuroda, C. Kato, Chem. Soc. Jpn. 63 (1990) 988-992. DOI:10.1246/bcsj.63.988 |
| [12] |
C.T. Kresge, M.E. Leonowicz, W.J. Roth, J.C. Vartulli, J.S. Beck, Nature 359 (1992) 710-712. DOI:10.1038/359710a0 |
| [13] |
J.S. Beck, J.C. Vartulli, W.J. Roth, et al., J. Am. Chem. Soc. 114 (1992) 10834-10843. DOI:10.1021/ja00053a020 |
| [14] |
J. Wang, M.Y. Su, J.Q. Qi, L.Q. Chang, Sens. Actuator. B-Chem. 139 (2009) 418-424. DOI:10.1016/j.snb.2009.03.070 |
| [15] |
W.C. Geng, Q. Yuan, X.M. Jiang, et al., Sens. Actuator. B-Chem. 174 (2012) 513-520. DOI:10.1016/j.snb.2012.08.057 |
| [16] |
S. Mintova, S.Y. Mo, T. Bein, Chem. Mater. 13 (2001) 901-905. DOI:10.1021/cm000671w |
| [17] |
R. Wang, X.W. Liu, Y. He, et al., Sens. Actuator. B-Chem. 145 (2010) 386-393. DOI:10.1016/j.snb.2009.12.025 |
| [18] |
J. Liu, F.X. Sun, F. Zhang, et al., J. Mater. Chem. 21 (2011) 3672-3676. DOI:10.1039/c0jm03790g |
| [19] |
E. Radeva, V. Georgiev, L. Spassov, N. Koprinarov, S. Kanev, Sens. Actuator. B-Chem. 42 (1997) 11-13. DOI:10.1016/S0925-4005(97)80306-1 |
| [20] |
Jr W.H. King, Anal. Chem. (1964) 1735-1739. |
| [21] |
Z.M. Rittersma, Sens. Actuator. A-Phys. 96 (2002) 196-210. DOI:10.1016/S0924-4247(01)00788-9 |
| [22] |
S. Mintova, T. Bein, Microporous Mesoporous Mater. 50 (2001) 159-166. DOI:10.1016/S1387-1811(01)00443-7 |
| [23] |
V. Syritski, J. Reut, A. Opik, K. Idla, Synth. Met. 102 (1999) 1326-1327. DOI:10.1016/S0379-6779(98)01047-9 |
| [24] |
H.W. Chen, R.J. Wu, K.H. Chan, Y.L. Sun, P.G. Su, Sens. Actuator. B-Chem. 104 (2005) 80-84. DOI:10.1016/j.snb.2004.04.105 |
| [25] |
P.G. Su, Y.L. Sun, C.C. Lin, Sens. Actuator. B-Chem. 115 (2006) 338-343. DOI:10.1016/j.snb.2005.09.019 |
| [26] |
Y. Zhang, K. Yu, S. Ouyang, et al., Physica. B 368 (2005) 94-99. DOI:10.1016/j.physb.2005.07.001 |
| [27] |
Y.H. Zhu, H. Yuan, J.Q. Xu, P.C. Xu, Q.Y. Pan, Sens. Actuator. B-Chem. 144 (2010) 164-169. DOI:10.1016/j.snb.2009.10.053 |
| [28] |
M. Hartmann, A. Vinu, G. Chandrasckar, Chem. Mater. 17 (2005) 829-833. DOI:10.1021/cm048564f |
| [29] |
J.Y. Yao, L.X. Li, H.H. Song, C.Y. Liu, X.H. Chen, Carbon 47 (2009) 436-444. DOI:10.1016/j.carbon.2008.10.016 |
| [30] |
F. Su, J. Zeng, X Bao, et al., Chem. Mater. 17 (2005) 3960-3967. DOI:10.1021/cm0502222 |
| [31] |
W. Xing, S.Z. Qiao, R.G. Ding, et al., Carbon 44 (2006) 216-224. DOI:10.1016/j.carbon.2005.07.029 |
| [32] |
T Wang, X. Liu, D. Zhao, Z. Jiang, Chem. Phys. Lett. 389 (2004) 327-331. DOI:10.1016/j.cplett.2004.03.086 |
| [33] |
L. Li, H. Song, X. Chen, Electrochim. Acta 51 (2006) 5715-5720. DOI:10.1016/j.electacta.2006.03.005 |
| [34] |
D. Lee, J. Lee, J. Kim, H.B. Na, B. Kim, Adv. Mater. 17 (2005) 2828-2833. DOI:10.1002/adma.200500793 |
| [35] |
Y. Meng, D. Gu, F.Q. Zhang, et al., Chem. Mater. 18 (2006) 4447-4464. DOI:10.1021/cm060921u |
| [36] |
Y. Meng, D. Gu, F.Q. Zhang, et al., Angew. Chem. Int. Ed. 44 (2005) 7053-7059. DOI:10.1002/anie.200501561 |
| [37] |
A. Vinu, K.Z. Hossain, G.K. Satish, K. Ariga, Carbon 44 (2006) 530-536. DOI:10.1016/j.carbon.2005.08.004 |
| [38] |
W. Teng, Z.X. Wu, J.W. Fan, et al., Energy Environ. Sci. 6 (2013) 2765-2776. DOI:10.1039/c3ee41775a |
| [39] |
Z.X. Wu, P.A. Webley, D.Y. Zhao, Langmuir 26 (2010) 10277-10286. DOI:10.1021/la100455w |
| [40] |
Y.F. Jia, K.M. Thomas, Langmuir 16 (2000) 1118. |
| [41] |
C. Moreno-Castilla, M.V. Lopez-Ramon, F. Carrasco-Marin, Carbon 38 (2000) 1995. DOI:10.1016/S0008-6223(00)00048-8 |
| [42] |
J.W. Shim, S.J. Park, S.K. Ryu, Carbon 39 (2001) 1635. DOI:10.1016/S0008-6223(00)00290-6 |