 2020, Vol. 31


b Chongqing Key Laboratory of Green Energy Materials Technology and Systems, Chongqing 400054, China
Carbon monoxide (CO) is a colorless, tasteless, flammable and explosive toxic gas. Inhalation of CO can cause blood hypoxia, and make damage to the heart and central nervous system, even lead to coma or death. Therefore, the low concentration, high sensitivity and rapid detection of CO is very important. Various methods for CO detection have been developed in the past few years [1, 2]. Among them, fiber optic sensor is one of the best choices, primarily because of its immunity to electromagnetic interference, excellent acid and alkali resistance with small size [3, 4]. Optical fiber gas sensor based on Fabry-Pérot interferometer (FPI) has the advantages, such as compact size, linear response, high sensitivity, and low temperature dependence, so it is often used to detect target gas [5, 6]. A temperature-compensated Fabry-Pérot interferometric gas sensor has been fabricated for high temperature application, and the results showed that the gas sensor has a linear sensitivity of 1546 nm/RIU from room temperature to 800 ℃ [7]. A fiber optical Fabry-Pérot interferometer sensor for ammonia detection has been proposed and demonstrated, the sensitivity and limit of detection of the sensor for ammonia gas are around 4.16 pm/ppm and 4.8 ppm, respectively [8].
In optical fiber Fabry-Pérot interferometric gas sensor, the sensing properties of the materials are very important. Polyaniline (PANI), as a conductive polymer, has received widespread attention because of its outstanding properties, such as reversible dopingdedoping chemistry stable electrical conduction, diverse structures, high stability, and different response mechanisms in different gases [9]. The CO gas sensor using polyaniline (PANI) nanofibers has been fabricated by Liu et al. [10], the results demonstrated that the PANI has an excellent responding ability on CO with a concentration as low as 1 ppm. A fiber-optic CO sensor based on PANI/Co3O4/CuO composite film was presented by Feng et al. [11], which has an excellent selectivity to CO with the sensitivity of 2.87 pm/ppm. Recently, a novel dual Fabry-Pérot interferometric CO gas sensor based on PANI/Co3O4 sensing film was proposed and fabricated, the sensor has a strong selectivity to CO and the high sensitivity of 21.61 pm/ppm [12]. Inspired by our previous research, in order to further improve the sensor performance, it is necessary to improve the material sensitivity. Graphene oxide (GO), as an analog of graphene, can adsorb gas molecules efficiently due to its abundant functional groups [13]. Thus in this work, a dual FPI CO gas sensor based on PANI/Co3O4/GO (PCG) sensing membrane is fabricated and evaluated. The FPI sensor is formed by simply splicing a section of endlessly photonic crystal fiber (EPCF) to an ordinary single mode fiber (SMF). One end of EPCF is fused with SMF, and the other end of EPCF is coated with PCG sensing membrane. The EPCF serves as the first FPI cavity, and the PCG sensing membrane acts as the second FPI cavity. Then, the multi-beam interference is obtained in the two FPI cavities, which increases the free spectral range, reduces the spectral width, enhances the fringe fineness, and then effectively improves the sensitivity of the sensor.
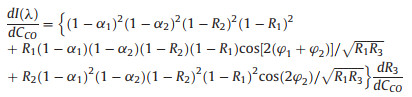
Fig. 1 shows the structural diagram of the FPI sensor. A section of EPCF with the core refractive index (RI) of nEPCF is spliced to a conventional SMF with the core RI of nSMF. As shown in Fig. 1, there are three reflection surfaces in the sensor head, labeled as "mirror 1", "mirror 2" and "mirror 3", respectively. The three mirrors form two cavities of FPI (cavity 1 and cavity 2). The cavity 1 and cavity 2 correspond to the lengths of L1 and L2, respectively. Compared with the double mirrors and single FPI structure, dual FPI structure can enhance the intensity of the reflection, improve the fringe quality, increase the free spectrum range, reduce the spectral linewidth and improve the precision. Meanwhile, it can also strengthen the suppression of sideband, which is more conducive to the realization of sensing [14, 15]. However, since the thickness of PCG film is much less than L1+L2, and the RI difference between the EPCF and thin film is quite small, the reflected light from mirror 1 interferes with the light from mirror 3 to form the main interference pattern. The normalized reflection spectrum I(λ) of FPI can be expressed as [16-20],

|
(1) |

|
Download:
|
| Fig. 1. Schematic diagram of experimental setup, the inset shows schematic diagram of the dual FPI sensor. | |
where, α1 and α2 are the transmission loss factors at mirrors 1 and 2, respectively. R1, R2 and R3 are the reflection coefficients at mirror 1, mirror 2 and mirror 3, respectively, they can be calculated by using the Fresnel formula,

|
(2) |
Where, nSMF and nEPCF are RI of SMF and that of EPCF, respectively. nfilm is the RI of the sensing membrane, and nCO is the RI of the film absorbed CO at a certain concentration in external environment. φ1 and φ2 are the round-trip propagation phase shifts, which can be given as

|
(3) |
According to Eqs. 1 and 3, the reflection spectrum can be calculated. After changing the concentration of CO (Cco), the sensing membrane will adsorb the CO and then the optical properties of the sensing membrane will be varied, thus the reflectivity of mirror 3 will also be changed, and ultimately affects the reflected light intensity that is coupled back to SMF. The intensity sensitivity (dI(λ)/dCco) of the FPI at a given wavelength is expressed as follows,
|
(4) |
Let the intensity I(λ1) correspond to CO concentration which is as the basic value, and the intensity I(λn) correspond to x ppm CO concentration, thus, the intensity difference power can be expressed as

|
(5) |
Thus, when the intensity sensitivity value and the intensity difference are known, the CO concentration in the measured environment can be obtained from Eq. 5.
A broadband amplified spontaneous emission source (ASE, C + L band, China), an optical spectrum analyzer (OSA, AQ6370D, Yokogawa, Japan), optical fiber ring (PIOC315P210, China), and the automatic optical fiber fusion machine (S178C, Furukawa, Japan) were used to evaluate the performance of sensors. The EPCF (Core diameter: 9.5 ± 0.5 μm, YOFC, China) and SMF (Core diameter: 10 ± 0.5 μm, YOFC, China) were also used. All the reagents, such as aniline, hydrogen chloride, ammonium persulfate and cobalt chloride, used in this experiment were analytical purity, and no further purification was done before use.
Graphene oxide (GO) was prepared by modified Hummers method [21]. GO solution was obtained by adding 30 mg of GO to 50 mL of 1 mol/L hydrogen chloride solution under ultrasound. 3.80 mL of aniline was added to GO solution, and then 10 mL of hydrogen chloride solution containing 0.25 g ammonium persulfate was slowly dripped into the reaction system at 20 ℃. After stirring overnight, GO/PANI was obtained by centrifugal washing the obtained mixture. A suitable amount of GO/PANI was added to 50 ml of 0.02 mol/L cobalt chloride solution. After stirring for 2 h at room temperature, the mixed system was transferred to the reactor of polytetrafluoroethylene (PTFE) inner gallbladder 150 ℃ for 6 h. The product was centrifugally cleaned and vacuum dried for 6 h to obtain PANI/Co3O4/GO (PCG) composite. PCG suspension was prepared by ultrasound-assisted method for use. The PCG composite film coated on EPCF end face was obtained by dipcoating method, i.e., the EPCF was immersed in the PCG suspension, and then dried by flushing it with nitrogen gas.
The phase of composite film was identified by X-ray diffraction (XRD, Shimadzu XRD-7000 diffractometer, Japan Cu-Kα1, λ = 1.5406 Å). The composition was investigated by X-ray photoelectron spectroscopy (XPS, USA Al-Kα) spectrometer which is an Escalab 250Xi (Thermo Fisher Scientific, USA) operated in the fixed analyser transmission mode. The molecular structure was investigated by using a Raman spectrometer (LabRAM HR Evolution, ORIBA Scientific, France, λ = 532 nm, Power = 1 mW) and Fourier Transform Infrared Spectrometer (Nicolet iS50, USA).
Schematic diagram of the experimental setup is shown in Fig. 1. Sensor is placed in the glass gas chamber that can introduce the CO gas effectively. Interference spectra were monitored by using OSA. One air valve was used to adjust the concentration of the target gas and the other valve was designed to export the gas from the chamber. The exhaust gas was introduced into the modified activated carbon bottle at the gas outlet to ensure safety and avoid air pollution.
The crystalline phase was established with an X-ray diffraction radiation (XRD) over the 2θ range from 10° to 80°, and Fig. 2 shows the XRD patterns of Co3O4 and PCG composite samples. It is obvious that the strong diffraction peaks of Co3O4 samples are in good agreement with the JCPDS standard Card no. 78-1970, the peaks at 18.9°, 31.2°, 36.9°, 38.6°, 44.8°, 55.7°, 59.4° 65.2°, 77.4°, correspond to the crystal plans of (111), (220), (311), (222), (400), (422), (511), (440), (533), respectively [22]. In the XRD patterns of PCG, the peaks at 14.6°, 20.5°, 26.3°, 29.3° can be attributed to the crystal planes of GO [23], and the peaks at 17.9°, 23.6°, 30.1°, 40.8° can be attributed to crystal planes of PANI [20]. These results indicate that GO and PANI have a certain degree of crystallization [24, 25], and the composite film is PCG material.

|
Download:
|
| Fig. 2. XRD patterns of Co3O4 and PANI/Co3O4/GO composite membrane. | |
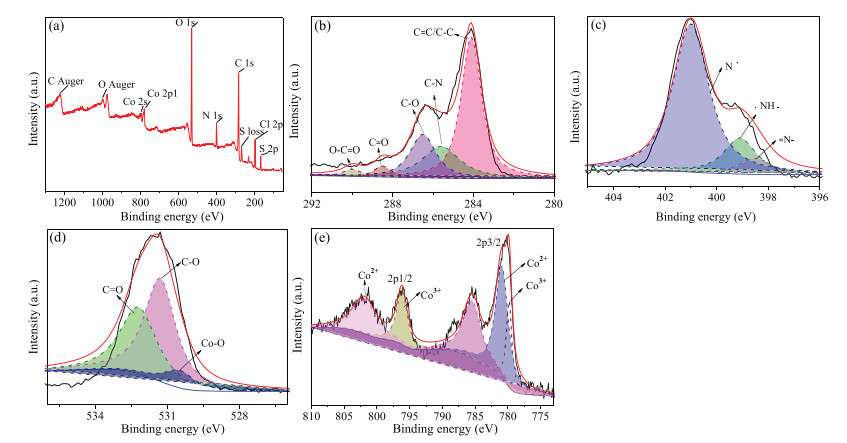
Fig. 3 shows the X-ray photoelectron spectroscopy (XPS) of PCG. Fig. 3a is a full spectrum of elements in composite materials. It shows that the composites mainly contain C, N, O and Co elements. Fig. 3b is a high resolution scanning image of C after peak-dividing treatment, the results show that the binding energies of C-O, C-N, C-C, C = O and O-C = O are 284.1, 285.6, 286.5, 288.5 and 290.1 eV, respectively. Fig. 3c is a high resolution scanning image of N element, it can be seen from the graph that the binding energies of = N-, -NH-, N+ are 398.3, 399.1 and 401.0 eV, respectively. Fig. 3d is a high resolution scanning image of O, the binding energies of Co-O, C-O and C = O are 530.5, 531.3 and 532.3 eV, respectively. Fig. 3e is a high resolution scanning image of Co, where the binding energies of Co2+ and Co3+ in Co 2p3/2 are 779.8 and 796.3 eV respectively, and the binding energies of Co2+ and Co3+ in Co 2p1/2 are 781.9 and 802.1 eV respectively. They are in good agreement with the known XPS test results of Co3O4 [24-27]. This result further indicates the Co3O4 exists in the composites.

|
Download:
|
| Fig. 3. (a) XPS image of PANI/Co3O4/GO, membrane and the corresponding high-resolution XPS scans of the (b) C 1s, (c) N 1s, (d) O 2s and (e) Co 2p. | |
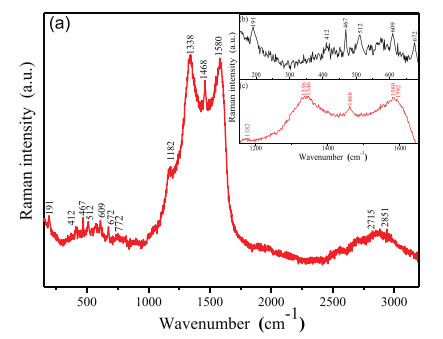
Raman spectra of PCG composite film are collected in Fig. 4. Fig. 4a shows the full Raman spectra of composite films, and Fig. 4b is a local enlargement of the Co3O4 Raman spectra, with peaks of 191, 462, 512, 609 and 672 cm-1, respectively. Fig. 4c is PANI/GO locally amplified Raman spectra with peaks of 1182, 1336, 1346, 1468, 1580 and 1592 cm-1, respectively. These results are consistent with those reported in literature [28].

|
Download:
|
| Fig. 4. Raman spectra of PANI/Co3O4/GO membrane: (a) PANI/Co3O4/GO, (b) Co3O4, and (c) PANI/GO. | |
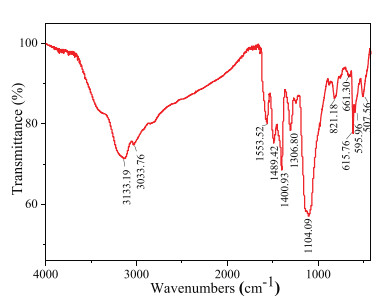
Fig. 5 is the result of Fourier transform infrared (FTIR) spectrum of PCG composites. In the FTIR spectrum of PCG, the strong and sharp absorption peaks at 595.96 and 661.3 cm-1 correspond to the Co-O vibrations of Co3O4 in the sample [29]. 821.18 cm-1 is the characteristic peak of the out-of-plane bending vibration of benzene rings. 1104.09 cm-1 belongs to the symmetrical stretching vibration of C—C bond in the PANI molecule. 1306.8 and 1400.93 cm-1 correspond to the stretching vibrations of aromatic amine and primary amide, respectively, and 1489.42 cm-1 corresponds to the stretching vibration of aromatic ring C=C. The N—H angular vibration of 1553.52 cm-1 belongs to N—H angular vibration (N—H in-plane bending is coupled with C—N stretching). The broadband absorption peaks of 3030.76 and 3133.19 cm-1 are symmetrical stretching vibrations of N—H and —N— in PANI [24, 27].

|
Download:
|
| Fig. 5. Infrared spectrum of PANI/Co3O4/GO membrane. | |
The characteristic peaks of PANI in composite membrane move to the low frequencies in varying degrees. This may be due to the rearrangement of electron clouds caused by the doping of PANI with protonic acid, which results in the formation of conjugated structure in the whole PANI molecular chain and the decrease of resonance frequency of the whole molecule.
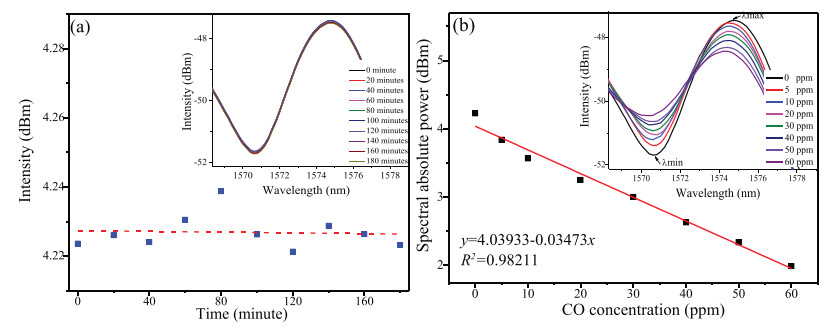
In order to investigate the stability and the accuracy of the FPI sensor, the FPI sensor was put into the air-filled gas chamber at room temperature for 180 min, the result is shown in Fig. 6a, the inset picture is the reflective spectrum versus time. It was found that the variations of the intensity of the sensor are 0.01 dB m which is less than 0.3% (standard error: 0.0031). Different concentrations (0, 5, 10, 20, 30, 40, 50 and 60 ppm) of CO gas were prepared and the spectral responses of FPI sensor to different concentrations of CO were recorded in air at room temperature by the OSA (Fig. 6b). As shown in Fig. 6b, with the increase of CO concentration in the range of 0-60 ppm, the output spectral intensity becomes smaller. The relationship between the intensity of the output spectrum and the measured gas concentration is obtained by calculating the variation of the spectral intensity. It can be seen that the linearity of the sensor is good, the linear fitting value is 0.98211, the sensitivity of the sensor is 0.3473 dB m/ppm, and the limit of detection (LOD) can be calculated from the formula LOD = 3σ/K [30], the result shows that the LOD of this sensor is 0.153 ppm (here, σ = 0.0017, K = 0.03473).

|
Download:
|
| Fig. 6. (a) Stability of the FPI sensor, the inset is the reflective spectrum versus time; (b) The spectral intensity upon the concentration of CO, the inset shows the reflectance spectra of the sensor in various concentrations of CO. | |
It should be noted that the dip intensity decreases with the increase of CO concentration. A qualitative theoretical analysis is adopted. When the PCG sensing membrane contacts CO gas on the FPI sensor end face, the PCG has a good adsorption effect on CO gas, which will enhance the transmission loss of the sensing membrane and weaken the light reflected by R3, and with the increase of CO gas concentration, the light reflected by R3 will also be weakened. Meanwhile, Eq. 5 shows that the intensity difference of the output spectral of the sensor will increase with the increase of gas concentration.
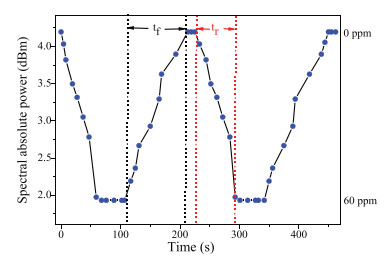
The reflective spectral data were recorded every 10 s in order to determine the dynamic behavior of the gas sensor. As shown in Fig. 7, the dynamic response rising time (tr) and falling time (tf) of the FPI CO gas sensor are determined to be about 68 s and 106 s, respectively. As shown in Fig. 8, the spectral relative power differences of the reflective spectra of the FPI sensor for common ingredients, such as hydrogen sulfide, carbon dioxide, oxygen, argon, helium, nitrogen, argon and ammonia, are tested at 60 ppm. The results show that the FPI sensor exhibits excellent sensitivity and selectivity toward CO. The relative intensity difference for CO is at least 5 times those of other gas environments. These results indicate that CO can be better absorbed than other four gases by the PCG composite membrane.

|
Download:
|
| Fig. 7. Dynamic response of the CO sensor. | |

|
Download:
|
| Fig. 8. Selectivity for hydrogen sulfide, carbon dioxide, oxygen, argon, helium, nitrogen, argon and ammonia. | |
The gas sensing mechanism for PCG is described below. Firstly, the functional groups on GO, such as hydroxyl, epoxy, carbon, carboxyl, etc. play an important role in gas sensing. They make the material proton conductive and facilitate interactions with target gas molecules. Secondly, PANI is a p-type material and its resistance will increase with exposure to electron-donating gases such as CO, then the thickness and RI of PCG will be changed in a very short time. Thirdly, Co3O4 has excellent reversible redox performance 
In summary, a dual FPI CO gas sensor based on PCG sensing membrane is proposed and evaluated. The FPI sensor is fabricated by splicing one end of EPCF with a SMF and coating PCG sensing membrane on the other end. The experimental results show that with the increase of CO concentration, the intensity difference of transmission spectra will be increased. The sensor shows an excellent selectivity for CO in the range of 0-60 ppm, and the sensitivity is 0.3473 dB m/ppm with good linearity. The response time of this sensor is about 106 s, and LOD is 0.153 ppm. The sensor has the advantages of small size, light weight, easy preparation, high sensitivity and selectivity, and could be applied for trace detection of CO in toxic environmental monitoring.
Declaration of competing interestWe declare that we do not have any commercial or associative interest to this work.
AcknowledgmentsThe work was supported by the National Natural Science Foundation of China (No. 51574054), the University Innovation Team Building Program of Chongqing (No. CXTDX201601030), Scientific and Technological Research Program of Chongqing Municipal Education Commission (No. KJZD-M201901102); Chongqing Science and Technology Bureau (Nos. cstc2017shmsA20017, cstc2018jcyjAX0294, CSTCCXLJRC 201905), and the Innovation Leader Project of Chongqing Science and Technology Bureau (No. CSTCCXLJRC201905).
| [1] |
S. Arunkumar, T.F. Hou, Y.B. Kim, et al., Sens. Actuat. B: Chem. 243 (2017) 990-1001. DOI:10.1016/j.snb.2016.11.152 |
| [2] |
R. Kumar, J.G. Mittal, N. Kushwaha, et al., Sens. Actuat. B: Chem. 266 (2018) 751-760. DOI:10.1016/j.snb.2018.03.182 |
| [3] |
Y. Luo, R. Fan, Y. Zhang, et al., Opt. Fiber Technol. 48 (2019) 278-282. DOI:10.1016/j.yofte.2019.01.003 |
| [4] |
M. Zhang, G. Zhu, L. Lu, X. Lou, L. Zhu, Opt. Fiber Technol. 48 (2019) 297-302. DOI:10.1016/j.yofte.2019.01.008 |
| [5] |
W.W. Ma, J.X. Xing, R.H. Wang, et al., IEEE Sens. J. 18 (2018) 1924-1929. DOI:10.1109/JSEN.2018.2790973 |
| [6] |
Y. Bao, Y. Huang, M.S. Hoehler, G.D. Chen, Sensors 19 (2019) 877. |
| [7] |
P.G. Jia, G.C. Fang, T. Liang, et al., Sens. Actuat. B: Chem. 244 (2017) 226-232. DOI:10.1016/j.snb.2016.12.123 |
| [8] |
R. Kanawade, A. Kumar, D. Pawar, et al., J. Opt. Soc. Am. B 36 (2019) 684-689. DOI:10.1364/JOSAB.36.000684 |
| [9] |
I. Fratoddi, I. Venditti, C. Cametti, M.V. Russo, Sens. Actuat. B: Chem. 220 (2015) 534-548. DOI:10.1016/j.snb.2015.05.107 |
| [10] |
C.J. Liu, Z.Y. Noda, K. Sasaki, K. Hayashi, Int. J. Hydrogen Energ. 37 (2012) 13529-13535. DOI:10.1016/j.ijhydene.2012.06.096 |
| [11] |
W.L. Feng, D.S. Deng, X.Z. Yang, et al., IEEE Sens. J. 18 (2018) 8762-8766. DOI:10.1109/JSEN.2018.2868297 |
| [12] |
J. Peng, W.L. Feng, X.Z. Yang, G.J. Huang, S.D. Liu, Z. Naturforsch. A 74 (2019) 101-107. |
| [13] |
K. Toda, R. Furue, S. Hayami, Anal. Chim. Acta 878 (2015) 43-53. DOI:10.1016/j.aca.2015.02.002 |
| [14] |
V.H. Nguyen, C. Lamiel, D.K. harismadewi, V.C. Tran, J.J. Shim, J. Electroanal. Chem. 758 (2015) 148-155. DOI:10.1016/j.jelechem.2015.10.023 |
| [15] |
M.R. Chen, S.W. Bi, X.B. Dou, High Power Laser Part. Beams 22 (2010) 1870-1874. DOI:10.3788/HPLPB20102208.1870 |
| [16] |
V.D.S. Herman, J.M. Muller, J. Opt. Soc. Am. A 2 (1985) 1363-1370. DOI:10.1364/JOSAA.2.001363 |
| [17] |
Y. Ma, X.G. Qiao, T. Cuo, et al., Opt. Lett. 37 (2012) 323-325. DOI:10.1364/OL.37.000323 |
| [18] |
H.Y. Choi, G. Mudhana, K.S. Park, U.C. Paek, B.H. Lee, Opt. Express 18 (2010) 1. DOI:10.1364/OE.18.000001 |
| [19] |
Y.J. Rao, M. Deng, D.W. Duan, T. Zhun, Sens. Actuat. A: Phys. 148 (2008) 33-38. DOI:10.1016/j.sna.2008.06.030 |
| [20] |
D. Wu, W. Huang, G.Y. Wang, J.Y. Fu, Y.Y. Chen, Opt. Commun. 131 (2014) 270-275. |
| [21] |
J. Chen, B. Yao, C. Li, G.Q. Shi, Carbon 64 (2013) 225-229. DOI:10.1016/j.carbon.2013.07.055 |
| [22] |
F.A. Taher, G.M. El-Sayed, N.M. Khattab, N. Almohamady, Renew. Wind Water Solar 2 (2015) 15. DOI:10.1186/s40807-015-0015-z |
| [23] |
Y.S. Yang, M.X. Wan, J. Mater. Chem. A 12 (2002) 897-901. DOI:10.1039/b107384m |
| [24] |
H.Z. Wang, Z.Y. Gou, S.W. Yao, Z.X. Li, W.G. Zhang, Int. J. Electrochem. Sci. 12 (2017) 3721-3731. |
| [25] |
R.F. Nie, J.J. Shi, W.C. Chen, et al., J. Mater. Chem. A 1 (2013) 9037-9045. DOI:10.1039/c3ta11672g |
| [26] |
G. Ren, Y. Li, Z. Guo, et al., Nano Res. 8 (2015) 3461-3471. DOI:10.1007/s12274-015-0844-5 |
| [27] |
H. Lin, Q. Huang, J. Wang, et al., Electrochim. Acta 191 (2016) 444-451. DOI:10.1016/j.electacta.2015.12.143 |
| [28] |
Q.H. Zhang, X.H. Wang, X.B. Jing, Chem. World 42 (2001) 242-244. |
| [29] |
S.F. Weng, Fourier Transforms Infrared Spectroscopy, Chemical Industry Press, Beijing, 2005, pp. 239-271.
|
| [30] |
S.D. Liu, X.Z. Yang, W.L. Feng, Appl. Optics 58 (2019) 2152. DOI:10.1364/AO.58.002152 |
| [31] |
S. Sharma, R. Khosla, S. Das, H. Shrimali, S.K. Sharma, Org. Electron. 57 (2018) 14-20. DOI:10.1016/j.orgel.2018.02.031 |