 2020, Vol. 31


The detection of ethanol is important to the food products and beverage industries [1]. Tin dioxide (SnO2) is a typical semiconductor material with remarkable physical and chemical properties [2, 3]. Meanwhile, materials with hierarchical structures and coreshell structures may lead to higher sensing performance due to particular geometrical structures [4, 5] and higher specific surface areas [6]. Glucose and urea are widely used in synthesizing of nanostructured materials via hydrothermal method. For instance, He et al. [7] synthesized core-shell TiO2 walnuts by adding glucose, urea, HCl and other additives; Huang et al. [8] synthesized flowerlike In2O3 microrods by adding only glucose and urea as additives. However, to our knowledge, there have been little reports on synthesis of tin dioxide nanomaterials using both of urea and glucose via one-step hydrothermal method, so it is still a great challenge to synthesize the expected SnO2 nanomaterials with distinct morphologies. In this work, glucose and urea were both utilized as structural guiding agents to synthesize hierarchical shell-core SnO2 microspheres through a one-step hydrothermal method with subsequent calcination and the combined effect of them had been studied.
For the synthesis of hierarchical shell-core SnO2 microspheres, 3 mmol SnSO4 was dissolved in 30 mL water. Then, 6 mmol D-glucose and 6 mmol urea (molar ratio of 3:3) were successively added to the above solution under stirring to form a mixed solution that was vigorously stirred for 1 h. The resultant mixture was transferred into a 100 mL autoclave and then reacted at 180 ℃ for 24 h. Upon reaction completion, a brown dark precipitates was collected by centrifugal washing several times with water and ethanol and then drying for over 6 h, and finally annealing in air at 500 ℃ for 2 h. Experiments with various molar ratios of D-glucose and urea were also conducted under the same conditions. X-ray diffraction (XRD), field emission scanning electron microscope (FESEM), X-Ray photoelectron spectroscopy (XPS), transmisssion electron microscopy (TEM) and N2 adsorption-desorption analyses were applied to study structures and micromorphologies of the as-synthesized samples. Sensors were prepared by dropping the as-prepared paste on an interphalangeal electrode plate, followed by thermal treatment to form a stable gas-sensitive film. A CGS-1TP instrument (Beijing Elite Tech. Co., Ltd., China) was used to evaluate the abilities of the sensors.
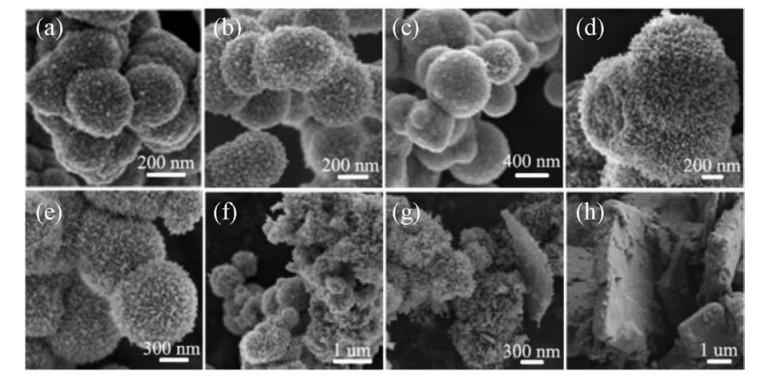
To study effects of the glucose and urea, a series of experiments with different amounts of D-glucose and urea were conducted. The samples synthesized without urea exhibited severely aggregated spherical particles with a size range of 200-500 nm (Fig. 1a). When the amount of urea slightly increased, the morphology of assynthesized SnO2 particles remained nearly unchanged (Fig. 1b) compared with the sample without urea. When the ratio of glucose to urea was increased to 5:3, the as-synthesized samples still retained their spherical structures, but their sizes ranged from 200-800 nm (Fig. 1c). However, when the molar ratio of urea and D-glucose increased to 3:3, the size of the as-synthesized SnO2 microspheres (Figs. 1d and e) obviously became larger (1 μm) with coarsened surfaces, and the broken outer may be the shell of the shell-core structure (Fig. 1d). However, when the urea ratio further increased to 3:5, irregular and large particles with rough surfaces, as well as some smaller spheres coexisted in the synthesized sample (Fig. 1f).

|
Download:
|
| Fig. 1. (a–h) FESEM images of various materials synthesized with different molar ratios of D-glucose and urea after calcinations: (a) 3:0, (b) 3:1, (c) 5:3, (d, e) 3:3, (f) 3:5, (g) 1:3 and (h) 0:3. | |
Interestingly, the SEM image shows that the sample synthesized with only urea contained plate structures (Fig. 1h), with thicknesses of about 1 μm, and lengths ranging from 2-15 μm. This phenomenon indicates that urea promoted the formation of two-dimensional materials. When the ratio of glucose increased slightly, spherical structures, sheets and irregular nanoparticles appeared in the same samples shown in Fig. 1g.
In Figs. S1a-f (Supporting information), the XRD patterns all agreed with JCPDS card No. 41-1445 without any noticeable impurity peaks, illustrating the as-synthesized samples were all pure SnO2. The Dv values (calculated by the Scherrer equation, Dv = Kλ/(βcosθ), where Dv is grain size (nm), K is 0.89, λ is 0.154 nm and β is the diffraction peak half height width of the 110 peaks (rad)) [9] listed in Table S1 (Supporting information) indicate that the crystal sizes tended to increase as more urea was added, while they decreased when the amount of glucose increased. The spectra of samples synthesized with only urea in Fig. S1g (Supporting information) indicated the presence of impurities.
Fig. 2a reveals that the as-synthesized SnO2 samples (3:3) had spherical structures with rough surfaces and a uniform size distribution of about 0.6-1 μm. Fig. 2b shows the enlarged FESEM image of SnO2 spherical nanostructures, and it can clearly be seen that the SnO2 spheres were all composed of the same basic rice-like nanoparticles. Figs. 2c and d are the TEM images of corresponding samples above. A thin shell and large dark core can be observed, and the thickness of the shell was estimated to be 40-60 nm. The sizes of the basic rice-like nanoparticles were estimated to 16-25 nm in diameter and 16-45 nm in length. Fig. 2e is the survey XPS spectra, the component elements of the sample are Sn and O, without other peaks of impurities.Fig. 2 fis XPS spectrum for Sn 3d levels, two peaks located at ~487 and ~495.5 eV could be corresponding with Sn 3d5/2 and Sn 3d3/2, respectively.

|
Download:
|
| Fig. 2. (a, b) FESEM images of the hierarchical shell-core SnO2 microspheres (3:3) with calcination. (c, d) TEM images of the same sample. (e, f) XPS spectrum of the same sample. | |
Fig. S2 (Supporting information) displays that the pore size distribution of the hierarchical shell-core SnO2 microspheres (molar ratio of glucose and urea was 3:3) ranged from 6-70 nm with an average pore size of 20.28 nm. Additionally, the calculated BET surface area was 28.35 m2/g.
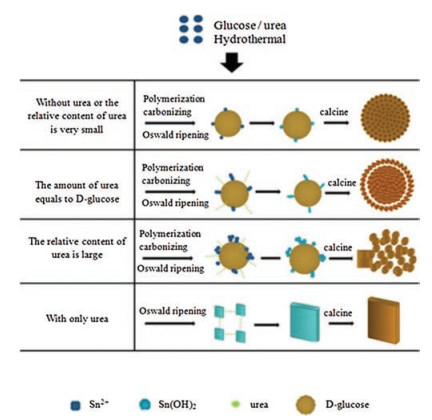
By analyzing the above characterization results, a feasible explanation for the various morphologies was proposed and is shown in Fig. 3. First, Sn2+ was produced after SnSO4 dissolved in water. Meanwhile, D-glucose polymerized into oligosaccharides [10] and further dehydrated to form carbon nuclei at 180 ℃. Afterward, Sn2+ adsorbed onto carbonaceous microspheres due to the presence of many hydrophilic functional groups (-OH, -C=O, etc.) on the surface [11]. Later, the Sn2+ hydrolyzed into Sn(OH)2 on the carbonaceous spheres and then served as nucleation sites for SnO2 crystallites [9]. Without urea or when the relative content of urea (the proportion of urea in the total molar amount of urea and D-glucose) was small (< 38 %), small SnO crystallites oxidized into SnO2 crystallites before merged into one large SnO crystallite because of the dispersion of carbon spheres and the low hydrolysis rate of Sn2+. Then these SnO2 crystallites gradually assembled into microspheres with small sizes. For the formation of hierarchical shell-core SnO2 microspheres, when equal amounts of urea and glucose were used, the urea released OH- [12, 13] which accelerated the growth of SnO crystallites. This allowed multiple SnO crystallites to grow into one large SnO nanoparticle which was further oxidized into basic rice-like SnO2 nanopartilces. Then, these primary rice-like SnO2 nanopartilces begun to self-assemble via aggregation to form large and more consistent microspheres via Ostwald ripening [14]. The shell-core structure was also formed at this time to reduce the surface energy. When only urea was used, an increasing amount of Sn2+ was converted onto Sn(OH)2, which then slowly developed into plates via ripening [15]. However, When the relative content of urea was high (> 60 %), the growth of SnO crystallites noticeably accelerated, which resulting in an inhomogenous morphology due to the competing effects from the urea and glucose. Finally, the subsequent calcining process removed the residual organic matter, forming the micropores.

|
Download:
|
| Fig. 3. Schematic diagram of the growing orientation for several types of materials. | |
Fig. S3 (Supporting information) exhibits the results of gas-sensing responses of sensors based on several materials with different glucose and urea molar ratios to 50 ppm ethanol gas at various temperatures. All seven sensors reached their maximum responses at 250 ℃. The sensors based on hierarchical shell-core SnO2 microspheres (molar ratio of glucose and urea was 3:3) showed significantly higher sensing responses than materials with other molar ratio of glucose and urea, possibly due to their more uniform particle sizes and higher specific surface areas. So only sensors fabricated using the hierarchical shell-core SnO2 microspheres were discussed subsequently.
Fig. 4a shows the sensing ability of sensors based on hierarchical shell-core SnO2 nanostructures at various ethanol concentrations (500 ppb-100 ppm) at 250 ℃. The data shows that responsivities increased as the ethanol concentration increased, and increased nearly linearly at ethanol concentrations from 500 ppb-10 ppm. The responses measured ranged from 1.51 to 87.25 for 500 ppb-100 ppm ethanol, and the lower detecting limit was 500 ppb ethanol. The sensor also displayed a rapid response and recovery speed to ethanol from 500 ppb-100 ppm, with an obvious signal at an ethanol gas concentration of 500 ppb (Fig. 4b).

|
Download:
|
| Fig. 4. (a) Response over the hierarchical shell-core SnO2 microspheres toward ethanol gas with different concentrations (500 ppb-100 ppm) at 250 ℃; (b) Dynamic response curve of the sensor fabricated using the hierarchical shell-core SnO2 microspheres to 500 ppb-100 ppm ethanol at 250 ℃. | |
Moreover, the typical response and recovery times of a sensor fabricated using the hierarchical shell-core SnO2 nanostructures to 50 ppm ethanol were 7 s and 28 s, respectively at the optimumworking temperature (Fig. S4a in Supporting information). The sensor also exhibited good selectivity toward ethanol gas (Fig. S4b in Supporting information), and its maximum response toward 50 ppm ethanol gas (~63) was much larger than those of acetone (6.7), isopropanol (13.1), formaldehyde (5.3), methanol (12.6) and pyridine (4.2).
A representative oxygen adsorption model (Fig. S5 in Supporting information) is used to explain the gas sensing mechanism [16, 17]. When the sensor based on hierarchical shell-core SnO2 nanostructures was at its operating temperature in air, atmospheric oxygen [18] was adsorbed onto the surface of the sensing materials. Trapped electrons from the conduction band of SnO2 were then ionized to O2-, O- and O2-, generating a depletion layer which increased the resistance of the sensor. However, when ethanol gas was present in the air, ethanol molecules reacted with adsorbed oxygen species via the reaction: (CH3CH2OH + 6O- = 2CO2 + 3H2O + 6e-). The electrons produced from this reaction returned to the conduction band of SnO2 which significantly decreased the resistance of the sensor. The material exhibits higher sensitivity to ethanol because it could attract the more electrons from adsorbed oxygen than other gases [2, 19].
In summary, hierarchical shell-core SnO2 microspheres materials were successfully synthesized using D-glucose and urea as structural guiding agents via a facile hydrothermal reaction and subsequent heat treatment. The influence of glucose and urea on the formation of hierarchical SnO2 microspheres was discussed. The results revealed that glucose facilitated the development of spherical structure, while urea was important for evolving the hierarchical structure by increasing the crystal size. Gas sensing measurements showed that a sensor based on hierarchical shellcore SnO2 microspheres displayed a high response toward ethanol gas, with a lower ethanol detection limit of 500 ppb at 250 ℃. Meanwhile, the sensor displayed good selectivity to ethanol against VOCs gases such as acetone and formaldehyde. This study demonstrated that sensors based on hierarchical shell-core SnO2 microspheres have great potential for use in the selective detection of ethanol gas.
Declaration of competing interestThe authors declare that they have no known competing financial interests or personal relationships that could have appeared to influence the work reported in this paper.
AcknowledgmentThis work was financially supported by the National Natural Science Foundation of China (No. 21471120).
Appendix A. Supplementary dataSupplementary material related to this article can befound, in the online version, at doi:https://doi.org/10.1016/j.cclet.2019.11.051.
| [1] |
N. Nithya, G. Bhoopathi, G. Magesh, O.N. Balasundaram, Mat. Sci. Semicon. Proc. 99 (2019) 14-22. DOI:10.1016/j.mssp.2019.04.013 |
| [2] |
L. Xiao, S.M. Shu, S.T. Liu, Sens. Actuator. B-Chem. 221 (2015) 120-126. DOI:10.1016/j.snb.2015.06.099 |
| [3] |
Z.J. Zhang, Y.X. Hou, S.F. Zhang, et al., Chin. Chem. Lett. 29 (2018) 1656-1660. DOI:10.1016/j.cclet.2018.06.017 |
| [4] |
L. Xiao, S.R. Xu, G. Yu, S.T. Liu, Sens. Actuator. B-Chem. 255 (2018) 2002-2010. DOI:10.1016/j.snb.2017.08.216 |
| [5] |
Y.H. Sun, P.P. Dong, X. Lang, J.M. Nan, Chin. Chem. Lett. 25 (2014) 915-918. DOI:10.1016/j.cclet.2014.04.013 |
| [6] |
L. Wang, Z. Lou, J. Deng, R. Zhang, T. Zhang, ACS Appl. Mater Interface 7 (2015) 13098-13104. DOI:10.1021/acsami.5b03978 |
| [7] |
F. He, C. Zhang, D. Zhou, et al., Dalton Trans 43 (2014) 7599. DOI:10.1039/c3dt53593b |
| [8] |
F. Huang, W. Yang, F. He, S.T. Liu, Sens. Actuator. B-Chem. 235 (2016) 86-93. DOI:10.1016/j.snb.2016.05.060 |
| [9] |
D. Deng, J.Y. Lee, Chem. Mater. 20 (2008) 1841-1846. DOI:10.1021/cm7030575 |
| [10] |
P. Rai, J.W. Yoon, H.M. Jeong, et al., Nanoscale 6 (2014) 8292-8299. DOI:10.1039/C4NR01906G |
| [11] |
X. Li, X. Zhou, H. Guo, et al., ACS Appl. Mater. Interfaces 6 (2014) 18661-18667. DOI:10.1021/am5057322 |
| [12] |
P. Song, D. Han, H. Zhang, et al., Sens. Actuator. B-Chem. 196 (2014) 434-439. DOI:10.1016/j.snb.2014.01.114 |
| [13] |
J. Qi, J. Chen, G. Li, et al., Energy Environ. Sci. 5 (2012) 8937. DOI:10.1039/c2ee22600f |
| [14] |
H. Sun, C. Zhang, Y. Peng, W. Gao, New J. Chem. 43 (2019) 4721-4726. DOI:10.1039/C9NJ00292H |
| [15] |
S. Guo, X. Zhang, Z. Hao, et al., RSC Adv. 4 (2014) 31353-31361. DOI:10.1039/C4RA03563A |
| [16] |
J. Zhang, X. Liu, S. Wu, et al., J. Mater. Chem. 20 (2010) 6453. DOI:10.1039/c0jm00457j |
| [17] |
F. Gu, H. Chen, D. Han, Z. Wang, RSC Adv. 6 (2016) 29727-29733. DOI:10.1039/C6RA03034C |
| [18] |
P. Sun, W. Zhao, Y. Cao, et al., CrystEngComm 13 (2011) 3718. DOI:10.1039/c1ce05073g |
| [19] |
M. Bagheri, N.F. Hamedani, A.R. Mahjoub, A.A. Khodadadi, Y. Mortazavi, Sens. Actuator. B-Chem. 191 (2014) 283-290. DOI:10.1016/j.snb.2013.10.001 |