 2020, Vol. 31


b University of Chinese Academy of Sciences, Beijing 100049, China
Aflatoxins, one main kind of mycotoxins, are secondary metabolites produced by Aspergillus parasiticus and Aspergillus flavus. They are the predominant and natural contamination in many food sources, such as spices, cereals, fruits products, wine and etc. [1, 2]. AFB1 has been classified as a primary carcinogenic compound by the International Agency for Research in Cancer (IARC) [3]. Thus, sensitive and selective detection of AFB1 is of great importance for food safety, environmental analysis, and health study [2].
Recently, the use of aptamers has received increasing attentions in targets detection because of advantages of aptamers in synthesis, labeling, thermostability and cost [4-6]. Fluorescence polarization/fluorescence anisotropy (FP/FA) assay shows strength in simplicity, sensitivity, reproducibility and high throughput analysis [7], and has wide applications in small molecule detection [7-9]. FP and FA are commonly used two terms, and they can be interchanged [7]. Combining advantages of aptamer and FA analysis, aptamer-based FA assays enable detection of small molecules in a variety of formats with improving performance [10-12], which overcome the limitations of traditional FA assays using immunoantibodies for small molecules. Aptamer structure switch FA assays for small molecules [10, 11, 13] are based on FA changes caused by the competition between aptamer-target binding and aptamer-cDNA hybridization [14, 15]. In these FA assays, nanomaterials [16, 17] or macromolecules (e.g., proteins, enzymes and oligonucleotides) are often used to enhance FP/FA signal change and sensitivity [18-20] by increasing molecular mass changes in the target-involved binding events [10, 11]. However, proteins may meet some drawbacks in stability and cost, and preparation and functionalization of nanomaterials are challenging.
It is known tetramethylrhodamine-guanine (TMR-G) interac-tion can restrict local rotation of TMR label and cause high FA signals of TMR label [21, 22]. Such TMR-G interaction can be used to develop aptamer FA assays [10, 23-25]. This TMR-G interaction based strategy is mostly applied in direct FA assays, in which aptamer having TMR label on a specific site is used as a fluorescent probe [10, 24, 25]. Target-aptamer binding induces the conforma-tion change of the aptamer probe and alteration of TMR-G interaction, causing changes of FA of TMR. Direct FA assays are simple, but they require screening different sites of the aptamer to find a suitable site for TMR label.
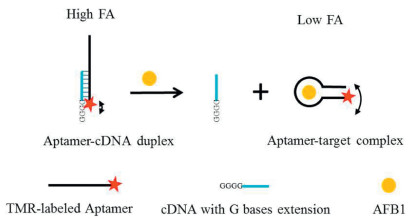
Here, taking advantage of the TMR-G interaction induced FA changes, we present a simple aptamer FA assay for sensitive detection of AFB1 using TMR-labeled aptamer and its complementary DNA (cDNA) with tandem guanine bases exten-sion. As illustrated in Scheme 1, TMR is labeled at the 5' terminal of aptamer and tandem G bases is added at the 3' end of its cDNA. In the absence of target, the TMR-labeled aptamer hybridizes with the cDNA. In the DNA duplex, the TMR is close to the tandem G bases of cDNA, displaying a large FA value due to the interaction between TMR and G and the restricted local rotation. In the presence of AFB1, aptamer binds with AFB1 instead of the cDNA due to competition, and the TMR-G interaction is disrupted. Thus, FA decreases with addition of AFB1. Finally, AFB1 detection can be achieved by measuring the decrease of FA signals.

|
Download:
|
| Scheme 1. Schematic representation of the aptamer structure switch FA assay for the detection of AFB1 using TMR-labeled aptamer probe and the short complementary DNA (cDNA) containing added tandem G bases at the terminal. In the absence of target, aptamer hybridizes with its complementary DNA with tandem G bases extension. Because of the interaction between TMR label in aptamer and G bases in cDNA, the FA of TMR label in duplex is high. In the presence of AFB1, aptamer binds with AFB1 instead of the cDNA due to competition, and the TMR-G interaction is disrupted. Thus, FA decreases with addition of AFB1. | |
We first tested the feasibility of the proposed FA assay. We chose a TMR-labeled aptamer (TMR-Apt) against AFB1 with high affinity as an aptamer probe (Table S1 in Supporting information), which had a dissociation constant at tens nmol/L level [25]. As Fig. 1a shows, the FA value of free TMR-Apt was 0.226. When the cDNA14 that did not contain tandem G nucleotides was added, the FA value of duplex of TMR-Apt and cDNA14 was 0.224, which is close to the FA value of free TMR-Apt (Fig. 1b). In contrast, when the TMR-Apt was incubated with cDNA14-G4 that contained four G nucleotides at the terminal, forming a DNA duplex, and the FA value of TMR label increased to 0.306 (Fig. 1c). It shows the tandem G nucleotides extension in cDNA can significantly increase the FA value of TMR label in duplex due to the interaction between TMR and G, which restricts the local rotation of TMR. In the system using aptamer and cDNA14-G4, when 200 nmol/L AFB1 was present, the FA value decreased from 0.306 to 0.226 (Fig. 1d). It demonstrates that our proposed aptamer structure switch FA assay is feasible for the detection of AFB1.

|
Download:
|
| Fig. 1. FA values of different systems. (a) 5 nmol/L TMR-Apt probe, (b) mixture of 5 nmol/L TMR-Apt probe and 20 nmol/L cDNA14, (c) mixture of 5 nmol/L TMR-Apt probe and 20 nmol/L cDNA14-G4, and (d) mixture of 5 nmol/L TMR-Apt probe, 20 nmol/L cDNA14-G4 and 200 nmol/L AFB1. All samples were incubated for 30 min at 4 ℃. | |
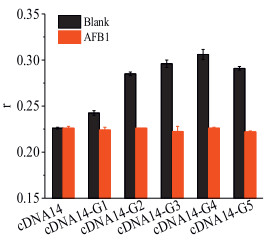
To optimize the FA assay for detecting AFB1, we investigated the effects of the number of added tandem G bases at the terminal of the cDNA, the ratio of aptamer probe to cDNA, metal ions in binding buffer, pH of binding buffer, and incubation time. As shown in Fig. 2, the FA of TMR label in formed duplex of TMR-Apt and different cDNAs (cDNA14, cDNA14-G1, cDNA14-G2, cDNA14-G3, cDNA14-G4, and cDNA14-G5) increased with increasing number of tandem G bases from 1 to 4. It suggests that the TMR-G interaction is enhanced with the increase of G bases. The FA value of TMR label in the formed duplex began to decrease when cDNA14-G5 was incubated with TMR-Apt. The presence of AFB1 caused FA decrease for all the tested cDNA, and the number of G bases in cDNA showed negligible effect on the FA of duplex in the presence of 200 nmol/L AFB1. The maximum FA decrease caused by 200 nmol/L AFB1 was obtained when cDNA14-G4 was applied. Therefore, cDNA14-G4 was chosen for further experiment.

|
Download:
|
| Fig. 2. Effect of the number of extension G bases at the 3' end of cDNA (20 nmol/L) on the FA of TMR-Apt (5 nmol/L) in the absence and in the presence of AFB1 (200 nmol/L). | |
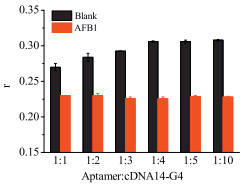
Then, we investigated the effect of ratio of TMR-Apt to cDNA14-G4 on the FA signals in the absence and in the presence of 200 nmol/L AFB1. As shown in Fig. 3, the FA of TMR label in the blank sample gradually increased with the increase of ratio of TMR-Apt to cDNA14-G4 from 1:1 to 1:4. No further increase in FA signals of blank samples was observed with further increase of the ratio. It shows that increasing the amount of cDNA can facilitate the formation of duplex. The FA value upon addition of 200 nmol/L AFB1 was constant with the increase of ratio of aptamer probe to cDNA. Therefore, FA measurement was performed with the ratio of aptamer probe to cDNA at 1:4 because a larger AFB1 caused FA change was obtained at this condition.

|
Download:
|
| Fig. 3. Effect of the ratio of TMR-labeled aptamer to cDNA14-G4 on the FA values of TMR-Apt (5 nmol/L) in the absence and in the presence of AFB1 (200 nmol/L). | |
The concentration of MgCl2 in binding buffer significantly influenced the FA assay (Fig. S2 in Supporting information). Without MgCl2 in the binding buffer, the presence of AFB1 only caused little FA signal changes. With increase of MgCl2, the FA changes caused by AFB1 increased. When MgCl2 was at 10 mmol/L or higher, the AFB1-induced FA changes became large and steady. In the binding buffer containing varying concentrations of NaCl instead of MgCl2, the FA signals only slightly changed in the presence of AFB1 (Fig. S3 in Supporting information). The results show MgCl2 is critical and more important than NaCl for the FA assay because MgCl2 is required for the affinity binding between aptamer and AFB1. As Fig. S4 (Supporting information) shows, the low solution pH is not favorable for the FA assay, which may weaken the binding affinity of aptamer. The buffer containing 10 mmol/L Tris—HCl (pH 7.5), 50 mmol/L MgCl2, 50 mmol/L NaCl, and 0.1% Tween 20 was chosen as the binding buffer in the assay.
The incubation time had influence on the FA assay. As shown in Fig. S5 (Supporting information), the FA of the duplex of TMR-Apt and cDNA14-G4 gradually increased with the increase of incuba-tion time from 10 min to 30 min and then leveled off. Therefore, FA measurement was performed after 30 min incubation because a large signal change was caused by AFB1.
Under optimal conditions, we successfully achieved detection of AFB1 in the FA assays using TMR-Apt (5 nmol/L) and cDNA14-G4 (20 nmol/L). As Fig. 4 shows, the FA of TMR label gradually decreased with the increase of AFB1. The detection limit of AFB1 was about 125 pmol/L (~0.039 mg/kg) (determined by S/N = 3), with dynamic detection range from 125 pmol/L to 31.2 nmol/L. The limit of quantitation was about 0.5 nmol/L (determined by S/N = 10). As comparison, when the incubation temperature at 25 C was applied (Fig. S6 in Supporting information), the detection limit increased to 15.6 nmol/L, suggesting the low incubation temperature is preferred for our FA assay to achieve better performance. The detection limit of our assay is lower than the maximum regulation levels of AFB1 allowed in food products set by the European Union (2 mg/kg) and World Health Organization (WHO, 5 mg/kg) [3]. The maximum net FA decrease caused by AFB1 was about 0.080, and the corresponding maximum net fluorescence polarization (FP) decrease was 0.094 (Fig. S7 in Supporting information). As shown in Table S2 (Supporting information), the detection limit of this assay is lower than the immune-FP assays and is comparable to some aptamer structure switch FP/FA assays using protein and nano-materials as enhancer [20, 26-28], but higher than that of the aptamer FA/FP assay using multiple amplifications [29]. Our method only needs two DNA sequences, much simpler than the aptamer structure switch FA assay using proteins or nanoparticles to enhance signal change caused by target binding. Compared to other aptamer-based methods without using FA analysis for AFB1 detection, our detection limit is comparable to or better than some assays [30-33], although the detection limit of our assay is higher than that of the assay using PCR amplification [34]. Compared with the chromatography-based methods, which are standard methods for AFB1 detection, our assay is more simple and rapid, and the detection limit of our method is comparable to or lower than that of some chromatography based methods [2].

|
Download:
|
| Fig. 4. Detection of AFB1 by the FA assay using TMR-Apt and cDNA14-G4. | |
To test the selectivity of our proposed assay for AFB1, we tested other mycotoxins, such as ochratoxin A (OTA), fumonisin B1 (FB1), fumonisin B2 (FB2) and zearalenone (ZAE) in our FA assay. As shown in Fig. S8 (Supporting information), the tested other mycotoxins did not cause FA change. The simultaneously existing of mycotoxins showed little effect on the FA response to AFB1. These results suggest that our proposed assay is selective for AFB1 detection because the anti-AFB1 aptamer specifically binds with AFB1.
The performance of the proposed FA assay in complex sample matrix was evaluated by testing the FA of TMR label in diluted tap water, grape juice and milk samples. As shown in Fig. S9 (Supporting information), detection of AFB1 spiked in 10-fold diluted tap water and 20-fold diluted grape juice samples were achieved. The maximum FA changes of TMR label in 10-fold diluted tap water were a little higher than that in buffer, as some components in tap water show influence on the FA value of TMR label in duplex. The maximum FA changes of TMR label in 20-fold diluted grape juice were similar to that in buffer. AFB1 spiked in 10-fold diluted milk sample was also detected, with a similar performance to that in the binding buffer solution (Fig. S10 in Supporting information). The detection limit of AFB1 in complex sample matrix was 125 pmol/L. These results show that our proposed assay can be applied to AFB1 detection in complex sample matrix, and it has potential for real sample analysis.
In summary, we developed an FA assay for detection of AFB1 in homogeneous solution, by using TMR-labeled aptamer and its complementary DNA with tandem guanine bases extension. This strategy combined the target binding induced aptamer structure switch and TMR-G interaction to enhance FA signals. In our assay, the presence of AFB1 caused a large FA decrease with a maximum FA change about 0.080. This assay achieved a detection limit as low as 125 pmol/L. Our approach takes the advantages of DNA ligands, such asfacilesynthesis, easylabelingandgoodthermal stability, anditalso combines merits of FA analysis in simplicity, rapidity, reproducibility and high throughput analysis. This FA assay strategy shows potential for application to detect different small molecules by using the corresponding aptamers against the small molecule targets.
Declaration of competing interestsThe authors declare that they have no known competing financial interests or personal relationships that could have appeared to influence the work reported in this paper.
AcknowledgmentsWe are thankful for the financial support from the National Natural Science Foundation of China (Nos. 21874146, 21575153, 21435008), Strategic Priority Research Program of the Chinese Academy of Sciences (No. XDB14030200).
Appendix A. Supplementary dataSupplementary material related to this article can be found, in the online version, at doi:https://doi.org/10.1016/j.cclet.2020.01.022.
| [1] |
S. Rawal, J.E. Kim, R. Coulombe, Res. Vet. Sci. 89 (2010) 325-331. DOI:10.1016/j.rvsc.2010.04.011 |
| [2] |
S. Bakırdere, S. Bora, e.g. Bakırdere, et al., Cent. Eur. J. Chem. 10 (2012) 675-685. |
| [3] |
Y. Dai, K. Huang, B. Zhang, L. Zhu, W. Xu, Food Chem. Toxicol. 109 (2017) 683-689. DOI:10.1016/j.fct.2017.06.034 |
| [4] |
M.R. Gotrik, T.A. Feagin, A.T. Csordas, M.A. Nakamoto, H.T. Soh, Acc. Chem. Res. 49 (2016) 1903-1910. DOI:10.1021/acs.accounts.6b00283 |
| [5] |
H. Ma, J. Liu, M.M. Ali, et al., Chem. Soc. Rev. 44 (2015) 1240-1256. DOI:10.1039/C4CS00357H |
| [6] |
X. Nie, X. Ning, Y.Y. Zhao, et al., Chin. Chem. Lett. 28 (2017) 619-624. DOI:10.1016/j.cclet.2016.11.013 |
| [7] |
D.M. Jameson, J.A. Ross, Chem. Rev. 110 (2010) 2685-2708. DOI:10.1021/cr900267p |
| [8] |
W.A. Lea, A. Simeonov, Expert Opin. Drug Discov. 6 (2011) 17-32. DOI:10.1517/17460441.2011.537322 |
| [9] |
H. Zhang, S. Yang, K.D. Ruyck, et al., Trends Analyt. Chem. 114 (2019) 293-313. DOI:10.1016/j.trac.2019.03.013 |
| [10] |
Q. Zhao, J. Tao, J.S. Uppal, et al., Trends Analyt. Chem. 110 (2019) 401-409. DOI:10.1016/j.trac.2018.11.018 |
| [11] |
S. Perrier, V. Guieu, B. Chovelon, C. Ravelet, E. Peyrin, Anal. Chem. 90 (2018) 4236-4248. DOI:10.1021/acs.analchem.7b04593 |
| [12] |
J. Chen, J. Liu, X. Chen, H. Qiu, Chin. Chem. Lett. 30 (2019) 1575-1580. DOI:10.1016/j.cclet.2019.06.005 |
| [13] |
J.A. Cruz-Aguado, G. Penner, Anal. Chem. 80 (2008) 8853-8855. DOI:10.1021/ac8017058 |
| [14] |
R. Nutiu, Y. Li, Chem. Eur. J. 10 (2004) 1868-1876. DOI:10.1002/chem.200305470 |
| [15] |
X. Su, X. Xiao, C. Zhang, M. Zhao, Appl. Spectrosc. 66 (2012) 1249-1261. DOI:10.1366/12-06803 |
| [16] |
Y. Huang, S. Zhao, Z. Chen, M. Shi, H. Liang, Chem. Comm. 48 (2012) 7480-7482. DOI:10.1039/c2cc33021k |
| [17] |
J.H. Liu, C.Y. Wang, Y. Jiang, et al., Anal. Chem. 85 (2013) 1424-1430. DOI:10.1021/ac3023982 |
| [18] |
B. Yang, X. Zhang, L. Kang, et al., Anal. Chem. 85 (2013) 11518-11523. DOI:10.1021/ac402781g |
| [19] |
J. Tian, Y. Wang, S. Chen, et al., Microchim. Acta 180 (2013) 203-209. DOI:10.1007/s00604-012-0919-x |
| [20] |
Y. Li, Q. Zhao, Anal. Chem. 91 (2019) 7379-7384. DOI:10.1021/acs.analchem.9b01253 |
| [21] |
J.R. Unruh, G. Gokulrangan, G.S. Wilson, C.K. Johnson, Photochem. Photobiol. 81 (2005) 682-690. DOI:10.1562/2004-10-06-RA-339.1 |
| [22] |
D. Zhang, H. Shen, G. Li, et al., Anal. Chem. 84 (2012) 8088-8094. DOI:10.1021/ac302320x |
| [23] |
D. Zhang, R. Fu, Q. Zhao, H. Rong, H. Wang, Anal. Chem. 87 (2015) 4903-4909. DOI:10.1021/acs.analchem.5b00479 |
| [24] |
Q. Zhao, Q. Lv, H. Wang, Anal. Chem. 86 (2014) 1238-1245. DOI:10.1021/ac4035532 |
| [25] |
L. Sun, Q. Zhao, Talanta 189 (2018) 442-450. DOI:10.1016/j.talanta.2018.07.036 |
| [26] |
N.V. Beloglazova, S.A. Eremin, Talanta 142 (2015) 170-175. DOI:10.1016/j.talanta.2015.04.027 |
| [27] |
Y. Sheng, S.A. Eremin, T. Mi, et al., Biomed. Environ. Sci. 27 (2014) 126-129. |
| [28] |
H. Ye, Q. Lu, N. Duan, Z. Wang, Anal. Bioanal. Chem. 411 (2019) 1107-1115. DOI:10.1007/s00216-018-1540-6 |
| [29] |
H. Huang, J. Qin, K. Hu, et al., RSC Adv. 6 (2016) 86043-86050. DOI:10.1039/C6RA17959B |
| [30] |
C. Zhu, G. Zhang, Y. Huang, et al., J. Hazard. Mater. 344 (2018) 249-257. DOI:10.1016/j.jhazmat.2017.10.026 |
| [31] |
C. Zhang, X. Dou, L. Zhang, et al., Toxins 10 (2018) 101. DOI:10.3390/toxins10030101 |
| [32] |
Y. Ma, Y. Mao, D. Huang, et al., Lab Chip 16 (2016) 3097-3104. DOI:10.1039/C6LC00474A |
| [33] |
Z. Lu, Y. Wang, D. Xu, L. Pang, Chem. Commun. 53 (2017) 941-944. DOI:10.1039/C6CC08831G |
| [34] |
X. Guo, F. Wen, N. Zheng, et al., Biosens. Bioelectron. 56 (2014) 340-344. DOI:10.1016/j.bios.2014.01.045 |