 2020, Vol. 31


b School of Chemistry and Chemical Engineering, Yangzhou University, Yangzhou 225009, China
Nowadays, the global fossil fuels consumption and the unfriendly impact on the environment have attracted the attention of many governments, which need to make great efforts to find sustainable and green energy source [1-4]. Researchers have developed a variety of energy conversion technologies in the hope of promoting social development in a green way [5-8]. Among the many candidates, glucose (GLU) have great potential for being used as an environmentally friendly raw material owing to the most abundant and non-toxic [9-11]. Moreover, GLU as a reliable raw material to be developed, excellent electrocatalysts have aroused extensive exploration in order to maximize the utilization of GLU [12-14]. Although researchers have made great efforts and achievements in the exploration of electrocatalysts, there is still great room to explore better materials in the field of electro-catalysts, such as enhancing mass transfer, increasing surface area and increasing active sites [15-17].
Although noble metal-based nanomaterials are widely used in the electrocatalytic oxidation of small molecules (such as GLU), inevitably, their high cost limits their commercial use. In recent years, copper-based nanomaterials have held the researchers' interest strongly due to the abundant reserves, the designable structural model, the ability of ions to conduct at high rates and the good stability [18-20]. Moreover, the porous structure of copper-based nanomaterials have made a facile way for electrolyte permeating and ion transferring, while the controllable material composition is expected to bind to the electroactive sites, providing unlimited possibilities for finding outstanding electrode materials [21-23].
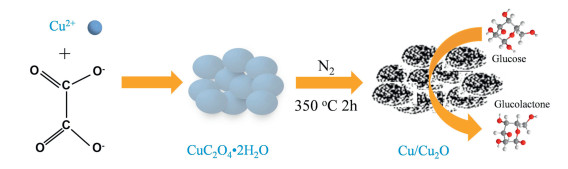
Herein, the porous structure of Cu/Cu2O as an electrocatalysts for GOR is synthesized using the method of calcining the precursor CuC2O4 2H2O in N2 which is prepared by stirring the solution of copper sulfate and sodium oxalate at room temperature in a specific proportion as shown in Scheme 1. Then, the prepared three samples are modified on a glassy carbon electrode (GCE) to be used for catalyzing the GLU. The unique porous nanostructure with 3D assemblies, abundant porosity exposed as many active sites as possible, which are important for efficient electrocatalytic GLU. As a result, the porous nano-structure of Cu/Cu2O (named after T2) exhibits good electrocatalytic activity (such as selectivity, sensitivity) and good stability. In addition, a simple and controllable synthesis method is used to give an example of exploring other metal oxide nanomaterials to achieve more efficient catalytic GLU.

|
Download:
|
| Scheme 1. The brief sketch of synthesizing of Cu/Cu2O composites as catalysts for GLU. | |
Three samples of Cu/Cu2O nanomaterials (T1-T3) were obtained via the method of calcining the precursor CuC2O4 2H2O in N2 with different temperature (300 ℃, 350 ℃, 400 ℃) which was prepared by stirring the solution of copper sulfate and sodium oxalate at room temperature in a specific proportion. The phase purity and crystal structure of the samples were determined by X-ray diffraction (XRD). As shown in Fig. S1 (Supporting information), the obtained precursor is CuC2O4 2H2O, whose crystal structure is consistent with the PDF#21-0297. To optimize the precursor, three samples were obtained by referring to the thermogravimetric (TG) curves in Fig. S2 (Supporting information). Their XRD patterns (Fig. S3 in Supporting information) revealed that they had similar composition which were all Cu/Cu2O complexes. Specifically, there were three distinct peaks at about 35°, 43° and 74°, which can be attributed to the Cu2O (111), (200) and (220). These data indicated that Cu and Cu2O composites were successfully obtained. Then, the morphology and structure of the obtained samples were confirmed by scanning electron microscopy (SEM) and transmission electron microscopy (TEM). The overall morphology of the four samples were consistent, and the surface of the precursor was smooth (Figs. S4a1-a3 in Supporting information). As the calcining temperature increased, clear holes appeared in the samples. Comparing with the other two samples (T1 and T3), the morphology of T2 sample was the most complete and the pores were uniform (Figs. S4c1-c3 in Supporting information). Moreover, more detailed structural characteristics of T2 samples were further explored in Fig. 1. High resolution transmission electron microscope (HRTEM) images in Fig. 1c showed that the interplanar spacings of the sample of T2 were about 0.243 nm and 0.208 nm, which stood for the (111) lattice planes of Cu2O and (111) lattice planes of Cu, respectively. The selected-area electron diffraction (SAED) pattern of the sample T2 in Fig. 1c of inset demonstrated to be a clear crystalline structure. Further, the EDS mapping images in Figs. 1d-g indicated that the elements of Cu, O were uniformly distributed. In a word, the characteristics of such a series of morphology and structure were conducive to the electrochemical performance of the sample T2 for GOR.

|
Download:
|
| Fig. 1. Morphological characterization of T2: (a) SEM; (b) TEM; (c) HRTEM and the SAED pattern (inset); (d-g) EDX elemental mapping images. | |
Further, more detailed information about the chemical composition and the state of the surface electrons of the samples were obtained by using X-ray photoelectron spectroscopy (XPS). In Fig. S5 (Supporting information), XPS survey spectra of the three samples showed that Cu and O were found in all samples. These also confirmed that the chemical components of the three samples were identical. Besides, the peaks near the main peak were located at 941.32 eV, 943.92 eV and 962.30 eV, respectively, which could be attributed to the existence of Cu2+ (Fig. S6 in Supporting information) [24, 25]. The possible reason was that at room temperature, Cu2O was thermodynamically unstable and the surface of the sample was easily oxidized to Cu2+. Moreover, the peak at 569.44 eV corresponded to the electronic state of Cu2O (Fig. S7 in Supporting information) [26]. The O 1s XPS spectrum of three peaks were exhibited in Fig. S8 (Supporting information). The peak at 531.3 eV was caused by the absorbed oxygen. Besides, the peak value of 529.8 eV displayed that oxygen existed in the lattice of Cu2O, while the weak peak of 532.7 eV was due to the presence of CuO on the sample surface. The results were in good agreement with the spectra of Cu 2p XPS in Fig. S6.
The classical three-electrode system was used to conduct related GOR electrochemical tests to verify the different electro-catalytic performance of these target samples. When the precursor was used to test GOR, its performance was not satisfactory (Fig. S9 in Supporting information). Based on this, the latter tests were mainly the samples after calcination of the precursor. Cyclic voltammetry (CV) was used to detect GOR signal response intuitively and activate the material effectively for subsequent testing. As shown in Fig. 2a, the concentration of GLU in 0.1 mol/L NaOH solution increased gradually from 1 μmol/L to 1000 μmol/L, and the response signal of current increased gradually, indicating that T2/GCE can availably catalyze the GOR.

|
Download:
|
| Fig. 2. (a) CV curves of T2/GCE electrode at 0.1 mol/L NaOH with sequential increase of GLU concentration. (b) The i-t curves of the electrode T2/GCE at four potentials (0.4 V, 0.45 V, 0.5 V and 0.55 V). (c) The i-t curves of GLU continuously injected into the three samples (T1/GCE, T2/GCE and T3/GCE) in 0.1 mol/L NaOH at 0.5 V respectively. (d) Calibration i-c curves corresponding to the responses of three samples in Fig. 2c. | |
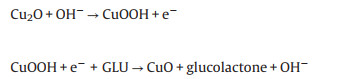
By comparison, T1/GCE and T3/GCE exhibited the matching current signal response in Figs. S10 and S11 (Supporting information), but not as strong as the current signal of T2/GCE. The redox peaks occurred in the range of 0.35 V to 0.65 V, which indicated that the electrocatalytic process was mainly centered on Cu. The increase of anode current was owing to the Cu(I) participating in the electrooxidation of GLU. As an electrocatalyst, Cu/Cu2O took part in the whole reaction process and can be carried out in two steps: Cu(I) was oxidized to CuOOH under alkaline conditions, and then the composite products obtained were used as catalysts for electrooxidation of glucose to glucolactone.
|
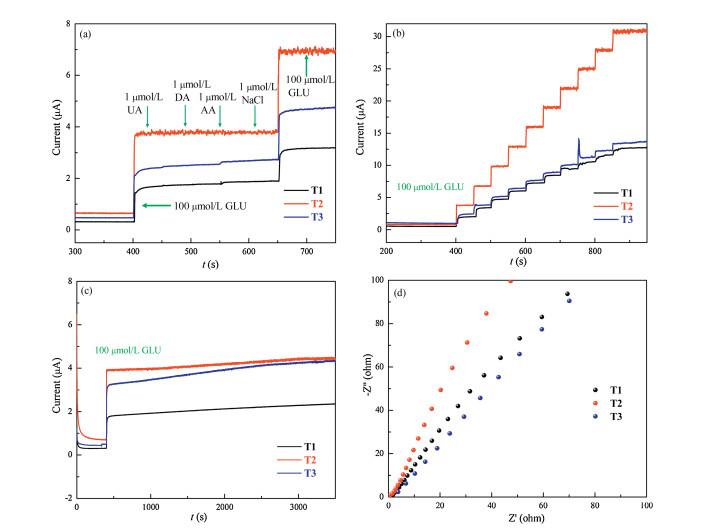
In Fig. 2b, the current-time (i-t) response of T2/GCE at four selected voltages (0.4, 0.45, 0.5 and 0.55 V) was measured by adding 100 μmol/L GLU to 0.1 mol/L NaOH solution to determine the optimal voltage of GOR in this system. The results showed that the current response was strong and stable at 0.5 V voltage. If the voltage was too high or too low, the current response was either unstable or not sensitive, which was not the ideal choice. Then, an indicator of the catalytic performance of the reaction material was tested. Fig. 2c shows the i-t curves of the response of the samples T1/GCE, T2/GCE and T3/GCE with a certain amount of GLU continuously added in 0.1 mol/L NaOH at 0.5 V. In detail, when GLU was injected into the bottom liquid with sufficient stirring in the test, the results manifested that the current signals of the three samples increased gradually, while the T2/GCE signal increased most obviously. This might be due to the integrity of T2 morphology and the homogeneity of pore, which could provide GOR with abundant active sites, especially in high concentration GLU, the current response signals of the other two samples were almost unchanged. Correspondingly, the calibration i-c curves of the three target objects (Cu/Cu2O/GCE) were depicted in Fig. 2d, which revealed three linear response from 0.5 mmol/L to 8065.5 mmol/L. The results proved that T2/GCE had good linear relationship, wide concentration range and good sensitivity, while T1/GCE and T3/GCE had poor linearity and poor catalytic performance. In detail, within this concentration range, the linear equations of the three samples can be summarized: (T1) I(μA) = 1.16 + 7.06×10⁻³CGLU (μmol/L), R= 0.9856 (0- 3500 μmol 3500 μmol/L), with the sensitivity of 99.93 μAL mmol-1 cm-2 and I(μA)= 16.92 + 2.06 × 10⁻³CGLu (μmol/L), R= 0.996 (3500- 8065.5 μumol/L, and the sensitivity was 29.16 μA L mmol-1 cm-2); (T2) I(μA)= 3.3168 + 2.158 × 10⁻²CGlu (μmol/L) (R= 0.9834, 305.4 μAL mmol-1 cm-2); (T3) I(μA)= 1.92+ 1.32 × 10⁻²CGlu (μmol/L), R = 0.9829 (0-3500 μmol/L), with the sensitivity of 186.8 μAL mmolr-1cm-2 and I(μA)=40.46+ 8.713 × 10⁻⁴CGLu(μmol/L), R= 0.927 (3500-8065.5 μmol/L, the sensitivity was 12.33 μAL mmol-1 cm-2). Diffusion rate was one of the indices for evaluating the electrocatalytic process. The two linear ranges of T1/GCE and T3/GCE may be due to the uneven diffusion rate of the reaction products at different GLU concentrations. When the concentration of glucose was low, the product will diffuse rapid and the reaction can continue smoothly. However, at high concentrations of glucose, the products accumulated around the electrodes. Moreover, compared with previous reports, the catalytic performance of this material as a catalyst for GLU is shown in Table S1 (Supporting information). The comparison results further showed that the materials synthesized in this work were promising electrocatalysts for the catalysis of GLU.
Several other parameters (such as anti-interference, repeatability and stability) can be used to evaluate the catalysis of materials. As shown in Fig. 3a, several common interferants were injected into the system to detect whether they interfered with GOR. The results clearly revealed that the current responses of the three samples were almost unchanged after injection of 1 μmol/L uric acid (UA), 1 μmol/L dopamine (DA), 1 μmol/L ascorbic acid (AA), 1 μmol/L NaCl, and then 100 μmol/L GLU into the 100 mmol/L GLU system respectively, and the three samples showed good anti-interference performance. The only difference was that the current response of T2/GCE was generally stronger and better stability. Then, repeatable experiments were carried out to evaluate the reliability of the samples. T2/GCE possessed the best repeatability among the three samples in Fig. 3b. In the stability test (Fig. 3c), the stability of the three samples in 0.1 mol/L NaOH with 100 μmol/L GLU solution was good after 3500 s of testing, and there was almost no obvious loss. Besides, the morphologies of the sample T2 were further studied by the SEM and TEM after the durability test in 0.1 mol/L NaOH with 0.05 mol/L GLU solution for 2, 4 and 6 h (Fig. S13 in Supporting information). These images confirmed that the porous morphology of sample T2 still remained good during different test times. In electrochemical test time, some morphological collapses were found owing to the etching alkaline solution. The electrochemical impedance spectroscopy (EIS) experiment can well account for the electron transfer ability of the samples. Tested in 0.1 mol/L NaOH at 0.5 V, it was found that T2/GCE performed best, followed by T1/GCE, and T3/GCE at worst (Fig. 3d and Fig. S12 in Supporting information). Besides, the electrochemical surface area (ECSA) can be effectively characterized by electrochemical double-layer capacitance (Cdl). After the test and calculation (Fig. S14 in Supporting information), the ECSA of the T1, T2 and T3 were 0.446 μF/cm2, 1.34 mF/cm2 and 0.847 μF/cm2 respectively. These facts suggested that the good activity of T2/GCE in GOR reaction could be attributed to the high ECSA value and inherent porosity. Make a brief summary. The material obtained in the experiment, especially the sample T2, had excellent catalytic performance when used as an electrocatalyst in GOR. The inherent porous Cu/ Cu2O composites brought a series of potential in GOR. The reasons can be summarized as follows: (i) The high GOR activity of the porous Cu/Cu2O composites may result from the various active sites, which contributed to a higher extent of exposure of the edge sites. Owing to the porosity of the Cu/Cu2O composites, the effect of the charge transfer induced more active sites of the Cu/Cu2O to be exposed, hence improving the reactivity of GOR as a whole. (ii) The higher the probability of collision between reactants, the better the chemical reaction will be. This porous structure was more conducive to the transport and collision between particles. (iii) There were strong synergistic effects between the porous Cu2O and Cu. It was noteworthy that Cu nanoparticles improved the electrical conductivity of the materials and thus advanced the activity of the whole catalytic reaction. Moreover, Cu2O could be used as a stabilizer of Cu nanoparticles and played a coordinating role in composite materials. In conclusion, the above experimental results fully indicated that porous Cu/Cu2O composites could be used as an efficient and stable catalyst in GOR.

|
Download:
|
| Fig. 3. (a) The current response curves of three samples in the presence of common interfering substances. (b) The current response curves of the three samples after injection of 100 μmol/L GLU 10 times into the solution of 0.1 mol/L NaOH at 0.5 V respectively. (c) The stability of the three target electrodes at 0.5 V in 0.1 mol/L NaOH. (d) The EIS response of the three target electrodes (T1/GCE, T2/GCE and T3/GCE) in 0.1 mol/L NaOH at 0.5 V. | |
In summary, a three-dimensional porous Cu/Cu2O nanomaterial was successfully prepared by calcining the precursor CuC2O4 2H2O, and its electrochemical performance for catalyzing GLU in 0.1 mol/L NaOH was greatly advanced. The porous nanomaterial Cu/Cu2O assemblies proved prominent catalytic activity, high sensitivity (305.4 mA L mmol -1 cm-2) with a wide linear calibration range (0.5-8065.5 μmol/L) and outstanding stability performance with a low detection limit (0.35 mmol/L, S/N = 3). It is expected that this work can offer the possibility for developing various metal oxides with compositional and structural diversity, which can encourage more catalytic applications for GOR.
Declaration of competing interestThe authors declare no competing financial interest.
AcknowledgmentsThis work was supported by the National Natural Science Foundation of China (NSFC, Nos. 21671170, 21673203 and 21201010), the Top-notch Academic Programs Project of Jiangsu Higher Education Institutions (TAPP), Program for Academic Science and Technology Innovation Fund for College Students of Guangling College in Yangzhou University (No. YJ20180501), the Six Talent Plan (No. 2015-XCL-030), Qinglan Project of Jiangsu and Program for Colleges Natural Science Research in Jiangsu Province (No. 18KJB150036) as well as the Science and Technology Innovation Foster Foundation of Yangzhou University (No. 2016CXJ010). We also acknowledge the Priority Academic Program Development of Jiangsu Higher Education Institutions and the technical support we received at the Testing Center of Yangzhou University.
Appendix A. Supplementary dataSupplementary material related to this article can be found, in the online version, at doi:https://doi.org/10.1016/j.cclet.2019.12.034.
| [1] |
Y. Hao, Y. Xu, W. Liu, X. Sun, Mater. Horizons 5 (2018) 108-115. DOI:10.1039/C7MH00706J |
| [2] |
X. Lan, N. Huang, J. Wang, T. Wang, Chem. Commun. 54 (2018) 584-587. DOI:10.1039/C7CC08244D |
| [3] |
D.H. Nam, O.S. Bushuyev, J. Li, et al., J. Am. Chem. Soc. 140 (2018) 11378-11386. DOI:10.1021/jacs.8b06407 |
| [4] |
C.S. Liu, Z.H. Zhang, M. Chen, et al., Chem. Commun. 53 (2017) 3941-3944. DOI:10.1039/C7CC00029D |
| [5] |
X. Li, J. Wei, Q. Li, et al., Adv. Funct. Mater. 28 (2018) 1800886. DOI:10.1002/adfm.201800886 |
| [6] |
B. Li, B.M. Zheng, G.H. Xue, H. Pang, Inorg. Chem. Front. 3 (2016) 175-202. DOI:10.1039/C5QI00187K |
| [7] |
J. Yang, F. Zhang, H. Lu, et al., Angew. Chem. Int. Ed. 54 (2015) 10889-10893. DOI:10.1002/anie.201504242 |
| [8] |
D.M. Chen, J.Y. Tian, Z.W. Wang, et al., Chem. Commun. 53 (2017) 10668-10671. DOI:10.1039/C7CC06073D |
| [9] |
Y. Xu, B. Li, S. Zheng, et al., J. Mater. Chem. A (2018) 22070-22076. |
| [10] |
B.M. Zheng, L.L. Li, P. Gu, et al., Microchim. Acta 184 (2017) 943-949. DOI:10.1007/s00604-017-2079-5 |
| [11] |
Y. Sun, Y. Li, N. Wang, et al., Electroanalysis 30 (2018) 474-478. DOI:10.1002/elan.201700629 |
| [12] |
N. Li, Q. Li, M. Yuan, et al., Chem. Asian J. 14 (2019) 2259-2265. DOI:10.1002/asia.201900361 |
| [13] |
T. Adachi, S. Tsujimura, Electrochim. Acta 313 (2019) 189-193. DOI:10.1016/j.electacta.2019.04.145 |
| [14] |
C. Lu, Z. Li, L. Ren, et al., Sensors 19 (2019) 2926. DOI:10.3390/s19132926 |
| [15] |
A. Khoobi, M. Salavati-Niasari, Energy 178 (2019) 50-56. DOI:10.1016/j.energy.2019.04.143 |
| [16] |
J. Hao, C. Li, C. Wu, K. Wu, Carbon 148 (2019) 44-51. DOI:10.1016/j.carbon.2019.03.048 |
| [17] |
Y. Zhuge, G. Fan, Y. Lin, L. Yang, F. Li, Dalton Trans. 48 (2019) 9161-9172. DOI:10.1039/C9DT00985J |
| [18] |
D. Zhu, C. Xia, Z. Yang, et al., Mater. Lett. 245 (2019) 49-52. DOI:10.1016/j.matlet.2019.02.095 |
| [19] |
L. Li, Y. Liu, L. Ai, J. Jiang, J. Ind. Eng. Chem. 70 (2019) 330-337. DOI:10.1016/j.jiec.2018.10.033 |
| [20] |
D. Shi, R. Zheng, M.J. Sun, et al., Angew. Chem. Int. Ed. 56 (2017) 14637-14641. DOI:10.1002/anie.201709869 |
| [21] |
G. Liu, X. Li, Z. Yu, et al., J. Phys. Chem. Solids 123 (2018) 344-354. DOI:10.1016/j.jpcs.2018.08.025 |
| [22] |
G. Zang, W. Hao, X. Li, et al., Electrochim. Acta 277 (2018) 176-184. DOI:10.1016/j.electacta.2018.05.016 |
| [23] |
W. Xu, J. Lu, W. Huo, et al., Nanoscale 10 (2018) 14304-14313. DOI:10.1039/C8NR04519D |
| [24] |
M. Zhang, C. Wang, C. Liu, et al., J. Mater. Chem. A 6 (2018) 11226-11235. DOI:10.1039/C8TA03565B |
| [25] |
Z. Ai, L. Zhang, S. Lee, W. Ho, J. Phys. Chem. C 113 (2009) 20896-20902. DOI:10.1021/jp9083647 |
| [26] |
L. Martin, H. Martinez, D. Poinot, B. Pecquenard, F. Le Cras, J. Phys. Chem. C 117 (2013) 4421-4443. DOI:10.1021/jp3119633 |