 2020, Vol. 31


b Beijing Engineering Research Center for BioNanotechnology and CAS Key Laboratory for Biomedical Effects of Nanomaterials and Nanosafety, CAS Center for Excellence in Nanoscience, National Center for NanoScience and Technology, Beijing 100190, China;
c Department of Biomedical Engineering, Southern University of Science and Technology, Shenzhen 518055, China;
d University of Chinese Academy of Sciences, Beijing 100049, China;
e College of Food Science and Technology, Huazhong Agricultural University, Wuhan 430070, China
In recent years, vicious incidents of food safety have occurred repetitively, and food safety has become a critical issue. Thus, rapid, sensitive and low-cost detection methods have attracted much attention. Microfluidic chips have shown great prospects in biochemical analysis [1-3]. β-Adrenergic agonists are mainly used to treat bronchial asthma and promote growth of animals [4]. Clenbuterol (CLB) and ractopamine (RAC) are well known β- adrenergic agonists [5]. Because of large dose and long half-life time, β-adrenergic agonists are easy to accumulate in animal tissues [6]. Long-term exposure of residual agonists in visceral tissues and muscles causes poisoning with symptoms of dizziness, chest tightness, palpitations, limb numbness and so on [7, 8]. To ensure food safety, these β-adrenergic agonists have been banned in China, as well as the European Union and Russia [9, 10]. Nowadays, the most widely used instrumental analysis methods for quantitative detection of β-adrenergic agonists are chromatography-based methods, such as high-performance liquid chromatography (HPLC) [11], gas chromatography-mass spectrometry (GC–MS) [12] and liquid chromatography-mass spectrometry (LC– MS) [13, 14], which are used to detect the residues of β-adrenergic agonists in urine, animal tissues and feed. These methods have the advantages of high sensitivity, good accuracy and reproducibility. However, before chromatographic analysis, the samples need be purified through solid-phase extraction or liquid-liquid extraction. Moreover, these expensive instruments are not suitable for the mass screening, where large number of samples need to be examined within a short time-frame [15]. In addition, various techniques, such as fluorescent method [16-18], colorimetric method [19, 20], electrochemical method [21, 22], and electrochemiluminescent method [23, 24], are now available for the determination of trace residue of β-adrenergic agonists. Notably, most of them rely on high-tech instrumentations and professionals. These factors have become main obstacles to broad usage of these methods. Thus, a portable, easy-to-operate and low-cost method for veterinary drug residue detection is urgently needed, especially in resource-limited areas.
In our previous work, we use a variety of microfluidic immunoassays for multiplexed analysis [25-28]. Instruments customized for microfluidic systems can achieve automated detection and data analysis. Herein, we propose a microfluidics-based indirect competitive immunoassay (MICI) system to detect CLB and RAC in real samples simultaneously. The limit of detection (LOD), linear detection range, specificity and recovery rate of MICI are systemically evaluated. The MICI system fully meets the requirements of the national residue detection standards and it is inexpensive and easy to operate. This microfluidic immunoassay system is quite suitable for multiplex detection of veterinary drug residues.
Information about the materials, reagents, apparatus, the microfluidic chip fabrication, analytical procedure and specificity evaluation, as well as sample pretreatment, is included in Supporting information.
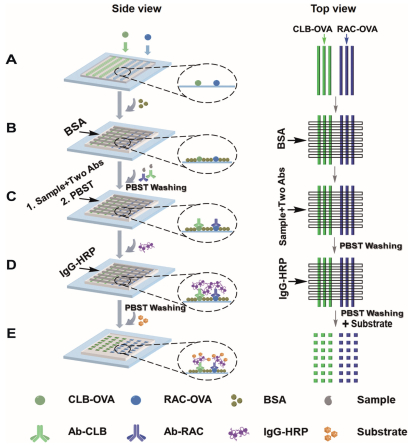
The process of simultaneous detection of CLB and RAC includes 5 steps: 1) Immobilization of two kinds of antigen-ovalbumin conjugates (Ag-OVAs) (Fig. 1A). 2) 3% BSA is used to block the surface (Fig. 1B). 3) Competitive immune responses. The introduced targets in sample compete with the previously immobilized Ag-OVAs for the binding site of the antibody (Fig. 1C). 4) The IgGHRP is introduced to react with the antibody (Fig. 1D). 5) Signal generation and readout. After introducing chemiluminescent (CL) substrate, HRP catalyze the reaction between H2O2 and luminol to produce CL signals (Fig. 1E). In this MICI system, the microfluidic technology greatly reduces the consumption of reagents, shortens the reaction time compared to traditional microplate methods, and enables high-throughput, multi-sample simultaneous detection, while sensitivity still can meet the needs for detection of CLB and RAC.

|
Download:
|
| Fig. 1. Scheme of MICI for detection of CLB and RAC. (A) CLB-OVA and RAC-OVA are introduced into the microchannels and immobilized on the PDMS substrates. (B) 3% BSA is used for blocking longitudinally. (C) The targets in sample compete with the coated antigens for the antibody binding sites. (D) Introduction of the second antibodies IgG-HRP. (E) CL substrate is introduced to obtain CL image by the instrument. | |
We optimize the coating time of the Ag-OVAs. When the coating time is 15 min, the change of ΔCL intensity tends to be stable (Fig. S2B in Supporting information). We optimize the incubation time of the unlabeled antibody. When the incubation time reaches 45 min, the changes of ΔCL intensity are maximized (Fig. S2C in Supporting information). We optimize the incubation time of IgGHRP. When the incubation time reaches 30 min, the ΔCL signal does not change any more (Fig. S2D in Supporting information).
We next investigate the influence of exposure time on the CL signals. When the exposure time is 60 s, the ΔCL intensity of negative samples is close to the maximum value set by the instrument (Figs. S3A and S3B in Supporting information). In order to explore the optimal coating concentrations of clenbuterolovalbumin (CLB-OVA) and ractopamine-ovalbumin (RAC-OVA), we coat Ag-OVAs with different concentrations (5, 10, 20 μg/mL) on the substrate. The CL signal reaches a stable value when the coating concentration is 10 μg/mL (Figs. S4A and S4B in Supporting information). We optimize the concentrations of Ab-CLB and AbRAC. In order to maximize the range of the standard curve and meet the sensitivity requirements, we determine that Ab-CLB with a concentration of 264 μg/mL and Ab-RAC with a concentration of 100 μg/mL are the best choice (Figs. S4C, S4D and S5 in Supporting information). We optimize the concentrations of IgG-HRP and find that the reaction reaches saturation when the concentration of IgG-HRP is 1 μg/mL (Figs. S4E and S4F in Supporting information).
For CLB detection, a calibration curve between ΔCL intensity and the concentration of CLB is obtained with CLB concentration ranging from 100 pg/mL to 2, 500 pg/mL (Figs. 2A and B). For RAC detection, a linear relationship between ΔCL intensity and the concentration of RAC is found for RAC ranging from 100 pg/mL to 5, 000 pg/mL (Figs. 2C and D). The LODs are defined as the concentrations which are equivalent to 10% inhibition concentration (IC10). The LODs of CLB and RAC determined by MICI are 94 pg/mL and 91 pg/mL.

|
Download:
|
| Fig. 2. Calibration curves for the detection of CLB and RAC. (A) The CL image for detection of CLB from 100 pg/mL to 2, 500 pg/mL. (B) Linear range for detection of CLB. (C) The CL signal for detection of RAC range from 100 pg/mL to 5, 000 pg/mL. (D) Linear range for detection of RAC. The error bars represent the standard deviation of six repeats. | |
The specificity among the Ag-OVAs and their antibodies is evaluated by cross-reactivities (CRs) of Ag-OVAs and antibodies. Apart from CR of the corresponding Ag-OVA and antibody at 100%, the other CRs are calculated using the ratio of ΔCL intensity between the two hybridization signals. For example, CR between CLB-OVA and Ab-RAC is calculated by using Eq. 1.

|
(1) |
As shown in Fig. S6A (Supporting information), the CRs are lower than 5% by the calculation, suggesting high specificity of the interaction between the Ag-OVAs and their corresponding antibodies. We evaluate the CRs of antibodies with hapten analogues. As shown in Fig. S6B (Supporting information), only the CLB-spiked PBS solution causes a significant decrease in ΔCL intensity. Similarly, only the RAC-spiked PBS solution results a significant decrease in the ΔCL intensity according to Fig. S6C (Supporting information).
The CRs are calculated by comparing the half maximal inhibitory concentration (IC50) of CLB to those of β-adrenergic agonists in MICI by using Eq. 2.

|
(2) |
The data of CRs (Table S3 in Supporting information) further verifies the specificity of the antibody. We can conclude that the specificity of the as-prepared immunoassay system is acceptable and CLB and RAC can be detected simultaneously with this MICI system. We compare the differences of ΔCL intensity and standard calibration curve by introducing only CLB and Ab-CLB or simultaneously introducing two targets and two antibodies (Figs. S7A–C in Supporting information). The results are the same by introducing only Ab-CLB and simultaneously introducing AbCLB and Ab-RAC. We also compare the differences of ΔCL intensity and standard calibration curve by introducing only RAC and AbRAC or simultaneously introducing two targets and two antibodies (Figs. S7D–F in Supporting information). It produces consistent results by introducing only Ab-RAC and simultaneously introducing Ab-RAC and Ab-CLB.
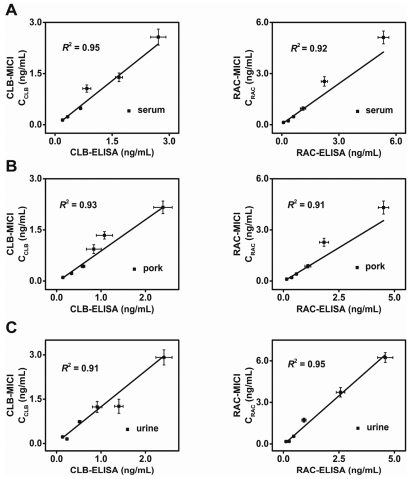
In order to examine the practicability of this system in real samples, the developed MICI is applied in the CLB and RAC detection in negative pork, swine blood and swine urine samples. As shown in Tables S4 and S5 (Supporting information), recovery rates are in the range of 81.2%–108.8%, and the relative standard deviations (RSDs) are all below 15% (six repeated tests are performed in the same experiment), which confirms that the system has excellent accuracy and satisfactory repeatability in real samples. The comparison between MICI and ELISA kits for quantification of both CLB and RAC shows a good agreement (Figs. 3A–C), suggesting that the developed MICI is reliable for the multiple detections of CLB and RAC. So, the developed MICI offers a potential alternative analytical method for the monitoring of CLB and RAC residues in food safety.

|
Download:
|
| Fig. 3. Comparison of MICI system with commercial ELISA kits for quantitative detection. (A), (B) and (C) present the comparison of ELISA kits with MICI for detection of CLB and RAC in swine serum, pork and swine urine, respectively. Error bars represent the standard deviations of six repeats. | |
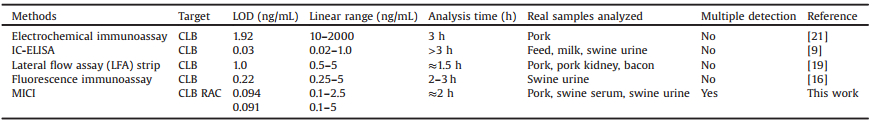
We also compare the sensitivity, detection range, analysis time and simultaneous detection with other common detection platforms (Table 1). Our platform is sensitive, fast and has the ability of multiple detection, which is quite suitable for rapid detection of veterinary drug residues.
|
|
Table 1 The comparison of the analytical performance of MICI with other platforms for detection of CLB and RAC. |
In summary, a microfluidics-based indirect competitive immunoassay (MICI) system has been proposed. This method provides a straightforward assay for simultaneous and sensitive detection of CLB and RAC. The results indicate that the system has high stability, sensitivity, acceptable selectivity under optimized experimental conditions. In addition, the portable system is not only easy to operate but also cost effective. Urine, blood and urine samples can be analyzed on site and in real time. These results indicate that the portable microfluidic system is suitable for widespread monitoring of β-adrenergic agonists in pork product, swine blood and swine urine. Moreover, the developed MICI system is easily extended to other analytes by simple replacement of the corresponding antibody, showing great potential as a universal platform for sensitive, high-throughput and specific detection of pollutants in foods.
Declaration of competing interestThe authors declare no conflicts of interest.
AcknowledgmentsWe thank the National Key R & D Program of China (Nos. 2018YFA0902600, 2017YFA0205901), the National Natural Science Foundation of China (Nos. 21535001, 81730051, 21761142006) and the Chinese Academy of Sciences (Nos. QYZDJ-SSW-SLH039, 121D11KYSB20170026, XDA16020902) for financial support.
Appendix A. Supplementary dataSupplementary material related to this article can be found, in the online version, at doi:https://doi.org/10.1016/j.cclet.2020.01.028.
| [1] |
M.S. Jie, S.F. Mao, H.F. Li, et al., Chin. Chem. Lett. 28 (2017) 1625-1630. DOI:10.1016/j.cclet.2017.05.024 |
| [2] |
B.B. Yang, D.M. Liu, L.N. Zhu, et al., Chin. Chem. Lett. 29 (2018) 1879-1882. DOI:10.1016/j.cclet.2018.01.042 |
| [3] |
Y.L. Xianyu, J. Wu, Y.P. Chen, et al., Angew. Chem. Int. Ed. 57 (2018) 7503-7507. DOI:10.1002/anie.201801815 |
| [4] |
S.H. Yu, Z.G. Liu, J.P. Zhang, et al., RSC Adv. 8 (2018) 5536-5541. DOI:10.1039/C7RA12927K |
| [5] |
J. Kong, L. Jiang, X.O. Su, et al., Lab. Chip 9 (2009) 1541-1547. DOI:10.1039/b818430e |
| [6] |
M. Turson, X.L. Zhuang, H.N. Liu, et al., Chin. Chem. Lett. 20 (2009) 1136-1140. DOI:10.1016/j.cclet.2009.04.012 |
| [7] |
J. Cheng, S. Wang, S. Zhang, et al., Sens. Actuators B 279 (2019) 7-14. DOI:10.1016/j.snb.2018.09.103 |
| [8] |
B.L. Dong, S.J. Zhao, H.F. Li, et al., Food Chem. 271 (2019) 9-17. DOI:10.1016/j.foodchem.2018.07.147 |
| [9] |
Q. Huang, T. Bu, W.T. Zhang, et al., Food Chem. 262 (2018) 48-55. DOI:10.1016/j.foodchem.2018.04.085 |
| [10] |
L. Ma, A. Nilghaz, J.R. Choi, et al., Food Chem. 246 (2018) 437-441. DOI:10.1016/j.foodchem.2017.12.022 |
| [11] |
K.P. Yan, H.Q. Zhang, W.L. Hui, et al., J. Food Drug Anal. 24 (2016) 277-283. DOI:10.1016/j.jfda.2015.12.002 |
| [12] |
H.B. Liu, D. Ousmane, N. Gan, et al., Chromatographia 80 (2017) 473-482. DOI:10.1007/s10337-017-3242-1 |
| [13] |
L. Giannetti, G. Ferretti, V. Gallo, et al., J. Chromatogr. B 1036- 1037 (2016) 76-83. |
| [14] |
Y.P. Wu, Y.F. Bi, G. Bingga, et al., J. Chromatogr. A 1400 (2015) 74-81. DOI:10.1016/j.chroma.2015.04.050 |
| [15] |
D.P. Peng, W. Wei, Y.H. Pan, et al., J. Pharm. Biomed. Anal. 133 (2017) 56-63. DOI:10.1016/j.jpba.2016.11.009 |
| [16] |
Z. Huang, Z.J. Xiong, Y. Chen, et al., J. Agric. Food Chem. 67 (2019) 3028-3036. DOI:10.1021/acs.jafc.8b06449 |
| [17] |
T. Peng, J.Y. Wang, S.J. Zhao, et al., Anal. Chim. Acta 1040 (2018) 143-149. DOI:10.1016/j.aca.2018.08.014 |
| [18] |
T. Simon, M. Shellaiah, P. Steffi, et al., Anal. Chim. Acta 1023 (2018) 96-104. DOI:10.1016/j.aca.2018.03.022 |
| [19] |
B.X. Zhao, Q. Huang, L.N. Dou, et al., Sens. Actuators B 275 (2018) 223-229. DOI:10.1016/j.snb.2018.08.029 |
| [20] |
C.J. Zhu, G.Y. Zhao, W.C. Dou, Sens. Actuators B 266 (2018) 392-399. DOI:10.1016/j.snb.2018.03.085 |
| [21] |
Y.Y. Yang, H. Zhang, C.S. Huang, et al., Biosens. Bioelectron. 89 (2017) 461-467. DOI:10.1016/j.bios.2016.04.019 |
| [22] |
L.H. Zhang, Q.W. Wang, Y. Qi, et al., Sens. Actuators B 288 (2019) 347-355. DOI:10.1016/j.snb.2019.03.033 |
| [23] |
Z.Y. Li, Y.H. Wang, W.J. Kong, et al., Biosens. Bioelectron. 39 (2013) 311-314. DOI:10.1016/j.bios.2012.07.007 |
| [24] |
Q. Zhu, H.X. Liu, J. Zhang, et al., Sens. Actuators B 243 (2017) 121-129. DOI:10.1016/j.snb.2016.11.135 |
| [25] |
F. Fan, H.Y. Shen, G.J. Zhang, et al., Clin. Chim. Acta 431 (2014) 113-117. DOI:10.1016/j.cca.2014.02.003 |
| [26] |
B.F. Hu, J.J. Li, L. Mou, et al., Lab Chip 17 (2017) 2225-2234. DOI:10.1039/C7LC00249A |
| [27] |
J. Wu, Y.P. Chen, M.Z. Yang, et al., Anal. Chim. Acta 982 (2017) 138-147. DOI:10.1016/j.aca.2017.05.031 |
| [28] |
W.B. Yu, Y.P. Chen, M. Knauer, et al., Food Anal. Methods 9 (2016) 3163-3169. DOI:10.1007/s12161-016-0508-4 |