 2020, Vol. 31


b CAS Key Laboratory of Magnetic Resonance in Biological Systems, State Key Laboratory of Magnetic Resonance and Atomic and Molecular Physics, Wuhan Institute of Physics and Mathematics, University of Chinese Academy of Sciences, Wuhan 430071, China;
c Singapore Phenome Center, Lee Kong Chian School of Medicine, School of Biological Sciences, Nanyang Technological University, Singapore 636921, Singapore
Metabonomic analysis is now well accepted as a powerful approach for discovery of metabolic phenotypic variations resulting from both genetic and environmental factors [1,2]. Successful applications of metabonomics have already been reported in understanding disease pathogenesis and progression [3,4], developmental biochemistry of model systems [5-7], nutritional and toxicological effects on the biochemical processes in mammals and plants [8-10]. To obtain reliable conclusions from such metabonomic analyses, robust normalization of data acquired from both nuclear magnetic resonance spectroscopy (NMR) and mass spectrometry (MS) is a prerequisite to remove or minimize the inevitable but unwanted sampling variations [1]. One of routinely used methods is normalization-to-total spectral integrals (NTSI), where each variable is normalized to the sum of spectral areas of all variables. However, this method fails to work properly when treatments induce drastic changes in some limited metabolites [11], which is commonly present. For example, the levels of plasma lipids for the high-fat diet (HFD) fed animals can be several folds higher than those in controls [12,13]; fasting blood glucose level in the diabetic model can reach five times as high as that in the corresponding controls [14]; urinary glucose level in diabetic cases can be three orders of magnitude higher than that in the healthy controls [14]. Such drastic changes in the levels of metabolites also occur commonly in plants under both biotic and abiotic stresses [15].
Furthermore, the widely performed urinary metabonomic analysis often employs spot urine samples, which inevitably encounters some uncertainties from the dilution effects of drinking water. Under these circumstances, NTSI method will fail miserably and a probabilistic quotient normalization (PQN) method has been proposed as an elegant alternative; such PQN can eliminate the dilution effects by using the probabilistic quotients calculated from all variables as a normalization factor [16]. However, we found that this PQN method denoted as conventional PQN (cPQN) here also failed to solve the normalization problem in our blood-plasma metabonomic analysis of HFDinduced obesity model and urinary metabonomic analysis of diabetic model where more than 50% variables underwent drastic changes [13,14].
To deal with such problems, we developed a PQN approach based on the mode-of-quotients (mPQN) and validated with the metabonomic analyses of the HFD-induced obesity plasma samples and urinary samples from a human cohort studies.
Since cPQN method could not meet the demands of our studies where drastic level changes of some metabolites occurred, we systematically investigated performance of the classical methods and probabilistic quotient normalization [16] based on the median, mean and mode of quotients, respectively, using both simulated and real metabonomic data from two independent studies. We generated multiple simulated datasets containing 200 variables with some of them changed in their levels to represent cases having treatment-induced drastic changes including both elevation and decline as in real cases. For this purpose, 1H NMR spectra of 15 human urine samples from 15 healthy volunteers were bucketed into 201 variables to create a reference dataset (or reference spectrum) from the median of all these variables with one as house-keeping variable in the same fashion reported previously [16]. Six simulated datasets were generated as described in Supporting information to represent six possible cases of variable changes (i.e., metabonomic changes). Amongst these, the first four datasets (1–4) were generated in exactly the same way as reported previously [16]. We further generated two extra datasets to represent more complex possibilities which were not considered in the previous study [16] but commonly encountered in metabonomics studies. Such six datasets have a much more comprehensive representation than what reported previously [16] hence stand for a more challenging test for the method robustness.
Three different PQN treatments were conducted as reported previously [16] to obtain the optimal normalization factor (NF). Such NF was generated in a manner similar to what reported previously [16]. In brief, all variables were first normalized to the total spectral integrals to create a reference spectrum using the median of each variable. The quotients for all variables were then obtained by dividing the level of each variable in the simulated datasets with the corresponding variables in the reference spectrum. The median, mean and mode of such quotients (from all variables) were employed as normalization factors, respectively. Subsequently, all normalized variables from the first step were divided by these normalization factors, respectively, to yield three normalized datasets. Amongst these, cPQN used the median of quotients [16] whereas our mPQN employed the mode of the quotients; the mean of quotients (aPQN) was also tested here similarly. As previously reported [16], recoveries were calculated for the aforementioned house-keeping variable to assess the robustness of four different normalization methods, namely, normalization to the-total-spectral integrals (NTSI), cPQN, aPQN and mPQN. In theory, therefore, a perfect normalization method is expected to have a value of 1.0 for such recovery.
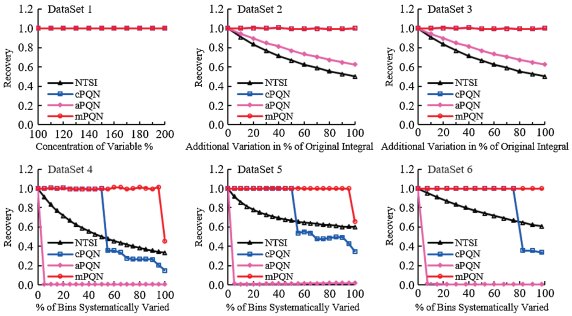
Results clearly showed that the widely used NTSI and aPQN were only suitable for removing just dilution effects but not suitable for cases represented by datasets 2–6 (Fig. 1). The cPQN was only robust enough for the cases represented by the first three datasets (1–3), being consistent with the previous report [16]. However, cPQN method failed obviously in the more challenging cases represented by the datasets 4, 5 and 6 even though these cases are widely present such as HFD-induced metabonomic changes in blood plasma and diabetes-associated urinary metabonomic changes [13,14]. In contrast, our proposed mPQN performed robustly not only for dataset 1–3 but also for highly challenging cases represented by datasets 4–6 (Fig. 1). Our results, therefore, have demonstrated that this newly proposed mPQN method is robust and a suitable choice of normalization method for future metabonomics studies.

|
Download:
|
| Fig. 1. Robustness of different normalization methods including NTSI, cPQN, aPQN and mPQN. An optimal normalization method ought to yield a recovery of 1. The first dataset represented a dilution/concentrating case; the second dataset represented a case with drastic elevation of a single variable; the third dataset represented a case with the combination of variations in the first and second dataset; the fourth dataset represented a case with drastic elevation of multiple variables; the fifth dataset represented a case with the combination of variations in the first and fourth dataset. The sixth dataset represented a case with drastic variations of multiple variables with elevation of the two-thirds variables and level declines for the rest one-third variables. | |
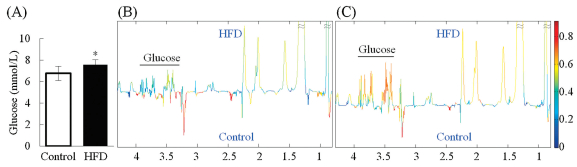
We used NMR-based metabonomic data to validate the suitability of mPQN. The data used here were from our previous obesity study representing a typical case of treatment-induced comprehensive metabonomic changes [13]. In the study, clinical serum chemistry results [13] showed that HFD feeding for 12 weeks caused significant elevation in the level of blood glucose (Fig. 2A, controls: 6.76 ± 0.66 mmol/L; HFD group: 7.58 ± 0.46 mmol/L; P = 0.002). Orthogonal partial least squarediscrimination analysis (OPLS-DA) widely used in metabonomics studies is expected to give consistent conclusion with clinical chemistry if a normalization method is robust. However, with cPQN treatment, the loadings plots from OPLS-DA results showed no significant level differences for glucose (P = 0.16) between control and HFD groups (Fig. 2B). In contrast, the results using our mPQN showed that HFD group had significantly higher blood glucose level (P = 0.014) than control group (Fig. 2C), which was in excellent agreement with the clinical chemistry data. This indicates that our mPQN method is more robust than cPQN for the NMR-based metabonomics studies especially in the cases where drastic changes in the concentrations of some metabolites occur.

|
Download:
|
| Fig. 2. Rat blood plasma data [13] for the HFD induced obesity model including (A) fasting glucose levels (n = 12) from clinical chemistry (*P < 0.05), loadings plot from OPLSDA with (B) cPQN and (C) mPQN, respectively. The variables (i.e., metabolites) with warm color (e.g., red) contributed more significantly to differentiation of two groups than the ones with cold color (e.g., blue). Fasting glucose level showed no significant difference between HFD and control groups with cPQN (B) being inconsistent with clinical chemistry results whereas significant elevation in HFD group was shown with mPQN (C) being consistent with clinical chemistry results. | |
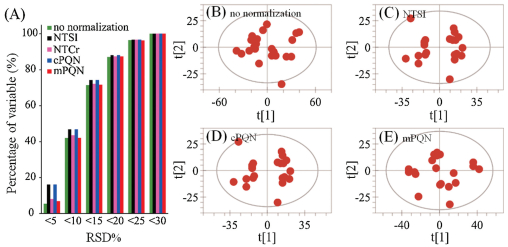
We also used the LC—MS data for human urine samples to validate the suitability of mPQN. The data employed here were from 22 aliquots of a quality control (QC) sample (pooled from 180 human urine samples) from a metabonomics study of diabetes (unpublished data); these data were acquired over 67 h to include possible inter-day systematic variations. Since all spectra were effectively acquired from the same sample over three days, a robust normalization method ought to yield minimal or no extra intersample variations except for these resulting from data acquisition thus gives exactly the same deviations as in the case of no normalization at all. We compared the inter-sample variations for all 1879 variables in the form of relative standard deviations (RSD) caused by different normalization methods. The results (Fig. 3A) showed that both cPQN and NTSI made more variables to have RSD smaller than 20% especially for variables with RSD < 5%; this potentially gave a positive-bias to at least 10% variables (with highest quality). In contrast, our mPQN method gave the best similarity in RSD for all variables compared with no normalization (Fig. 3A) hence caused much less bias for all variables. It is worthnoting that normalization-to-creatinine intensity (NTCr) gave excellent result as well in this case since these QC samples were effectively the same. We further conducted principal component analysis (PCA) for these 22 samples to assess the normalization effects on the overall distribution of variables (i.e., metabonomic similarities). The results showed that without any normalization, 22 samples expectedly had random distribution in the scores plot from PCA (Fig. 3B). However, both NTSI (Fig. 3C) and cPQN (Fig. 3D) resulted in some sub-group clusters for these 22 QC samples, suggesting some normalization-caused data distortions. In contrast, our mPQN method resulted in little extra intra-group variations (Fig. 3E), indicating the better robustness of this method.

|
Download:
|
| Fig. 3. Normalization-caused changes in RSD of metabonomic variables (unpublished data) repetitively detected from 22 urinary QC samples over 67 h (A) and in the PCA scores plots (B–E) revealed robustness of mPQN for variables with minimal changes. | |
To sum up, we developed a mPQN strategy based on the mode of quotients for metabonomics studies. Applications of this method to analyses of both simulated and real metabonomic data from NMR and LC–MS indicated that this newly developed method had better robustness in all cases than cPQN and NTSI. This mPQN method is capable of accommodating the datasets containing drastic metabolite changes without causing extra bias to datasets having minor inter-sample variations. Therefore, this mPQN method showed good suitability for data normalization in potentially any metabonomics studies.
Declaration of competing interestWe declare that we have no competing financial interest.
AcknowledgmentsWe acknowledge financial support from the National Key R&D Program of China (No. 2017YFC0906800) and the National Natural Science Foundation of China (Nos. 81590953, 31821002 and 21405020).
Appendix A. Supplementary dataSupplementary material related to this article canbefound, in the online version, at doi:https://doi.org/10.1016/j.cclet.2019.12.011.
| [1] |
J.K. Nicholson, J. Connelly, J.C. Lindon, E. Holmes, Nat. Rev. Drug Discov. 1 (2002) 153-161. DOI:10.1038/nrd728 |
| [2] |
J.K. Nicholson, J.C. Lindon, Nature 455 (2008) 1054-1056. DOI:10.1038/4551054a |
| [3] |
E. Holmes, I.D. Wilson, J.K. Nicholson, Cell 134 (2008) 714-717. DOI:10.1016/j.cell.2008.08.026 |
| [4] |
N.S. Jain, U.H.N. Duerr, A. Ramamoorthy, Chin. Chem. Lett. 26 (2015) 407-415. DOI:10.1016/j.cclet.2015.03.001 |
| [5] |
L. Zhou, H. Li, F. Hao, et al., J. Proteome Res. 14 (2015) 2331-2347. DOI:10.1021/acs.jproteome.5b00159 |
| [6] |
Q. Wang, S. Zeng, X. Wu, et al., J. Proteome Res. 17 (2018) 3223-3236. DOI:10.1021/acs.jproteome.8b00349 |
| [7] |
Y. Qi, Z.F. Pi, S. Liu, et al., Chin. Chem. Lett. 26 (2015) 387-392. DOI:10.1016/j.cclet.2014.11.017 |
| [8] |
Q. He, H. Tang, P. Ren, et al., J. Proteome Res. 10 (2011) 5214-5221. DOI:10.1021/pr200688u |
| [9] |
H. Zhao, J. Li, X. Ma, et al., Chin. Chem. Lett. 29 (2018) 102-106. DOI:10.1016/j.cclet.2017.06.013 |
| [10] |
L. Zhang, T. Xu, Z. Pi, et al., Chin. Chem. Lett. 30 (2019) 90-94. DOI:10.1016/j.cclet.2017.11.019 |
| [11] |
Y. Duan, Y. An, N. Li, et al., J. Proteome Res. 12 (2013) 3480-3495. DOI:10.1021/pr400341f |
| [12] |
H. Lin, Y. An, H. Tang, Y. Wang, J. Argric. Food Chem. 67 (2019) 3624-3632. DOI:10.1021/acs.jafc.9b00249 |
| [13] |
Y.P. An, W.X. Xu, H.H. Li, et al., J. Proteome Res. 12 (2013) 3755-3768. DOI:10.1021/pr400398b |
| [14] |
W. Xu, J. Wu, Y. An, et al., J. Proteome Res. 11 (2012) 3423-3435. DOI:10.1021/pr300280t |
| [15] |
J. Zhang, Y. Zhang, Y. Du, et al., J. Proteome Res. 10 (2011) 1904-1914. DOI:10.1021/pr101140n |
| [16] |
F. Dieterle, A. Ross, G. Schlotterbeck, H. Senn, Anal. Chem. 78 (2006) 4281-4290. DOI:10.1021/ac051632c |