 2020, Vol. 31


b State Key Laboratory of Bioelectronics, Southeast University, Nanjing 210096, China;
c Hunan Engineering Technology Research Center for Comprehensive Development and Utilization of Biomass Resources, Hunan University of Science and Engineering, Yongzhou 425199, China;
d China-Cuba Biotechnology Joint Innovation Center(CCBJIC), Yongzhou Zhong Gu Biotechnology Co., Yongzhou 425000, China
Diarrhea, as a global public health problem, has become a significant cause of high morbidity and mortality in developing countries [1-6]. According to the World Health Organization (WHO), there are nearly 1.7 billion cases of diarrhea every year resulting in 760, 000 deaths [7]. Diarrhea-causing bacteria are mainly transmitted through contaminated water, food, feces and other cross-infections [8-12]. E. coli is a Gram-negative Brevibacterium, which is the most central and abundant symbiotic bacteria in both human and animals' intestinal tracts, as well as a component of normal human intestinal flora [13-17]. However, there are five strains of E. coli pathogenic bacteria that lead to intestinal diseases and are the major pathogens that cause diarrhea worldwide. Diarrhea-causing E. coli includes enteropathogenic E. coli (EPEC), enterotoxigenic E. coli (ETEC), enterohemorrhagic E. coli (EHEC), enteroaggregative E. coli (EAEC), and enteroinvasive E. coli (EIEC) [18-22]. ETEC is the leading cause of bacterial diarrhea and produces heat labile (LT), or heat stable (ST) or both enterotoxins. EHEC are recognized as the primary cause of hemorrhagic colitis (HC) producing shiga-toxin, of these, O157:H7 is the prototypic EHEC and most often implicated in illness worldwide. EPEC promotes attaching-effacing lesions caused by an outer membrane adhesive protein encoded by the eae (E. coli attaching-effacing) gene. EIEC is highly invasive and it utilizes adhesin proteins to bind to and enter intestinal cells. EIEC do not produce toxins, but severely damage the intestinal wall through mechanical cell destruction, EIEC is very similar to Shigella spp. in biochemical, physiological, and genetic properties. EAEC are defined by their "stacked-brick" pattern of adhesion to the human laryngeal epithelial cell line HEp-2. The pathogenesis of EAEC involves the aggregation of and adherence of the bacteria to the intestinal mucosa, where they elaborate enterotoxins and cytotoxins that damage host cells and induce inflammation that results in diarrhea. Identification of diarrheagenic E. coli strains requires that these organisms be differentiated from nonpathogenic members of the normal flora. Particularly, in the outbreak period, it is especially significant to quickly and accurately identify the pathogenic E. coli causing diarrhea.
The traditional culture method is still the gold standard for testing microorganisms but, due to its time-consuming culture process, low sensitivity and easy occurrence of false negatives, it is not suitable for today's large number of clinical needs [23-29]. The nucleic acid amplification detection method has attracted more attention due to its advantages such as short time consumption and high sensitivity and specificity [30-37]. Multiplex PCR (mPCR) technology can detect multiple target sequences in one experiment. This method saves labor and reduces experimental cost and analysis time making it a rapid and reliable tool for the differentiation of multiple bacterial pathogens and the identification of virulence factors [38-46]. Additionally, the gene chip technology allows us to comprehensively screen multiple genes in a single reaction, making it potentially useful for typing bacterial pathogens.
In this study, we describe a new approach using mPCR and barcoded magnetic beads (BMBs) hybridization for the identification of a large number of virulence factors present in E. coli strains, while also determining the pathotype of the strains. All eight targets including associated virulence genes were amplified by mPCR and hybridized with the gene-specific probes immobilized on BMBs. After washing, the BMBs carrying the fluorescence signal was captured by a fluorescence microscope. In a single experiment, mPCR and BMB techniques allow the virulence pattern of a given strain to be assessed and the pathotype identified. The results indicated that the approach described in this study could be applicable for clinical diagnosis and epidemiological surveys, which is very important for patient management and prompt epidemiological investigations.
Bacterial strains (E. coli CICC10305, E. coli EIEC CICC10661, E. coli EPEC CICC10664, E. coli ETEC CICC10667, E. coli EHEC O157:H7 CICC21530) used in this study were purchased from the China Center of Industrial Culture Collection. Genomic DNA was extracted using a commercial kit (TIANamp Bacteria DNA Kit). The gene targets selected for each category were as follows: eae for EPEC, rfbE, stx1 and/or stx2 for EHEC, elt and est for ETEC, and ipaH for EIEC, uidA was also used for ETEC and EHEC. After mPCR reaction in a 25-μL system, the PCR amplicon was run on a 1% agarose gel and visualized under UV illumination.
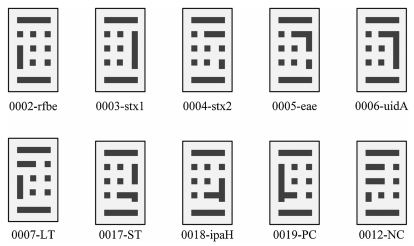
Ten patterns of carboxyl BMBs (Applied BioCode, Inc.) were used in this study, one positive control, one negative control and the remaining 8 representing gene targets displayed in Fig. 1. Each BMB pattern was coupled with a unique amino-modified oligonucleotide listed in Table 1. A schematic diagram of hybridization with the probe-bounded BMBs is shown in Fig. 2. To begin, 100 μL of BMBs were washed once with 200 μL nuclease free water and followed by 200 μL of 25 mmol/L 2-(N-morpholino) ethanesulfonic acid (MES) (pH 6.0). After washing, the product was placed on a magnet and the supernatant was discarded. A mixture containing 96 μL of MES, 24 μL of probe (100 μmol/L) and 80 μL freshly prepared 1-ethyl-3-(3-dimethylaminopropyl) carbodiimide hydrochloride (EDC) (10 mg/mL) were added to the BMBs and incubated at room temperature (r.t.) for 2 h. After incubation, the supernatant was removed and the BMBs were incubated with 200 mL Tris-HCl (50 mmol/L, pH 7.4) for 15 min at r.t. BMBs were then washed once with 200 μL 1× phosphate buffered saline (PBS) (pH 7.4) and blocked with 200 μL 1 × PBS/0.1% albumin from bovine serum (BSA) for 1 h at r.t. Finally, the BMBs were resuspended in 100 μL 1 × PBS-Tween buffer (Tween-20, 0.05%) and stored at 4 ℃.

|
Download:
|
| Fig. 1. Eight barcoded magnetic beads. Each BMB has a four digital number and can be coupled with one probe. PC represents a positive control probe, while NC represents a negative control probe. | |
|
|
Table 1 Oligonucleotides used in this study. |

|
Download:
|
| Fig. 2. BMB array detection diagram. A probe coupled with BMB can be hybridized with single stranded products labeled with Cy3. | |
Cy3-labelled asymmetric PCR products (25 μL) were mixed with an equal volume of 2× hybridization buffer, while additional Cy3 labeled oligonucleotides were spiked in the hybridization mixture as a positive control (PC). The mixture was hybridized with prepared BMBs bound with probes at 55 ℃ for 45 min. After magnetic separation, BMBs were washed once with 100 μL 2× saline-sodium cirate buffer (SSC) 0.1% sodium dodecyl sulfate sodium salt (SDS) followed by one wash with 80 μL 0.1 × SSC 0.1% SDS and 50 μL nuclease free water. BMBs were resuspended in 6 μL nuclease free water and observed by fluorescence microscopy. Signal intensities were calculated by GenPix Pro 6.0 and the signal to noise ratio was defined as the ratio of the median value of the target signal to the median value of the negative control signal. The "positive" result was determined when signal/noise is greater than 2.0.
After asymmetric mPCR was carried out on the five types of E. coli, the reaction products of each type of bacteria were hybridized with BMBs respectively to detect their specificity fluorescence microscopy.
After preliminarily determining the sensitivity of the gene chip, a range of inputs were selected to use as DNA template for asymmetric mPCR amplification and hybridization with BMBs. The inputs are as follows: 105 CFU/mL, 104 CFU/mL, 103 CFU/mL, 102 CFU/mL, 101 CFU/mL, and 1 CFU/mL. Fluorescence signals were analyzed to determine the detection sensitivity.
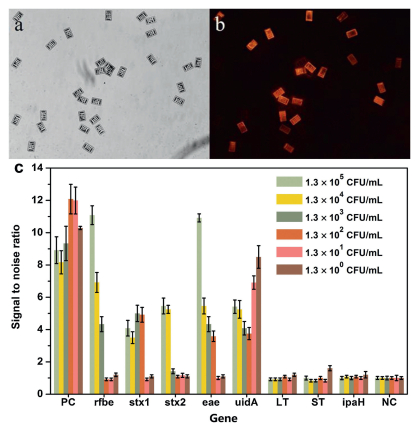
In this experiment, the specific genes of five bacteria were selected as detection targets and amplified with asymmetric mPCR, followed by hybridization of the single-stranded target molecules with BMBs to detect the genes of each bacterium. Taking EHEC as an example, in Fig. 3, it can be seen from the comparison of the white light image and fluorescence image of the detection result that the PCR product only specifically binds to the probe on the coded magnetic particle chip corresponding to the EHEC gene. Therefore, reliable detection results can be obtained by this detection method.

|
Download:
|
| Fig. 3. Detection of EHEC with BMBs array. (a) White light image of BMBs in the concentrate of 1.3 × 10⁵ CFU/mL EHEC. (b) Under the same field of view, the fluorescence image of BMBs in the concentrate of 1.3 × 10⁵ CFU/mL EHEC. (c) Result of data analysis. The signal value of each target molecule at each concentration is the average value of all the target molecular signals divided by the average negative signal. The variance is expressed as an error bar. | |
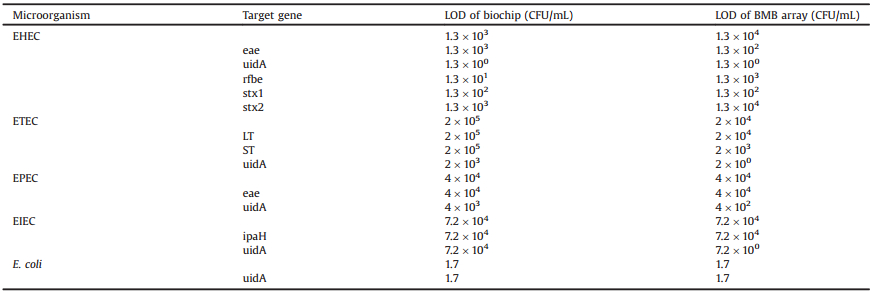
DNA was extracted from 1 mL of pure cultures from the following: 1.7 × 10⁹ CFU/mL E. coli, 7.2 ×10⁹ CFU/mL EIEC, 4 ×10⁹ CFU/mL EPEC, 2 ×10⁹ CFU/mL ETEC, and 1.3 × 10⁹ CFU/mL EHEC O157:H7 respectively, 100 μL TE buffer was used for the final resuspension. The genomic DNAs were serially diluted from 109 to 100 CFU/mL, and those DNA in the range of 105~100 CFU/mL were used as templates for mPCR to test the sensitivity of both the biochip and BMB array. Detection results from the BMB array system for EHEC is illustrated in Fig. 3, all Specific genes were simultaneously detected as positive, shows that concentrations could be measured as low as 1.3 × 10⁴ CFU/mL. The limits of detection (LOD) for the gene targets were as follows: 1.3 × 10⁴ CFU/mL for stx2, 1.3 ×10³ CFU/mL for rfbe, 1.3 ×10² CFU/mL for eae and stx1, 1.3 CFU/mL for uidA. The LODs of additional strains and their targets are shown in Table 2.
|
|
Table 2 LODs for the detection of biochip and BMBs array. |
Detection of the BMB array was compared to traditional detection methods on a biochip in order to test the performance of the designed mPCR on the array. As shown in Fig. 4, we use 6 times the average fluorescence intensity of negative control as cut off, and the LOD of EHEC when tested on the biochip assay was 1.3 × 10⁴ CFU/mL. The LODs of gene targets for EHEC were as follows: 1.3 × 10³ CFU/mL for stx2, 1.3 × 10³ CFU/mL for eae, 1.3 × 10² CFU/mL for stx1, 1.3 × 101 CFU/mL for rfbe, 1.3 × 100 CFU/mL for uidA. The LODs of additional strains and their targets are shown in Table 2 for both the biochip and BMB array. When comparing detection limits of the biochip and BMB array, the values the same for every strain except ETEC, in which BMB produced a lower detection. For ETEC, the detection limit of BMB array is one order of magnitude lower than the detection limit of biochip. Due to the advantages of barcoding, ability for highthroughput, and high specificity and sensitivity, the detection method of BMB array is comparable to that of a biochip.

|
Download:
|
| Fig. 4. Detection of EHEC with biochip. (a) The scan result of 1.3 × 10⁵~1.3 × 100 CFU/mL EHEC detected by biochip. (b) Result of data analysis. The signal value of each target molecule at each concentration is the average value of all the target molecular signals divided by the average negative signal. Six times the average fluorescence intensity value of the negative control was taken as cut off. The variance is expressed as an error bar. | |
In summary, we have developed a relatively highly accurate BMB based assay for simultaneously detecting EHEC, ETEC, EPEC and EIEC strains of bacteria. This detection method proved to be specific and capable of identifying specific E. coli bacteria correctly in pure culture. Compared with other methods, the BMB array has great potential for detection application. First, compared with the biochip, this method has a larger area to couple with probes and a larger space to hybridize with target molecules. Second, BMBs coupled with their probes can be flexibly chosen to customize a new detection system. Third, BMBs which utilize digital technology, have long-term stability properties, while color-coding microscopic beads are prone to fluorescence bleaching, thus degrading more rapidly. Finally, this method is easily automated which can produce high-throughput identification.
Further research is needed to fully automate and lower the limit of detection, which consists of enrichment of the target molecules, utilizing magnetic nanoparticles, incorporating magnetic beads for DNA extraction and the preparation of single chain based on magnetic separation. Certainly, the key is to develop instruments to utilize this detection method.
Declaration of competing interestThe authors declare that they have no known competing financial interests or personal relationships that could have appeared to influence the work reported in this paper.
AcknowledgmentsThis work was financially supported by the National Natural Science Foundation of China (Nos. 61971187, 61571187, 61871180), and Education Department Outstanding Young Project of Hunan Province (No. 18B299).
| [1] |
Y. Iijima, J.O. Oundo, T. Hibino, et al., Jpn. J. Infect. Dis. 70 (2017) 80-83. DOI:10.7883/yoken.JJID.2016.064 |
| [2] |
A. Gohar, N.F. Abdeltawab, A. Fahmy, M.A. Amin, BMC Res. Notes 9 (2016) 1-18. DOI:10.1186/s13104-015-1837-x |
| [3] |
N. Thakur, S. Jain, H. Changotra, et al., J. Clin. Lab. Anal. 32 (2018) 1-11. |
| [4] |
P. Mukherjee, V. Mondal, U. Bhaumik, et al., Microbes Infect. 21 (2019) 368-376. DOI:10.1016/j.micinf.2019.02.007 |
| [5] |
C.X. Dou, B. Liu, IEEE Trans. Smart Grid 4 (2013) 771-778. DOI:10.1109/TSG.2012.2230197 |
| [6] |
C. Zhang, H. Liao, X. Li, J. Sun, J. He, J. Sensors 2016 (2016) 1-9. |
| [7] |
P. Gallardo, M. Izquierdo, R.M. Vidal, et al., Front. Cell. Infect. Microbiol. 7 (2017) 1-10. |
| [8] |
P.A. Gleeson, Biol. Cell 214 (2011) 1-17. |
| [9] |
C.M. Lima, I.E.G.L. Souza, T. dos Santos Alves, et al., J. Food Sci. Technol. 54 (2017) 3612-3619. DOI:10.1007/s13197-017-2820-4 |
| [10] |
R.C.B. Dias, B.C. dos Santos, L.F. dos Santos, et al., APMIS 124 (2016) 299-308. DOI:10.1111/apm.12501 |
| [11] |
C. Zhang, H. Wu, J. He, C. Xu, J. Franklin Inst. 352 (2015) 3366-3377. DOI:10.1016/j.jfranklin.2015.01.035 |
| [12] |
Y. Chen, N. Liu, F. Hu, et al., Waste Manag. 75 (2018) 469-476. DOI:10.1016/j.wasman.2018.02.024 |
| [13] |
C.L. Zhong, R.H. Yao, K.W. Geng, IEEE Trans. Electron Devices 61 (2014) 394-399. DOI:10.1109/TED.2013.2295459 |
| [14] |
E.L. Ori, E.H. Takagi, T.S. Andrade, et al., Epidemiol. Infect. 147 (2019) e10. DOI:10.1017/S0950268818002595 |
| [15] |
L. lei, M.U. Rehman, S. Huang, et al., China Acta Trop. 182 (2018) 111-114. DOI:10.1016/j.actatropica.2018.02.022 |
| [16] |
M. Aijuka, E.M. Buys, Food Microbiol. 82 (2019) 363-370. DOI:10.1016/j.fm.2019.03.018 |
| [17] |
C.L. Zhong, L.E. Luo, H.S. Tan, K.W. Geng, Sol. Energy 108 (2014) 570-575. DOI:10.1016/j.solener.2014.08.010 |
| [18] |
J.C. Seidman, L.B. Johnson, J. Levens, et al., Front. Microbiol. 7 (2016) 1-8. |
| [19] |
U. Eigner, A. Hiergeist, A. Veldenzer, et al., Diagn. Microbiol. Infect. Dis. 88 (2017) 12-16. DOI:10.1016/j.diagmicrobio.2017.01.016 |
| [20] |
J. He, C. Zhang, Math. Probl. Eng. 2013 (2013) 1-6. |
| [21] |
L. Wang, H. Nakamura, E. Kage-Nakadai, Y. Hara-Kudo, Y. Nishikawa, Int. J. Food Microbiol. 249 (2017) 44-52. DOI:10.1016/j.ijfoodmicro.2017.03.003 |
| [22] |
C. Zhang, M. Niu, J. He, et al., IEEE Access 5 (2017) 197-207. DOI:10.1109/ACCESS.2016.2636224 |
| [23] |
S. Llewellyn, T. Inpankaew, S.V. Nery, et al., PLoS Negl. Trop. Dis. 10 (2016) 1-19. |
| [24] |
H.S. Huang, C.L. Tsai, J. Chang, et al., Clin. Microbiol. Infect. 24 (2018) 1055-1063. DOI:10.1016/j.cmi.2017.11.018 |
| [25] |
C. Mi, W. Li, W. Wu, Mechanics 25 (2019) 44-51. |
| [26] |
O. Lung, S. Ohene-Adjei, C. Buchanan, et al., Transbound. Emerg. Dis. 64 (2017) 834-848. DOI:10.1111/tbed.12449 |
| [27] |
D. Malandain, P. Bémer, A.G. Leroy, et al., Clin. Microbiol. Infect. 24 (2018) 83 e1-83.e6. DOI:10.1016/j.cmi.2017.05.017 |
| [28] |
E. Bialystok, Encycl. Early Child. Dev. 18 (2017) 465-483. |
| [29] |
Z. Chen, J. He, J. Liu, Y. Xiong, IEEE Trans. Power Electron. 34 (2019) 2427-2440. DOI:10.1109/TPEL.2018.2845701 |
| [30] |
U. Rappo, A.N. Schuetz, S.G. Jenkins, et al., J. Clin. Microbiol. 54 (2016) 2096-2103. DOI:10.1128/JCM.00549-16 |
| [31] |
Y. Mao, X. Huang, S. Xiong, et al., Food Control 59 (2016) 601-608. DOI:10.1016/j.foodcont.2015.06.048 |
| [32] |
X. Tang, Z. Chen, Y. Li, Y. Yang, Mech. Syst. Signal Process. 105 (2018) 404-426. DOI:10.1016/j.ymssp.2017.12.022 |
| [33] |
H.B. Zeng, J.H. Park, J.W. Xia, Nonlinear Dyn. 79 (2015) 83-91. DOI:10.1007/s11071-014-1646-0 |
| [34] |
G.T.R. Hischebeth, T.M. Randau, J.K. Buhr, et al., J. Microbiol. Methods 121 (2016) 27-32. DOI:10.1016/j.mimet.2015.12.010 |
| [35] |
M.A.M. Hossain, M.E. Ali, S.B.A. Hamid, et al., Food Control 73 (2017) 175-184. DOI:10.1016/j.foodcont.2016.08.008 |
| [36] |
Z. Wan, S. Zhang, Y. Zhou, Math. Probl. Eng. 2013 (2013) 1-9. |
| [37] |
K. Zhao, P. Li, C. Zhang, et al., J. Sensors 2018 (2018) 1-12. |
| [38] |
B. Li, P. Saingam, S. Ishii, T. Yan, Appl. Microbiol. Biotechnol. 103 (2019) 953-961. DOI:10.1007/s00253-018-9498-z |
| [39] |
Y. Zhao, H. Wang, P. Zhang, et al., Sci. Rep. 6 (2016) 1-8. DOI:10.1038/s41598-016-0001-8 |
| [40] |
X. Bian, F. Jing, G. Li, et al., Biosens. Bioelectron. 74 (2015) 770-777. DOI:10.1016/j.bios.2015.07.016 |
| [41] |
J. Wang, H. Shen, C. Huang, et al., Nano Res. 10 (2017) 145-156. DOI:10.1007/s12274-016-1273-9 |
| [42] |
A.K. Singh, D. Senapati, S. Wang, et al., ACS Nano 3 (2009) 1906-1912. DOI:10.1021/nn9005494 |
| [43] |
X.B. Mou, Z. Ali, B. Li, et al., Chin. Chem. Lett. 27 (2016) 1661-1665. DOI:10.1016/j.cclet.2016.04.005 |
| [44] |
S. Zhao, S. Wang, S. Zhang, J. Liu, Y. Dong, Chin. Chem. Lett. 29 (2018) 1567-1577. DOI:10.1016/j.cclet.2017.12.008 |
| [45] |
A.M. Mohammed, Chin. Chem. Lett. 27 (2016) 801-806. DOI:10.1016/j.cclet.2016.01.013 |
| [46] |
N.S. Jain, U.H.N. Dürr, A. Ramamoorthy, Chin. Chem. Lett. 26 (2015) 407-415. DOI:10.1016/j.cclet.2015.03.001 |