 2020, Vol. 31


b Department of Mechanical Engineering, The University of Melbourne, Parkville, VIC 3010, Australia;
c Department of Materials Science and Engineering, University of California Los Angeles, CA 90095-1595, USA
Electric double layer capacitors (EDLCs) are regarded as highly promising electrochemical energy storage (EES) devices owing to their fast uptake and release of energy, high power density, and long-term cycling stability [1-4]. However, their energy density is inferior to other EES systems such as lithium-ion batteries and other rechargeable batteries, serving as a serious impediment to their wide utilization. The energy density of aqueous EDLCs can be improved by either increasing the capacitance of carbon materials or extending the cell voltage [5]. With regard to the capacitance of carbon materials, the adsorption charge storage process is mainly dependent on the specific surface area and pore size distribution of the active materials [6-8]. As a result, carbon materials such as graphene, MOF derived carbons, microporous carbon spheres, and activated carbons with large specific surface areas and suitable pore sizes have been extensively studied as EDLC electrodes [9-15].
Carbon cloth (CC), a low cost, highly-conductive, chemically stable, and flexible carbon textile is commonly used as a conductive substrate for the growth of active materials in binder-free electrodes [16]. Actually, the CC also holds potential to be a standalone supercapacitor electrode with the advantages of easy processing and integrability with other devices [17-21]. However, this material usually exhibits low specific capacitance owing to the low specific surface area. Several strategies including chemical, electrochemical, and thermal activation have been utilized to enhance the surface area [22-28]. However, the attained surface area of most activated CCs is still relatively low which limits the capacitance and energy density. Recently, thermal activation of CC in air has been utilized as a facile strategy to enhance the surface area [29, 30]. Annealing at an appropriate temperature results in an enhancement of the surface area, whiles a higher annealing temperature may drastically decrease the mass density, which is a detriment to the volumetric capacitance. The optimum annealing conditions (annealing temperature and time) to obtain the best trade-off between surface area and mass density still needs to be studied. Another bottleneck for CC to achieve high energy density in aqueous symmetric supercapacitors is the limited cell voltage due to the thermodynamic breakdown of water (1.23 V) [1, 31]. Neutral electrolytes including Na2SO4, LiCl and Li2SO4 electrolytes have been utilized to overcome the cell voltage limitation in carbon-based symmetric supercapacitors [32-34]. Despite the wide potential window in neutral electrolytes (up to 1.6 V), water splitting reactions contribute towards charge storage when the cell voltage of the symmetric supercapacitor is increased to 2.0 V [33]. However, activated CC based symmetric supercapacitor with a stable potential window up to 2.0 V is expected to achieve higher energy density, which have been rarely reported.
Herein, we develop a high-voltage (2.0 V), high-energy-density aqueous symmetric supercapacitor based on activated CC achieved through a facile calcination activation method. The activated CC possesses rich microporosity with high surface area, excellent electrolyte wettability, and functionality in a wide potential window, which endow it over three orders of magnitude increase in specific capacitance when compared to pristine CC. Specifically, the activated CC delivers a high areal capacitance of 1700 mF/cm2 at 1 mA/cm2 in a two-electrode system, good rate capability as well as stable cycling performances up to 20, 000 cycles. The more demanding float voltage test is employed to confirm the stability in a wide cell voltage of 2.0 V. The activated CC delivers high volumetric and gravimetric energy densities of 7.62 mWh/cm3 and 18.2 Wh/kg, exceeding most reported activated CC based aqueous symmetric supercapacitors.
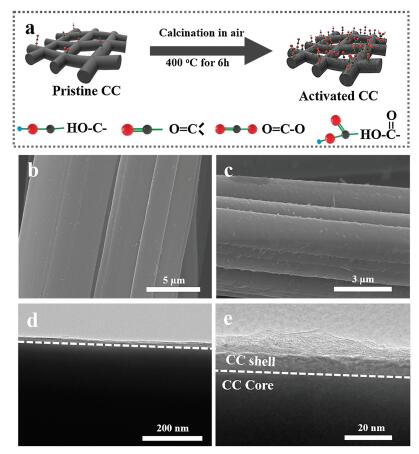
The activation of CC is achieved by simply annealing in air, which is schematically illustrated in Fig. 1a. The typical sample, CC- 400 ℃-6 h, is prepared by annealing the CC (4 × 5 cm2) in air at 400 ℃ for 6 h with a ramp rate of 2 ℃/min. Just like the pristine CC, the activated CC shows excellent mechanical strength and flexibility (Fig. S1a in Supporting information). Scanning electron microscopy (SEM) image show the pristine CC is composed of uniform carbon fibers with smooth surface (Fig. 1b). After activation, the activated CC (CC-400 ℃-6 h) shows a much rougher surface with numerous protrusions (Fig. 1c). However, the CC activated at 300 ℃ for 6 h still retains the original smooth surface (Fig. S1b in Supporting information), while the CC-400 ℃-2 h shows uneven protrusions on the surface (Fig. S1c in Supporting information). Transmission electron microscopy (TEM) is used to obtain more detailed information on the microstructure of the product. From Fig. 1d, we can observe that the activated CC is composed of a relatively compact carbon core and a highly porous shell [20, 22]. A higher magnification TEM image (Fig. 1e) shows that the carbon shell has a thickness of ~ 20 nm. A high-resolution TEM image shows that the porous shell is composed of several exfoliated graphitic layers (Fig. S2 in Supporting information). On the contrary, the pristine CC shows a smooth surface with no observable porous shell (Fig. S3 in Supporting information).

|
Download:
|
| Fig. 1. (a) Schematic representation of the activation process. (b) SEM image of the pristine CC. (c) SEM image of activated CC. (d) Low magnification and (e) Highmagnification TEM image of activated CC. | |
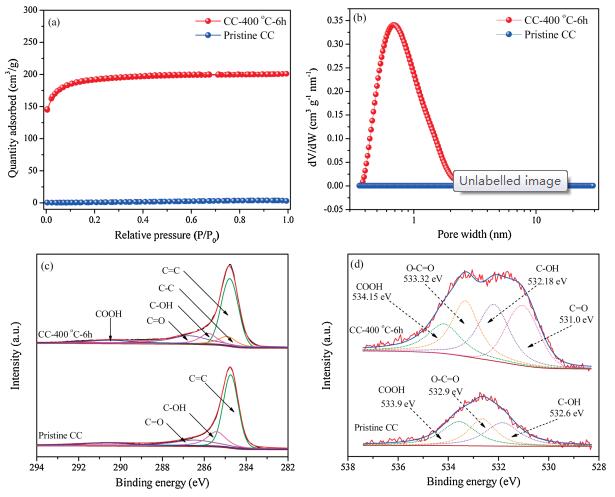
Figs. 2a and b display the N2 adsorption-desorption isotherms and the corresponding pore size distributions (PSD) of the pristine CC and activated CC (CC-400 ℃-6 h). The activated CC exhibits a typical typeIisotherm (Fig. 2a) [35].The sharp risein the adsorptionbranch at low relative pressure (P/P0 < 0.1) suggests the presence of rich micropores, which is further confirmed from the pore size distribution curves in Fig. 2b [36, 37]. Remarkably, the BET surface area of the activated CC reaches 615 m2/g, much higher than that of thepristine CC (1.5 m2/g).TheBETsurface areasof theCC-300 ℃-6 h and CC-400 ℃-2 h control samples are tested as well, and they are much lower than the CC-400 ℃-6 h (Fig. S4 in Supporting information). With enhanced surface area, the activated CC are expected to outperform the pristine CC in capacitive charge storage.

|
Download:
|
| Fig. 2. (a) N2 adsorption-desorption isotherms of pristine CC and CC-400 ℃-6 h. (b) Pore size distributions of pristine CC and CC-400 ℃-6 h. (c) Deconvolution of the C 1s spectra of CC-400 ℃-6 h and pristine CC. (d) Deconvolution of the O 1s spectra of CC-400 ℃-6 h and pristine CC. | |
Next, we utilized X-ray photoelectron spectroscopy (XPS) to study the potential incorporation of oxygen functional groups on the surface of activated CC (Table S1 in Supporting information). Fig. 2c shows a comparison of the C 1s spectra of the pristine and activated CC. The C 1s spectra can be deconvoluted into five peaks, namely, C=C, C—C, C-(OH), C=O and COOH situated at 284.79, 284.9, 285.81, 286.73 and 290.25 eV, respectively [22, 24]. Likewise, a deconvolution of the C 1s spectra of the CC-300 ℃-6h and CC-400 ℃-2 h also show the same peaks (Fig. S5 in Supporting information). Comparing the O 1s spectra of the pristine CC and CC-400 ℃-6 h, one can observe a noticeable increase in the O signal in the activated CC (Fig. 2d). This increased O signal may be attributed to the inclusion of O-functional groups on the surface of CC after activation (Table S2 in Supporting information). A deconvolution of the O 1s spectrum of the CC-400 ℃-6 h (Fig. 2d) presents four peaks, namely carbonyl (O=C), hydroxyl (C—OH), ester (O—C=O), and carboxyl (COOH) functional groups with binding energies of 531.00, 532.18, 533.32, and 534.15 eV, respectively [22, 24]. However, the carbonyl related functional group is absent in the O 1s spectrum of pristine CC. To further understand the relationship between the surface functional group c ontent and the activation process, the O 1s spectra of CC-300 ℃- 6 h and CC-400 ℃-2 h are deconvoluted as well (Fig. S5 in Supporting information). The carbonyl (C=O) functional group is again absent in the O 1s peak of CC-300 ℃-6 h, while the CC-400 ℃-2 h gives rise to the four peaks mentioned above. The successful activation is attributed to the introduction of carbonyl functional groups at 400 ℃ and the increment of ester and carboxyl groups.
Next, the samples are characterized by Raman spectroscopy (Fig. S6 in Supporting information). The characteristic D band situated at 1327 cm-1 is related to the defect sites and disorders, whereas the G band observed at 1594 cm-1 is associated with the stretching of the C—C bonds in carbon [38, 39]. The disorder in carbon materials can be quantified by analyzing the ID/IG intensity ratio. The ID/IG ratio remains almost unchanged in the pristine CC, CC-300 ℃-6 h, and CC-400 ℃-2 h samples (Fig. S 6). However, it increases marginally from 1.41 for pristine CC to 1.49 for CC-400 ℃- 6 h, suggesting a mild activation of the CC. The N2 sorption, XPS, and Raman results fully confirm the successful activation of CC.
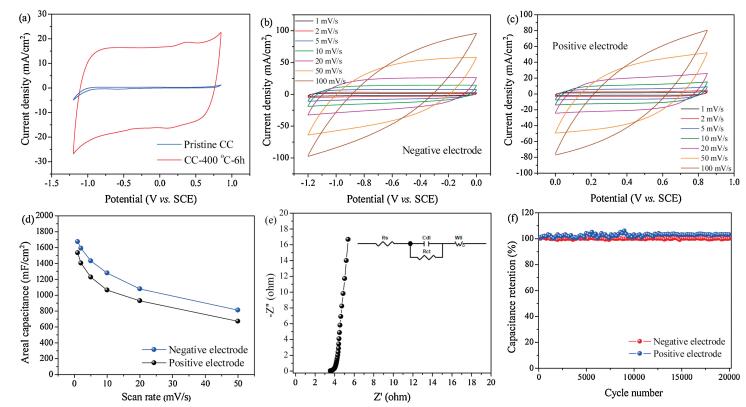
The electrochemical performances of the pristine and activated CC are evaluated by cyclic voltammetry (CV) and galvanostatic charge/discharge (GCD) tests in a three-electrode system in 1 mol/L Na2SO4 electrolyte. Fig. 3a shows a comparison of the typical CV curves of pristine CC and activated CC at a scan rate of 10 mV/s. The activated CC shows an obvious increase in CV area as compared to the untreated CC, denoting the excellent capacitive performance after activation. It is worth mentioning that the activated CC is stable in a wide potential window of 2.05 V. The typical CV curves of activated CC in the positive and negative potential windows at different scan rates (1–50 mV/s) show characteristic quasi-rectangular signature of EDLC materials with good symmetry even at high scan rates (Figs. 3b and c).

|
Download:
|
| Fig. 3. (a) Comparison of a typical CV curve of the pristine CC and activated CC at 10 mV/s in a 2.05 V potential window. (b) CV curves of the activated CC in a negative potential window. (c) CV curves of the activated CC in a positive potential window. (d) Areal capacitances of the activated CC at different scan rates. (e) Nyquist plot of the activated CC in 1 mol/L Na2SO4 electrolyte. (f) Cycling performances of the activated CC measured at a current density of 50 mA/cm2 for 20, 000 cycles. | |
Areal capacitances of 1660 and 1530 mF/cm2 are achieved by the activated CC at a scan rate of 1 mV/s in the negative and positive potential window, respectively (Fig. 3d and Fig. S7 in Supporting information). The GCD curves at various current densities (1–50 mA/cm2) show quasi-triangular shapes (Figs. S8a and b in Supporting information). A high areal (volumetric) capacitance of 1600 mF/cm2 (51.8 F/cm3) is realized at 1 mA/cm2 (Fig. S8c in Supporting information) in the negative potential window. Upon increasing the current density to 50 mA/cm2, an areal (volumetric) capacitance of 1160 mF/cm2 (37.5 F/cm3) is attained, implying the excellent rate capability of the activated CC. Areal (volumetric) capacitances of 1553 (50.1 F/cm3) and 970 mF/cm2 (31.3 F/cm3) are obtained at 1 and 50 mA/cm2, respectively, in the positive potential window (Fig. S8d in Supporting information). The faradaic efficiency at a current density of 5 mA/cm2 is 93% and 99% for the negative and positive electrode, respectively. The optimized heat treatment conditions for realizing excellent electrochemical performance is 400 ℃ for 6 h as the control samples (CC-300 ℃- 6 h; CC-400 ℃-2 h; CC-500 ℃-6 h) either exhibit low capacitances (Fig. S9 in Supporting information) or become shriveled (Fig. S1d in Supporting information). The low capacitances are due to the low specific surface area of the control samples (1.4 m2/g for CC-300 ℃- 6 h; 272.6 m2/g for CC-400 ℃-2 h) as shown in Fig. S4.
The activated CC (CC-400 ℃-6 h) exhibits a low voltage drop (0.007 V, Fig. S8a) at 1 mA/cm2, suggesting a low internal resistance (Rs) [3, 17]. EIS is employed at open-circuit voltage to further probe the resistance and charge-transfer kinetics at the electrodeelectrolyte interface. The Nyquist plot of activated CC is displayed in Fig. 3e. The Rs value which is obtained at the intercept of real part (Z') at high frequencies represents the inherent material resistance, ionic resistance of the electrolyte, and contact resistance at the electrode-electrolyte interface, whiles the charge-transfer resistance (Rct) calculated from the semi-circle of Nyquist plot at high frequencies is associated with the resistance at the electrodeelectrolyte interface during electron transfer [40]. Finally, the semicircle at high frequencies and the perpendicular slope at lower frequencies are connected by a 45 ° Warburg region which correlates with the ion diffusion in the electrolyte. The Nyquist plot exhibits a very steep slope at lower frequencies, a small semicircle at higher frequencies, and a short 45 ° Warburg region (Fig. S10 in Supporting information), signifying an excellent capacitive behavior and good ion diffusion kinetics [41, 42]. An analysis of the Nyquist plot using the equivalent circuit reveals that the activated CC exhibits a low Rs and Rct of 3.57 and 0.13 Ω, respectively, whiles a resistance of 3.22 Ω is calculated from the potential drop at 5 mA/cm2. Finally, as one of the important parameters for supercapacitors, the long-term cycling stability of activated CC is studied (Fig. 3f). The activated CC exhibits excellent stability as either a positive or negative electrode with no capacitance loss over 20, 000 charge/discharge cycles.
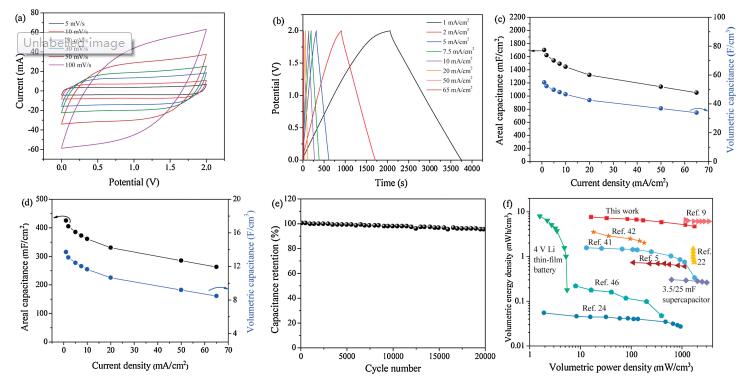
To further evaluate the electrochemical performance of the activated CC for real applications, a two-electrode supercapacitor device is assembled in 1 mol/L Na2SO4 electrolyte. The supercapacitor is expected to be functional in a wide potential window of 2.0 V based on the individual stable potential window of electrode in half-cells. To confirm, we first test a series of CV curves at 10 mV/s with an increasing potential window of up to 2.1 V (Fig. S11a in Supporting information). The CV curve could easily reach 2.0 V with no occurrence of water splitting. This ultra-wide voltage window exceeds the operating voltage window of most reported asymmetric supercapacitors and it ranks amongst the broadest achieved voltage for porous carbon-based aqueous symmetric supercapacitors. Fig. 4a displays CV curves of the symmetric supercapacitor in a 2.0 V window at scan rates of 5– 100 mV/s. The CV curves are nearly rectangular shaped with good symmetry even at a high scan rate of 100 mV/s, demonstrating the excellent capacitive storage behavior.

|
Download:
|
| Fig. 4. (a) CV curves of the aqueous symmetric supercapacitor at various scan rates from 5 mV/s to 100 mV/s in a 2.0 V potential window. (b) GCD curves of the aqueous symmetric supercapacitor from 1 mA/cm2 to 50 mA/cm2 in a 2.0 V potential window. (c) The areal and volumetric capacitances of a single electrode measured in the twoelectrode system. (d) The areal and volumetric capacitances of the aqueous symmetric supercapacitor at different current densities. (e) Cycling stability test up to 20, 000 charge/discharge cycles. (f) Ragone plot of the activated CC-based aqueous symmetric supercapacitor, the volumetric energy and power densities of recently reported carbon and metal oxide-based supercapacitors and conventional storage devices are added for comparison. | |
GCD curves tested at current densities ranging from 1 mA/cm2 to 65 mA/cm2 are shown in Fig. 4b. The curves exhibit very good symmetry, even up to a high cell voltage of 2.0 V, which is a further testament to the excellent capacitive performance of activated CC. At a current density of 5 mA/cm2, the faradaic efficiency is determined to be 95%. Areal, gravimetric, and volumetric capacitances are calculated based on the GCD curves. The activated CC exhibits areal and volumetric capacitances of 1700 mF/cm2 and 55 F/cm3 at a current density of 1 mA/cm2 in the two-electrode system (Fig. 4c). In terms of the gravimetric capacitance, the activated CC achieves a capacitance of 131 F/g. The capacitance of the symmetric device is calculated as well (Fig. 4d). At a current density of 1 mA/cm2, the symmetric device exhibits remarkable areal and volumetric capacitances of 425 mF/cm2 and 13.71 F/cm3, respectively. At a current density of 65 mA/cm2, 62% of the capacitances (263 mF/cm2 and8.50 F/cm3) are attained.In termsofgravimetric capacitance, the symmetric device exhibits a capacitance of 32.7 F/g at 1 mA/cm2 (Fig. S11b in Supporting information).
Finally, the long-term stability of the activated CC-based symmetric device is investigated. The symmetric supercapacitor presents an extraordinary cycling performance with a negligible capacitance loss of 3% after 20, 000 cycles at 50 mA/cm2 (Fig. 4e). The float voltage test which is more accurate in determining the stability of supercapacitors is also performed [43-45]. In the float voltage test, the supercapacitors are kept at the maximum cell voltage for elongated times (300 h in this test), and hence, the supercapacitors are expected to undergo a faster decay compared to conventional charge-discharge cycling. The activated CC-based supercapacitor retains 94% of the capacitance during the 300 hfloat voltage test (Fig. S12 in Supporting information), demonstrating its excellent stability. Also, an analysis of the Nyquist plot of the full symmetric supercapacitor reveals a Rs of 1.82 Ω (Fig. S13 in Supporting information).
The symmetric device presents maximum gravimetric and areal energy densities of 18.2 μWh/kg and 236.1 mWh/cm2 (Fig. S14 in Supporting information), respectively. Again, as shown in the Ragone plot (Fig. 4f), the activated CC-based symmetric supercapacitor presents a maximum volumetric energy density of 7.62 mWh/cm3 and a maximum volumetric power density of 1764 mW/cm3. The attained maximum energy density is much higher than many other energy storage devices including carbonbased aqueous symmetric supercapacitors, some asymmetric supercapacitors, and comparable to a 4 V lithium-ion thin film battery as compared in the Ragone plot [5, 9, 22, 24, 41, 42, 46].
The comprehensive electrochemical performance of the symmetric supercapacitor can be attributed to the unique advantages of the activated CC. To be specific, the microporous activated CC with high surface area presents large active sites for capacitive charge storage [7, 8]. The attained capacitance values are much higher than several previously reported carbon textile-based electrodes (Table S3 in Supporting information) [22, 24, 26-28, 41, 47-49]. Second, the O functionalization improves the surface wettability of activated CC in aqueous electrolytes without compromising the electronic conductivity (Video S1 in Supporting information) [50]. In contrast, the pristine CC exhibits strong hydrophobicity (Fig. S15 in Supporting information) and negligible BET surface area (Fig. 2a). Third, owing to the large oxygen and hydrogen overpotentials in the neutral electrolyte, the activated CC is functional in a wide potential window of 2.0 V (Fig. S16 in Supporting information), resulting in high energy density of the symmetric device [51-53].
In conclusion, a mild calcination activation method for converting commercial carbon cloth to highly capacitive carbon cloth has been developed. The activated carbon cloth possesses large specific surface area for capacitive charge storage, superior electrolyte wettability, and is stable in a wide potential window. A high areal capacitance of 1700 m F/cm2 is delivered based on a single electrode in a two-electrode system, as well as good rate capability and stable cycling performances up to 20, 000 cycles. The 2 V aqueous symmetric supercapacitor achieves a high energy density of 7.62 mWh/cm3 and a maximum power density of 1764 mW/cm3, which ranks high amongst reported electrochemical performances of activated carbon cloth-based aqueous symmetric supercapacitors. Our work provides new insights into the fabrication of wide voltage, high-energy-density aqueous symmetric supercapacitors by designing porous carbon materials with large oxygen/hydrogen evolution overpotentials.
Declaration of competing interestThe authors declare that they have no known competing financial interests or personal relationships that could have appeared to influence the work reported in this paper.
AcknowledgmentsThis work was supported by the National Natural Science Fund for Distinguished Young Scholars (No. 51425204), the National Natural Science Foundation of China (No. 51521001), the National Key Research and Development Program of China (No. 2016YFA0202603), the Programme of Introducing Talents of Discipline to Universities (No. B17034), the Yellow Crane Talent (Science & Technology) Program of Wuhan City.
Appendix A. Supplementary dataSupplementarymaterial related to this article can befound, in the online version, at doi:https://doi.org/10.1016/j.cclet.2019.09.045.
| [1] |
F. Béguin, V. Presser, A. Balducci, E. Frackowiak, Adv. Mater. 26 (2014) 2219-2251. DOI:10.1002/adma.201304137 |
| [2] |
J. Gamby, P. Taberna, P. Simon, J. Fauvarque, M. Chesneau, J. Power Sources 101 (2001) 109-116. DOI:10.1016/S0378-7753(01)00707-8 |
| [3] |
Y. Zhu, S. Murali, M.D. Stoller, et al., Science 332 (2011) 1537-1541. DOI:10.1126/science.1200770 |
| [4] |
L.L. Zhang, X. Zhao, Chem. Soc. Rev. 38 (2009) 2520-2531. DOI:10.1039/b813846j |
| [5] |
M. Yu, D. Lin, H. Feng, et al., Angew. Chem. Int. Ed. 56 (2017) 5454-5459. DOI:10.1002/anie.201701737 |
| [6] |
M. Zhi, F. Yang, F. Meng, et al., ACS Sus. Chem. Eng. 2 (2014) 1592-1598. DOI:10.1021/sc500336h |
| [7] |
J. Chmiola, G. Yushin, Y. Gogotsi, et al., Science 313 (2006) 1760-1763. DOI:10.1126/science.1132195 |
| [8] |
J. Chmiola, G. Yushin, R. Dash, Y. Gogotsi, J. Power Sources 158 (2006) 765-772. DOI:10.1016/j.jpowsour.2005.09.008 |
| [9] |
J.Y. Hwang, M. Li, M.F. El-Kady, R.B Kaner, Adv. Funct. Mater. 27 (2017) 1605745. DOI:10.1002/adfm.201605745 |
| [10] |
R.R. Salunkhe, Y.V. Kaneti, J. Kim, J.H. Kim, Y. Yamauchi, Acc. Chem. Res. 49 (2016) 2796-2806. DOI:10.1021/acs.accounts.6b00460 |
| [11] |
Z. Ling, Z. Wang, M. Zhang, et al., Adv. Funct. Mater. 26 (2016) 111-119. DOI:10.1002/adfm.201504004 |
| [12] |
Q. Yu, D. Guan, Z. Zhuang, et al., ChemPlusChem 82 (2017) 872-878. DOI:10.1002/cplu.201700182 |
| [13] |
M. Xu, Q. Yu, Z. Liu, et al., Nanoscale 10 (2018) 21604-21616. DOI:10.1039/C8NR07560C |
| [14] |
S. Feng, Z. Liu, Q. Yu, et al., ACS Appl. Mater. Interfaces 11 (2019) 4011-4016. DOI:10.1021/acsami.8b19901 |
| [15] |
S. Zhang, J. Liu, P. Huang, et al., Sci. Bull. 62 (2017) 841-845. DOI:10.1016/j.scib.2017.05.019 |
| [16] |
J. Nawishta, H. Ahmad, X. Qiuying, et al., Adv. Mater. 29 (2017) 1700804. DOI:10.1002/adma.201700804 |
| [17] |
K.A. Owusu, L. Qu, J. Li, et al., Nat. Commun. 8 (2017) 14264. DOI:10.1038/ncomms14264 |
| [18] |
P. Yang, Y. Ding, Z. Lin, et al., Nano Lett. 14 (2014) 731-736. DOI:10.1021/nl404008e |
| [19] |
X. Lu, M. Yu, G. Wang, et al., Adv. Mater. 25 (2013) 267-272. DOI:10.1002/adma.201203410 |
| [20] |
J. Xu, Q. Wang, X. Wang, et al., ACS Nano 7 (2013) 5453-5462. DOI:10.1021/nn401450s |
| [21] |
W. Liu, M.S. Song, B. Kong, Y. Cui, Adv. Mater. 29 (2017) 1603436. DOI:10.1002/adma.201603436 |
| [22] |
W. Wang, W. Liu, Y. Zeng, et al., Adv. Mater. 27 (2015) 3572-3578. DOI:10.1002/adma.201500707 |
| [23] |
L. Dong, C. Xu, Y. Li, et al., Adv. Mater. 28 (2016) 1675-1681. DOI:10.1002/adma.201504747 |
| [24] |
G. Wang, H. Wang, X. Lu, et al., Adv. Mater. 26 (2014) 2676-2682. DOI:10.1002/adma.201304756 |
| [25] |
H. Jin, L. Zhou, C.L. Mak, et al., Nano Energy 11 (2015) 662-670. DOI:10.1016/j.nanoen.2014.11.055 |
| [26] |
H. Jin, Z. Peng, W. Tang, H. Chan, RSC Adv. 4 (2014) 33022-33028. DOI:10.1039/C4RA04864D |
| [27] |
D. Ye, Y. Yu, J. Tang, L. Liu, Y. Wu, Nanoscale 8 (2016) 10406-10414. DOI:10.1039/C6NR00606J |
| [28] |
S. Jiang, T. Shi, X. Zhan, et al., J. Power Sources 272 (2014) 16-23. DOI:10.1016/j.jpowsour.2014.08.049 |
| [29] |
K. Kordek, L. Jiang, K. Fan, et al., Adv. Energy Mater. (2018) 1802936. |
| [30] |
Y.J. Gu, W. Wen, J.M. Wu, J. Mater. Chem. A 6 (2018) 21078-21086. DOI:10.1039/C8TA07561A |
| [31] |
N. Choudhary, C. Li, J. Moore, et al., Adv. Mater. 29 (2017) 1605336. DOI:10.1002/adma.201605336 |
| [32] |
M.P. Bichat, Raymundo-Piñero E., F. Béguin, Carbon 48 (2010) 4351-4361. DOI:10.1016/j.carbon.2010.07.049 |
| [33] |
L. Demarconnay, E. Raymundo-Piñero, F. Béguin, Electrochem. Commun. 12 (2010) 1275-1278. DOI:10.1016/j.elecom.2010.06.036 |
| [34] |
T. Zhai, S. Sun, X. Liu, et al., Adv. Mater. 30 (2018) 1706640. DOI:10.1002/adma.201706640 |
| [35] |
C. Largeot, C. Portet, J. Chmiola, et al., J. Am. Chem. Soc. 130 (2008) 2730-2731. DOI:10.1021/ja7106178 |
| [36] |
J. Zhao, H. Lai, Z. Lyu, et al., Adv. Mater. 27 (2015) 3541-3545. DOI:10.1002/adma.201500945 |
| [37] |
F. Zhang, T. Liu, M. Li, et al., Nano Lett. 17 (2017) 3097-3104. DOI:10.1021/acs.nanolett.7b00533 |
| [38] |
M.S. Dresselhaus, A. Jorio, M. Hofmann, G. Dresselhaus, R. Saito, Nano Lett. 10 (2010) 751-758. DOI:10.1021/nl904286r |
| [39] |
J. Zhou, J. Lian, L. Hou, et al., Nat. Commun. 6 (2015) 8503. DOI:10.1038/ncomms9503 |
| [40] |
L. Qu, Y. Zhao, A.M. Khan, et al., Nano Lett. 15 (2015) 2037-2044. DOI:10.1021/nl504901p |
| [41] |
Z. Li, T. Huang, W. Gao, et al., ACS Nano 11 (2017) 11056-11065. DOI:10.1021/acsnano.7b05092 |
| [42] |
L. Kou, T. Huang, B. Zheng, et al., Nat. Commun. 5 (2014) 3754. DOI:10.1038/ncomms4754 |
| [43] |
X. Yang, C. Cheng, Y. Wang, L. Qiu, D. Li, Science 341 (2013) 534-537. DOI:10.1126/science.1239089 |
| [44] |
D. Weingarth, H. Noh, A. Foelske-Schmitz, A. Wokaun, R. Kötz, Electrochim. Acta 103 (2013) 119-124. DOI:10.1016/j.electacta.2013.04.057 |
| [45] |
D. Weingarth, A. Foelske-Schmitz, R. Kötz, J. Power Sources 225 (2013) 84-88. DOI:10.1016/j.jpowsour.2012.10.019 |
| [46] |
X. Xiao, T. Li, P. Yang, et al., ACS Nano 6 (2012) 9200-9206. DOI:10.1021/nn303530k |
| [47] |
L. Dong, C. Xu, Y. Li, et al., Adv. Mater. 28 (2016) 9313-9319. DOI:10.1002/adma.201602541 |
| [48] |
Z. Weng, Y. Su, D.W. Wang, et al., Adv. Energy Mater. 1 (2011) 917-922. DOI:10.1002/aenm.201100312 |
| [49] |
J. Xue, Y. Zhao, H. Cheng, et al., Phys. Chem. Chem. Phys. 15 (2013) 8042-8045. DOI:10.1039/c3cp51571k |
| [50] |
T. Lin, I.W. Chen, F. Liu, et al., Science 350 (2015) 1508-1513. DOI:10.1126/science.aab3798 |
| [51] |
Y.L. Shao, M.F. El-Kady, J.Y. Sun, et al., Chem. Rev. 118 (2018) 9233-9280. DOI:10.1021/acs.chemrev.8b00252 |
| [52] |
K. Fic, G. Lota, M. Meller, E. Frackowiak, Energy Environ. Sci. 5 (2012) 5842-5850. DOI:10.1039/C1EE02262H |
| [53] |
X. Zang, C. Shen, M. Sanghadasa, L. Lin, ChemElectroChem 6 (2019) 976-988. DOI:10.1002/celc.201801225 |