 2020, Vol. 31


b School of Environmental Science and Engineering, Shanghai Jiao Tong University, Shanghai 200240, China;
c College of Science, Key Laboratory of Ecophysics, Department of Physics, Shihezi University, Shihezi 832003, China;
d Collaborative Innovation Center of Sustainable Energy Materials, Guangxi Key Laboratory of Electrochemical Energy Materials, Guangxi University, Nanning 530004, China;
e Key Laboratory of New Processing Technology for Non-ferrous Metal and Materials, Ministry of Education, Nanning 530004, China
With fossil fuel increasingly depleting and environment pollution continuously deteriorating, fuel cells, which can directly transfer chemical energy into electro energy, are widely considered as the most promising devices to replace fossil fuel to supply the green and clean energy [1, 2]. As well known, oxygen reduction reaction (ORR) as a sluggish reaction plays a pivotal role in the development and application of fuel cells [3-5]. Therefore, using suitable catalysts to boost ORR performance is of great significance for the development of fuel cells [6-8]. Up to now, noble metal platinum (Pt)-based catalysts are considered as the most efficient ORR catalysts. However, the application of Pt-based catalysts remains some inevitable problems, such as high cost, poor stability and methanol poisoning, which have seriously restricted the large-scale commercialization and application of fuel cells [9-13]. To address the problems mentioned above, it is of great significance to search for the catalysts with low-cost, high-efficiency and superior stability as the potential substitutes for Pt-based catalysts.
As reported in the past years, extensive researches have proved that non noble transition metal (M) and nitrogen (N) co-doped carbon (M-N-C) materials, which are recognized as the most promising Pt-free catalysts, display satisfactory activity toward ORR [14]. It is believed that the M-N-C moiteties acting as the active sites are able to induce uneven charge distribution for the improvement of O2 adsorption and catalyze the subsequent O-O band breaking, therefore significantly boosting the electrochemical catalytic ORR performance [15-18]. Among different kinds of transition metals, M-N-C (M = Fe, Co, Ni or Mn) used as the high-performance catalysts for ORR have been extensively studied [19-22]. Such catalysts are typically prepared by pyrolyzing a composite precursor containing iron, cobalt, nickel or Mn, nitrogen and carbon at high temperatures using conventional heating method (CHT) under the condition of N2 or Ar as the protective atmosphere to isolate oxygen. As most papers reported, MOFs have been widely used as precursors to prepare Fe-N-C, Co-N-C and Mn-N-C via CHT [23-27]. However, controlling the amount of nitrogen doping in MOF-derived catalysts is still a great challenge [28]. Therefore, it is significantly encouraging and promising to fabricate M-N-C materials from other resources consisting of satisfactory nitrogen content to guarantee the amount of nitrogen doping.
Herein, we reported the synthesis of Zn-N-C using biomass resource chitosan (CTS) via a simple and facile carbon bath method (CBM). As well known, CTS not only consists of high content percentage of nitrogen (6.89%), but also possesses some attractive properties, such as sustainable, environmental friendly, low cost and non-toxic, which have caught more and more attention [29-31]. In addition to these properties, there are lone-pair electrons in the free amino groups and hydroxyl groups, which are able to help CST give the strong ability to coordinate by a chelation mechanism with many transition metal ions who have empty orbitals [32-36]. Moreover, compared with CHT, CBM can achieve the similar effects to those of CHT without the application of the additional protective air (such as N2 or Ar), because it is well known that carbon is able to consume oxygen during the pyrolysis period [36, 37]. In particular, during the electrochemical ORR tests, the obtained Zn-N-C material displayed high electrocatalytic activity with an onset potential E0= 0.96 VRHE and a half wave potential E1/2 = 0.86 VRHE, which were more positive than those of the commercial 20 wt% Pt/C benchmark catalyst (E0 = 0.94 VRHE and E1/2 = 0.81 VRHE). In addition, the as-prepared Zn-N-C catalyst also had a better stability and methanol tolerance than those of the Pt/C catalyst. Especially, the Zn-N-C catalyst fabricated in this work extends the application of CTS and promotes the development of fuel cells.
The Zn-N-C catalyst was prepared from the mixture of CTS and Zn(NO3)2 6H2O via a simple carbon-bath route. In a typical synthesis, CTS (1 g) was uniformly mixed with Zn(NO3)2 6H2O (0.39 g) in distilled water with strongly magnetic stirring at the room temperature for 12 h, and then the obtained mixture was dried in an drying oven with the temperature maintaining at 80 ℃. Afterwards, the dried solid was placed into a crucible (50 mL), which was then buried in another bigger crucible (150 mL) by using enough carbon powder. After that, the sample was thermally treated in a Muffle furnace with temperature at 900 ℃ for 2 h. After cooling to room temperature, the obtained sample was named as ZnO/Zn-N-C. Finally, the Zn-N-C catalyst was obtained after the ZnO/ Zn-N-C sample was treated using 1 mol/L HCl to remove ZnO and Zn metals. For comparison, the pure CTS with absence of Zn(NO3)2 6H2O was treated via the same route to obtain the sample of N-C.
X-ray diffraction (XRD) date was acquired on a Brucker D8 Advance X-ray diffractometer with Cu Kα radiation (λ =1.5406 Å). An Amicus/ESCA 3400 electron spectrometer was applied to record the X-ray photoelectron spectroscopy (XPS) data. A JEM-2100 instrument (JEOL, Japan) was used to collect transmission electron microscopy (TEM) images. A Tecnai G2 F20 instrument (FEI, USA) was employed to acquire the high-resolution transmission electron microscopy (HRTEM) images. Nitrogen adsorption-desorption isotherms were perfromed on a Micromeritics ASAP 2460 apparatus (Norcross, GA, USA). The specific surface area, total pore volume and average pore size were calculated according to the Brunauer-Emmett-Teller (BET) and Barrett-Joyner-Halenda (BJH) methods. A Renishaw instrument Raman (Ar ion laser excitation, 514.5 nm) was applied to obtain spectroscopy data. The X-ray absorption fine structure (XAFS) spectra were collected at beamline 1W2B of the Signapore Synchrotron Radiation Facility in fluorescence mode.
The catalytic performance of the resulting catalysts was tested on a CHI760E electrochemical station together with a three-electrode cell with N2 and O2 gas flow system. During the test process, Ag/AgCl (saturated KCl) worked as the reference electrode and Pt foil acted as the counter electrode. In order to prepare the work electrode, 5 mg of the as-prepared catalytic powder was dispersed in a mixture solution consisting of 25 μL of 5 wt% Nafion and 475 μL of ethanol by means of sonication in 30 min to produce a homogeneous catalyst ink, and then 10 μL of the resulting catalyst ink was coated on a glassy carbon electrode as the working electrode after drying for further test. During the test process, the 0.1 mol/L KOH solution served as the alkaline electrolyte. The cyclic voltammetry (CV) was carried out with a scan rate of 50 mV/s under the N2 or O2 saturated condition, and the linear sweep voltammetry (LSV) was carried out at different rotation speeds from 400 rpm to 2500 rpm in the O2 saturated condition.
During the ORR testing procedure, the electron transfer numbers can be calculated according to the slopes of Koutecky-Levich (K-L) plots by means of the following Eq. (1):
|
(1) |
where J means the measured current density on RDE, Jk signifies the kinetic current density, ω stands for the rotation speed, and B is obtained according to the Eq. (2) given below:
|
(2) |
where n stands for the electron transfer number during the ORR procedure, F is 96, 485 C/mol (the Faraday constant), C0 denotes 1.2 × 10⁻³ mol/L (the dissolved O2 concentration), D0 is 1.9 × 10⁻⁵ cm2/s (the O2 diffusion coefficient) and v is 0.01 cm2/s (the electrolyte kinematic viscosity).
Furthermore, during the test process for ORR, all of the measured potentials were transferred into a reversible hydrogen electrode (RHE) according to the given equation as below: VRHE = VAg/AgCl + 0.197 + 0.059 pH.
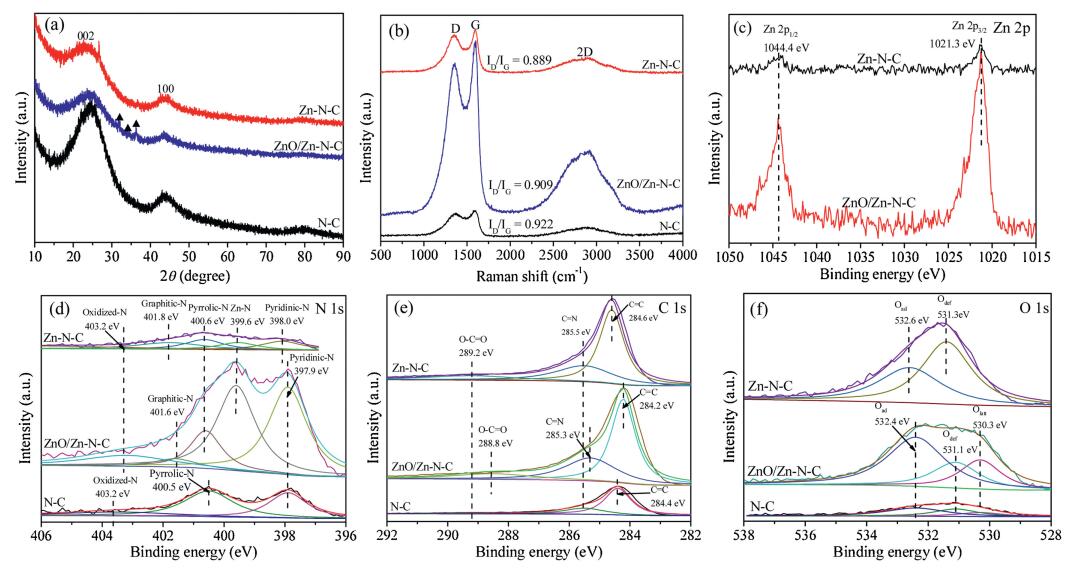
To examine the crystalline structure and phase composition of the as-prepared samples, XRD measurements were first con-ducted. Fig. 1a showed the XRD patterns of N-C (black line), Zn-N-C (red line) and ZnO/Zn-N-C (blue line). The XRD patterns for the three catalysts displayed two obvious peaks at ~23.6° and ~44°, contributing to the disordered graphite peak and the diffraction peak of graphitic carbon plane (101), respectively. Furthermore, a sharp peak (26.5°), assigning to the (002) diffraction of graphitic carbon (PDF#41-1487), was observed for the Zn-N-C composite, suggesting that Zn2+ was able to catalyze CST into partial graphene. However, three weak diffraction peaks, which was attributed to ZnO (PDF#36-1451), appeared in ZnO/Zn-N-C, confirming that a small amount of ZnO was present in the ZnO/Zn-N-C sample. Furthermore, Zn-based peaks were not present in the XRD pattern of Zn-N-C, suggesting that the concentration of the doped Zn was too low to diffract.

|
Download:
|
| Fig. 1. (a) XRD patterns and (b) Raman spectra for N-C, ZnO/Zn-N-C and Zn-N-C; (c) high resolution XPS spectra of Zn 2p for ZnO/Zn-N-C and Zn-N-C; The fitted XPS spectra results of (d) N 1s, (e) C 1s and (f) O 1s for N-C, ZnO/Zn-N-C and Zn-N-C, respectively. | |
Raman spectroscopy patterns were applied to determine the carbon structure of N-C, Zn-N-C and ZnO/Zn-N-C. In typical Raman spectra of carbon materials, D- and G-band peaks respectively emerge from the defect sites and the hybridized sp2-carbon bonding. Therefore, the ratio of the D- and G-band intensity (ID/IG) has been employed as an indicator of the graphitic degree in carbon materials [38]. It is known that a lower ratio of ID/IG usually corresponds to a higher graphitic degree [39]. As seen in Fig. 1b, the Raman spectrum of the three samples had two remarkable peaks at around 1360 cm-1 (D-band) and 1600 cm-1 (G-band). The intensity ratio, ID/IG, was 0.922 for N-C. For comparison, the ZnO/Zn-N-C displayed the ID/IG value of 0.909. After ZnO/Zn-N-C was treated using 0.1 mol/L HCl treatment, the obtained Zn-N-C displayed the lowest ID/IG value among the three samples, 0.889, suggesting that Zn-N-C possessed a higher graphitic degree than N-C and ZnO/Zn-N-C. Furthermore, the 2D peak in Raman spectra is an outstanding feature of graphene, whose shape and position can be employed to determine the layers of graphene [40]. It was worth noting that the three samples displayed a certain degree of graphitization, due to the presence of the 2D peak in the three samples.
As displayed in Fig. 1c, Zn-N-C and ZnO/Zn-N-C simultaneously gave Zn 2p1/2 peak at 1044.4 eV and Zn 2p3/2 peak at 1021.3 eV. Obviously, the intensity of Zn 2p for Zn-N-C was lower than that for ZnO/Zn-N-C, confirming that the Zn content in Zn-N-C was lower than that in ZnO/Zn-N-C.
Fig. 1d showed that the high-resolution N 1s spectra of N-C could be split into three nitrogen species peaks at 397.9 eV, 400.1 eV, and 402.2 eV, respectively, which were contributed to pyridinic-N, pyrrolic-N and oxidized-N species, respectively. However, the deconvoluted N 1s spectrum of the Zn-N-C was shown in Fig. 1d, revealing five nitrogen species peaks: pyridinic-N, 397.9 eV; Zn-N, 399.6 eV; pyrrolic-N, 400.5 eV; graphitic-N, 401.6 eV and oxidized-N, 403.7 eV, respectively. Obviously, Zn-N was present in the high-resolution XPS N 1s spectra of Zn-N-C, but not for N-C. Therefore, the results confirmed that Zn-N was present in carbon skeleton of Zn-N-C. Besides, the nitrogen species peaks in ZnO/Zn-N-C also contained the pyridinic-N, Zn-N, pyrrolic-N, graphitic-N and oxidized-N, which were at the 398.0 eV, 399.6 eV, 400.6 eV, 401.8 eV and 403.7 eV, respectively.
Fig. 1e displayed that the high-resolution XPS ℃ 1s spectrum in N-C exhibited three C states: graphite carbon, 284.4 eV; C=N, 285.5 eV and O-C=O, 289.2 eV. Simultaneously, Zn-N-C also showed sp2 carbon (284.6 eV), C=N (285.5 eV) and O-C=O (289.2 eV), respectively. However, the deconvoluted C 1s spectrum in ZnO/Zn-N-C could be split into three binding energy peaks, which located at 284.2, 285.3 and 288.8 eV, attributing to sp2 C in graphene (C=C), C=N and O-C=O, respectively.
The bonding configuration of oxygen atoms in samples were characterized by high- resolution XPS O 1s spectra (Fig. 1f). The O 1s signal of N-C exhibited three distinct peaks: lattice O (Olatt: 530.3 eV), defect O (Odef: 531.1 eV) and adsorb O (Oad: 532.4 eV). Besides, the broad O 1s spectrum of ZnO/Zn-N-C could be deconvoluted into three peaks centered at 530.3 eV, 531.1 eV and 532.4 eV, indexed to Olatt, Odef, Oad, respectively. However, only the Odef (531.3 eV) and Oad (532.6 eV) were present in Zn-N-C, but not Olatt, further confirming that there was no ZnO present in Zn-N-C.
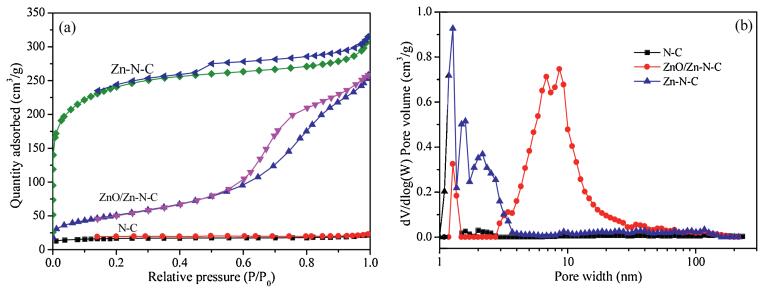
In order to further investigate the textural properties of the obtained N-C, ZnO/Zn-N-C and Zn-N-C, nitrogen porosimetry measurements were carried out, too. As shown in Fig. 2a, ZnO/Zn-N-C and Zn-N-C displayed the typical type IV isotherms with significant hysteresis rings in the range: P/P0= 0.4-1.0, mainly due to the presence of mesoporous structures. Moreover, the adsorp-tion line of Zn-N-C had risen sharply at relative lower pressure, meaning that the rich micropores were simultaneously present. Typically, the N-C from pure CTS exhibited an obvious type III isotherm, indicating that only the micropore structures were present. The results mentioned above consisted with the distribution of pore size, as shown in Fig. 2b. Furthermore, as the results listed in Table 1, the N-C sample from pure CTS gave the BET surface area: 54.6 m2/g, pore volume: 0.04 cm3/g and mean pore size: 2.75 nm. In comparison with those of N-C, ZnO/Zn-N-C delivered a prominent increase in BET surface area, pore volume and mean pore size, which was 184.0 m2/g, 0.40 cm3/g and 8.65 nm, respectively. Compared with the two samples, Zn-N-C also gave an obvious increase in BET surface area (794.7 m2/g) and pore volume (0.49 cm3/g), whereas its mean pore size was 2.44 nm, which less decreased in comparison with those of N-C and ZnO/Zn-N-C. In short, such a change in the textural properties of the samples was favorable for the catalytic site accessibility during the electrocatalytic process.

|
Download:
|
| Fig. 2. Nitrogen adsorption-desorption isotherms (a) and pore size distribution profiles (b) of N-C, ZnO/Zn-N-C and Zn-N-C. | |
|
|
Table 1 Specific surface area, average pore volume and pore size for the as-obtained N-C, ZnO/Zn-N-C and Zn-N-C. |

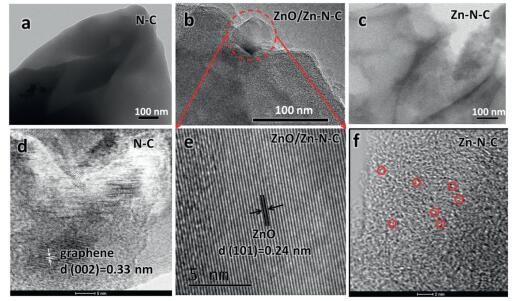
In order to deeply understand the electrocatalytic properties of N-C, Zn-N-C and ZnO/Zn-N-C, their TEM images of were taken to investigate their morphology and structure. As can be seen from Figs. 3a and b, N-C from pure CTS and ZnO/Zn-N-C displayed a clearly compact and amorphous carbon structure, and the obvious solid could be seen in the ZnO/Zn-N-C sample but not in N-C. In comparison, the Zn-N-C, as shown in Fig. 3c, exhibited a typically smooth and nearly transparent graphene-like structure without the presence of solid nanoparticles.

|
Download:
|
| Fig. 3. TEM images for (a) N-C, (b) ZnO/Zn-N-C and (c) Zn-N-C, respectively. BF/HAADF-STEM images for (d) N-C and (f) Zn-N-C, respectively. The representative Zn single atom was indicated by red circle in Zn-N-C. (e) HRTEM image for ZnO/Zn-N-C. | |
Bright field/high-angle-annular dark field scanning transmis-sion electron microscopy (BF/HAADF-STEM) pair images for N-C and Zn-N-C were collected, too. Obviously, the interlayer spacing (d =0.33 nm) consistent with the graphene plane (002) was observed (Fig. 3d), suggesting that N-C from pure chitosan exhibited some degree of graphitization after the simple pyrolysis. Fig. 3f revealed that the Zn was uniformly distributed in the Zn-N-C ultrathin carbon skeleton. Furthermore, in the HRTEM image (Fig. 3e) for ZnO/Zn-N-C, the interlayer spacing (0.24 nm) consistent with the (101) plane of ZnO was found, confirming that ZnO presented in the ZnO@Zn-N-C catalyst. These above results confirmed that ZnO was present in ZnO/Zn-N-C but not in N-C and Zn-N-C.
As shown in Fig. 4a, the position of absorption threshold for Zn-N-C in Zn K-edge XANES spectra revealed that the valence state (situated +2) of zinc species was present in Zn-N-C. The Fourier transforms of EXAFS spectra (FT-EXAFS) in Fig. 4b indicated that an obvious peak centering at ~1.32 Å in the Zn-N-C catalyst meant a similar Zn-N coordination. More importantly, the atomic Zn element was dispersed in the as-prepared Zn-N-C catalyst, because the prepared Zn-N-C catalyst did not displayed metallic signal peaks of Zn-Zn interactions as those in Zn foil. Therefore, the results of the obtained EXAFS spectra for Zn-N-C indicated that Zn-N4 instead of Zn-Zn/Zn-N2 as the main coordination mode of Zn atoms dominated in the Zn-N-C catalyst.

|
Download:
|
| Fig. 4. (a) Zn K-edge XANE spectra and (b) Fourier transformed (FT) k2-weighted χ(k) function of the EXAFS spectra for Zn K-edge of Zn-N-C and Zn foil. | |
The ORR catalytic properties of Zn-N-C were first investigated using CV in 0.1 mol/L KOH aqueous solution with either N2 or O2 saturation. As seen in Fig. 5a, all of the materials showed an obvious ORR peak in 0.1 mol/L KOH with O2 saturation instead of N2 saturation. More importantly, in the O2-saturated 0.1 mol/L KOH the voltammogram of the Zn-N-C showed a prominent ORR cathodic peak at 0.82 VRHE, which was not only more positive than those of N-C (0.71 VRHE) and ZnO/Zn-N-C (0.72 VRHE), but also a little positive than that of Pt/C (0.83 VRHE), indicating that the remarkable electrocatalytic activity of Zn-N-C for ORR.

|
Download:
|
| Fig. 5. (a) CV curves of N-C, ZnO/Zn-N-C, Zn-N-C and Pt/C in 0.1 mol/L KOH at a scan rate of 50 mV/s, (b) LSV curves for N-C, ZnO/Zn-N-C, Zn-N-C and 20 wt% Pt/C in O2- saturated 0.1 mol/L KOH with a rotation speed of 1600 rpm, (c) RDE voltammograms of Zn-N-C at different rotation speeds, (d) orresponding K-L plots and the electron transfer numbers (inset) of Zn-N-C, (e) Long-term stability and (f) alcohol tolerance tests of Zn-N-C and Pt/C using the current-time (i-t) method. | |
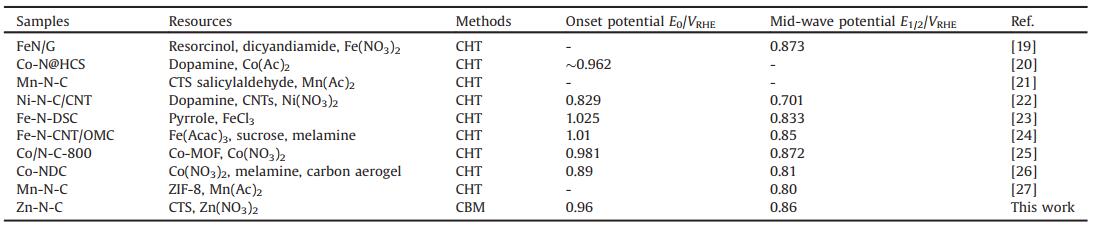
To further assess the ORR catalytic activity of Zn-N-C, linear sweep voltammetry (LSV, Fig. 5b) was conducted at a sweep rate of 10 mV/s in 0.1 mol/L KOH (O2 saturated) at 1600 rpm. In addition, N-C, ZnO/Zn-N-C and the commercial 20 wt% Pt/C were used for comparison. The obtained Zn-N-C had an onset potential (E0 = 0.96 VRHE) together with a mid-wave potential (E1/2 = 0.86 VRHE), which were more positive than those of the commercial 20 wt% Pt/C (E0 = 0.94 VRHE and E1/2 = 0.81 VRHE). The Zn-free N-C and ZnO/Zn-N-C catalyst exhibited poor ORR activites, indicating that the Zn-N species were crucial for the enhancement of the ORR performance, but the presence of ZnO showed negative effect for ORR. Especially, the obtained Zn-N-C catalyst displayed a comparable ORR performance with other M-N-C catalysts, as shown in Table 2. Therefore, it is believed that reasonable introduction of biomass materials consisting of reasonable nitrogen content together with zinc salts can be possibly prepare a Zn-N-C catalyst with excellent electrochemical performance by using the simple and facile CBM.
|
|
Table 2 Resources and methods of M-N-C and their ORR performance in alkaline solution. |
To analyze the kinetics of the prepared Zn-N-C electrode, RDE voltammetry was conducted for Zn-N-C in the O2-saturated solution at various rotation speeds. The voltammetric profiles exhibited a current density increased with the rotating rate increasing, as shown in Fig. 5c. The corresponding K-L plots (Fig. 5d) derived from Fig. 5c was in agreement with a good linearity at various potentials, which indicated that first-order reaction kinetics about the ORR procedure [41]. The electron transfer number (n) was obtained based on the slopes of the K-L plots at various potentials. As seen in Fig. 5d (inset), the transferred electron numbers during ORR on the Zn-N-C electrode were 4.01, 3.90, and 3.88 at 0.2, 0.3 and 0.4 VRHE, respectively, confirming a four-electron transfer during the ORR procedure catalyzed by Zn-N-C.
Catalytic stability is one of major concerns in fuel cell applications, thus, Zn-N-C was further subjected to a chronoam-perometric durability evaluation in the 0.1 mol/L KOH electrolyte with O2 saturation. As exhibited in Fig. 5e, after 10000 s, Zn-N-C lost 21.0% of its initial current compared with 44.4% for Pt/C, which meant that the durability of the Zn-N-C catalyst was superior to that of the commercial 20 wt% Pt/C. The results confirmed that Zn-N-C was a promising noble-metal-free ORR catalyst with high activity and excellent durability that could replace Pt/C.
Methanol-tolerance is another critical issue for fuel cells. Therefore, the methanol crossover effect of Zn-N-C was compared to that of Pt/C by the addition of 2.0 mol/L methanol at 100 s. For Pt/C, the addition of methanol resulted in significant current density decrease of 52.5% after 1000 s (Fig. 5f). In contrast, the Zn-N-C sample maintained a stable current response in current density (88.4%) after 1000 s, indicating a good methanol tolerance.
In summary, the Zn-N-C catalyst was prepared from CTS via a simple and facile carbon bath method. The XSP results confirmed that Zn-N structure simultaneously presented in Zn-N-C. The resulting Zn-N-C catalyst delivered high ORR activity: E0 = 0.96 VRHE and E1/2 = 0.86 VRHE, which were more positive than those of the commercial 20 wt% Pt/C (E0: 0.94 VRHE and E1/2: 0.81 VRHE), respectively. Furthermore, the Zn-C-N catalyst also gave better catalytic durability and methanol tolerance for ORR in alkaline electrolyte (0.1 mol/L KOH) than the commercial 20 wt% Pt/C catalyst, due to the presence of Zn-N together with a larger BET surface area.
AcknowledgmentThis work was supported by the National Natural Science Foundation of China (No. 21865025).
| [1] |
M.K. Debe, Nature 486 (2012) 43-51. DOI:10.1038/nature11115 |
| [2] |
J. Xiao, Y. Xu, Y. Xia, J. Xi, W. Shuai, Nano Energy 24 (2016) 121-129. DOI:10.1016/j.nanoen.2016.04.026 |
| [3] |
J.S. Yu, G.C. Chang, Y. Wei, C. Hui, Chin. Chem. Lett. 21 (2010) 983-986. |
| [4] |
Y. Wang, F. Yu, M. Zhu, et al., J. Mater. Chem. A 6 (2018) 2011-2017. DOI:10.1039/C7TA08607E |
| [5] |
Z. Geng, W. Lu, F. Cao, Z. Xiao, X. Zheng, J. Power Sources 302 (2016) 114-125. DOI:10.1016/j.jpowsour.2015.10.055 |
| [6] |
J.J. Xu, C.H. Xiao, S.J. Ding, Chin. Chem. Lett. 28 (2017) 748-754. DOI:10.1016/j.cclet.2016.12.006 |
| [7] |
P. Yin, T. Yao, Y. Wu, et al., Angew. Chem. 128 (2016) 10958-10963. DOI:10.1002/ange.201604802 |
| [8] |
Q. Wang, Y. Lei, Y. Zhu, et al., ACS Appl. Mater. Interfaces 10 (2018) 29448-29456. DOI:10.1021/acsami.8b07863 |
| [9] |
L. Hu, F. Yu, H. Yuan, et al., Chin. Chem. Lett. 30 (2019) 624-629. DOI:10.1016/j.cclet.2018.10.039 |
| [10] |
Q. Wei, G. Zhang, X. Yang, et al., ACS Appl. Mater. Interfaces 9 (2017) 36944-36954. DOI:10.1021/acsami.7b12666 |
| [11] |
L. Shi, T. Wu, Y. Wang, et al., Materials 10 (2017) 1030. DOI:10.3390/ma10091030 |
| [12] |
Y. Wang, M. Zhu, G. Wang, et al., Nanomaterials 7 (2017) 404. DOI:10.3390/nano7110404 |
| [13] |
Y. Lei, Q. Shi, C. Han, et al., Nano Res. 9 (2016) 2498-2509. DOI:10.1007/s12274-016-1136-4 |
| [14] |
Y. Jiao, Y. Zheng, M. Jaroniec, S.Z. Qiao, Chem. Soc. Rev. 46 (2015) 2060-2086. |
| [15] |
J. Li, S. Chen, W. Li, et al., J. Mater. Chem. A 6 (2018) 15504-15509. DOI:10.1039/C8TA05419C |
| [16] |
G. Wu, K.L. More, C. Johnston, P. Zelenay, Science 332 (2011) 443-447. DOI:10.1126/science.1200832 |
| [17] |
J. Liu, M. Jiao, L. Lu, et al., Nat. Commun. 8 (2017) 16160. DOI:10.1038/ncomms16160 |
| [18] |
A. Zitolo, V. Goellner, V. Armel, et al., Nat. Mater. 14 (2015) 937-942. DOI:10.1038/nmat4367 |
| [19] |
J. Cao, X. Jia, M. Guo, et al., Sustain. Energy Fuels 2 (2018) 169-174. DOI:10.1039/C7SE00458C |
| [20] |
S. Cai, Z. Meng, H. Tang, Y. Wang, P. Tsiakaras, Appl. Catal. B:Environ. 217 (2017) 477-484. DOI:10.1016/j.apcatb.2017.06.008 |
| [21] |
R. Zhang, J. Zhang, F. Ma, W. Wang, R. Li, J. Fuel Chem.Technol. 42 (2014) 467-475. DOI:10.1016/S1872-5813(14)60022-0 |
| [22] |
Y. Gao, L. Wang, G. Li, et al., Int. J. Hydrogen Energy 43 (2018) 7893-7902. DOI:10.1016/j.ijhydene.2018.03.043 |
| [23] |
Z. Huang, H. Pan, W. Yang, et al., ACS Nano 12 (2018) 208-216. DOI:10.1021/acsnano.7b05832 |
| [24] |
L. Zhao, Q. Wang, X. Zhang, et al., ACS Appl. Mater. Interfaces 10 (2018) 35888-35895. DOI:10.1021/acsami.8b09197 |
| [25] |
Y. Bai, D. Yang, M. Yang, et al., ChemElectroChem 6 (2019) 2546-2552. DOI:10.1002/celc.201900343 |
| [26] |
Z. Chen, Q. Wang, X. Zhang, et al., Sci. Bull. 63 (2018) 548-555. DOI:10.1016/j.scib.2018.04.003 |
| [27] |
J. Li, M. Chen, D.A. Cullen, S. Hwang, G. Wu, Nat. Catal. 1 (2018) 935-945. DOI:10.1038/s41929-018-0164-8 |
| [28] |
Y. Luo, J. Zhang, M. Kiani, et al., Ind. Eng. Chem. Res. 57 (2018) 12087-12095. DOI:10.1021/acs.iecr.8b02744 |
| [29] |
M. Rinaudo, Prog. Polym. Sci. 31 (2006) 603-632. DOI:10.1016/j.progpolymsci.2006.06.001 |
| [30] |
C. Huang, H. Zhang, Z. Sun, Z. Liu, Sci. China Chem. 53 (2010) 1502-1508. DOI:10.1007/s11426-010-4004-1 |
| [31] |
M.N.V. Ravi Kumar, React. Funct. Polym. 46 (2000) 1-27. DOI:10.1016/S1381-5148(00)00038-9 |
| [32] |
E. Guibal, Prog. Polym. Sci. 30 (2005) 71-109. DOI:10.1016/j.progpolymsci.2004.12.001 |
| [33] |
J. Huang, Y. Liang, H. Hu, et al., J. Mater. Chem. A 5 (2017) 24775-24781. DOI:10.1039/C7TA08046H |
| [34] |
J. Qu, Q. Hu, K. Shen, et al., Carbohyd. Res. 346 (2011) 822-827. DOI:10.1016/j.carres.2011.02.006 |
| [35] |
L. Wang, M. Liu, G. Wang, et al., J. Alloy. Compd. 776 (2019) 43-51. DOI:10.1016/j.jallcom.2018.10.214 |
| [36] |
M. Liu, X. Guo, L. Hu, et al., ChemNanoMat. 5 (2019) 187-193. |
| [37] |
L. Hu, Z. Wei, F. Yu, et al., J. Energy Chem. 39 (2019) 152-159. DOI:10.1016/j.jechem.2019.01.018 |
| [38] |
R. Arsat, M. Breedon, M. Shafiei, et al., Chem. Phys. Lett. 467 (2009) 344-347. DOI:10.1016/j.cplett.2008.11.039 |
| [39] |
J. Zhu, K. Li, M. Xiao, et al., J. Mater. Chem. A 4 (2016) 7422-7429. DOI:10.1039/C6TA02419J |
| [40] |
J. Zhang, H. Zhou, J. Zhu, et al., ACS Appl. Mater. Interfaces 9 (2017) 24545-24554. DOI:10.1021/acsami.7b04665 |
| [41] |
S.H. Ahn, X. Yu, A. Manthiram, Adv. Mater. 29 (2017) 1606534. DOI:10.1002/adma.201606534 |