 2020, Vol. 31


b College of Aeronautics and Astronautics, National University of Defense Technology, Changsha 410073, China
Today, electromagnetic pollution has become a new environmental problem, and seeking for practical absorbents is an effective way to solve this problem. In recent years, 2D transition metal dichalcogenides (TMDCs), especially MoS2, have received great attentions due to their unique electrical properties, which makes them promising candidates for microwave absorbents [1-3].
Researches on the preparation and microwave absorption performances of 2D MoS2 nanosheets have arisen recently. Up to now, there are many strategies to obtain MoS2, such as mechanical cleavage [4], intercalation exfoliation [5, 6], chemical vapor deposition [7] and hydrothermal method [8]. Among these strategies, one-step hydrothermal way is a simple and widely used method to prepare MoS2 nanosheets. In 2016, Liang et al. [8] firstly investigated the microwave absorption performance of MoS2 nanosheets prepared by hydrothermal method and proved that MoS2 was an excellent absorbent. The minimum reflection loss (RL) could reach -47.8 dB with the thickness of only 2.2 mm. To further control the structure and morphology, 3D MoS2 nanospheres stacked by nanosheets was obtained, and the MoS2/PVDF showed a wide effective bandwidth in the range of 2–40 GHz [9]. Based on this method, various MoS2-based composites can also be obtained. 3D rGO/MoS2 composite was prepared by this method and had great advantages in the field of lightweight absorbent [10]. Interestingly, NiS2@MoS2 core-shell composite was synthesized by two-step hydrothermal process. MoS2 directly grew on the surface of NiS2 core. Synergistic effect and multiple reflection between NiS2 and MoS2 made the composite a better absorbent than single component [11].
As mentioned above, hydrothermal way is a mature method for synthesizing MoS2, and it is feasible to regulate the morphology and construct composites [12, 13]. However, there is a lack of systematic process optimization researches. At present, only a few researchers investigated the impacts of reaction temperature on microwave absorption properties of MoS2 roughly but without further insights on the mechanism [14].
For these reasons, we proposed to synthesize MoS2 nanomaterials vis a hydrothermal method, and investigated the effects of reaction condition, including reaction temperature, reaction time and the ratio of Mo source to S source (Mo:S) in precursor, on the physicochemical properties and microwave absorption properties of MoS2 deeply to optimize the process. We tried to clarify the mechanism of microwave absorption, which would provide reference for the study and practical application of MoS2.
In this paper, MoS2 nanosheets were obtained via a hydrothermal preparation. Thioacetamide (CH3CSNH2) was purchased from Sinopharm chemical reagent Beijing Co., Ltd. Sodium molybdate (Na2MoO4·2H2O) was purchased from Chemical reagent Tianjin Co., Ltd. All reagents were used as received without further purification or grind. A typical procedure was as follows: 0.01 mol Na2MoO4·2H2O and 0.035 mol CH3CSNH2 were dissolved in 100 mL deionized water under vigorous stirring for 15 min. The solution was transferred into a 150 mL Teflon-lined stainless steel autoclave. The autoclave was heated at 160 ℃ for 24 h, then cooled to room temperature. The obtained product, named sample 1–1, was collected by centrifugation and washed with deionized water and ethanol for several times. After that, the products were dried at 60 ℃ under vacuum. Sample 1–2 and sample 1–3 were heated at 180 ℃ and 200 ℃, respectively. Then sample 1–3 was annealed at 800 ℃ for 2 h, named sample 1–4. When the optimum reaction temperature was determined, reaction time was change to 12 h, 18 h and 24 h, respectively. When the optimum reaction time was also determined, the ratio of Mo source to S source was changed to 1:2, 1:2.5, 1:3, 1:3.5, 1:4, 1:4.5, respectively. Then the paraffin and sample were weighed to achieve a mass ratio of 2:3. The paraffin was melted at 80 ℃, then the product was added to the melted paraffin under vigorous stirring. The MoS2/paraffin was cooled to room temperature. A special mold was then used to prepare coaxial ring samples with an inner diameter of 3 mm, an outer diameter of 7 mm and a thickness of 2–4 mm.
X-ray diffraction (XRD) patterns were recorded by using a Rigaku TTRIII X-ray diffractometer with Cu Kα radiation. Scanning electron microscopy (SEM) images were obtained by Hitachi S4800. The transmission electron microscopy (TEM) images were obtained by a JEM-2100 F field emission electron microscope. X-ray photoelectron spectra (XPS) was carried out by Thermo ESCALAB 250Xi with Al Kα as the excitation source. The BET test was carried out by Micromeritics ASAP 2460. ST2722 powder resistivity tester was used to measure the conductivity. A vector network analyzer (VNA) was used to measure electromagnetic properties at 2–18 GHz by Agilent 8720ET.
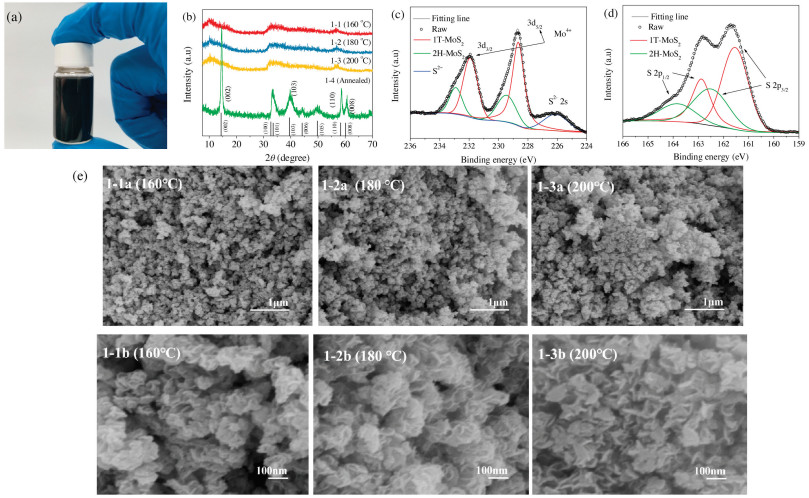
The first part investigated the properties of MoS2 prepared at different reaction temperatures (Fig. 1). The composition of hydrothermal products was confirmed by the XRD (Fig. 1b). We could see that the main diffraction peaks of three samples (1–1, 1–2 and 1–3) were similar, which indicated that the reaction temperature had no significant effect on the crystal phase. The main diffraction peaks of annealed sample (1–4) could be well indexed to 2H-MoS2 (JCPDS No. 37-1492), which proved that the as-synthesized products were MoS2. For sample 1–1, 1–2 and 1–3, the wide diffraction peaks implied the nanosized nature of the products, and the XRD patterns were in good agreement with that of few layered MoS2 [15]. The (002) diffraction peak was not significant and shifted to low angle, indicating an interlayer expansion. XPS was used to further analyze the phase and chemical composition of MoS2 (Figs. 1c and d). Generally, there are three different phases about MoS2, including 1T, 2H and 3R, and the sample was a mixed phase of 1T-MoS2 and 2H-MoS2 [16]. Two peaks of Mo 3d5/2 and 3d3/2 orbitals at 228.6 eV and 231.8 eV were confirmed to Mo4+ state and two peaks of S 2p3/2 and 2p1/2 orbitals at 161.4 eV and 162.7 eV were confirmed to S2- of 1T-MoS2; two peaks of Mo 3d5/2 and 3d3/2 orbitals at 229.6 eV and 232.8 eV were confirmed to Mo4+ state and two peaks of S 2p3/2 and 2p1/2 orbitals at 162.5 eV and 163.8 eV were confirmed to S2- of 2H-MoS2. In addition, S 2s peaks at 226.2 eV means the chemical states of S species bonding with Mo [11].

|
Download:
|
| Fig. 1. (a) Hydrothermal product of MoS2; (b) XRD patterns of MoS2 prepared at 160 ℃, 180 ℃, 200 ℃ and annealed sample; XPS survey spectrum of MoS2 prepared at 180 ℃ (c) Mo 3d and (d) S 2p;(e) SEM images of MoS2 prepared at (1-1) 160 ℃, (1–2) 180 ℃ and (1–3) 200 ℃. | |
The structure and morphology of MoS2 were characterized by SEM, as showed in Fig. 1e. Fig. 1e showed that the structure of sample 1-1 (160 ℃) was a randomly stacking of 2D nanosheets. For sample 1–2 (180 ℃), the structure presented a more regular morphology of flower-like nanospheres. When the temperature was up to 200 ℃, part of flower-like nanospheres were destroyed, and the stack was partially disordered. We took sample 1–2 as example to further study the morphology of MoS2. The TEM images were shown in Figs. S1a and b (Supporting information), which suggested that MoS2 nanomaterials had only few layers with thin edges and a petal-like morphology. It could be observed that the layered structures were stacked on each other, and the interlayer distance was 0.70 nm, which was larger than that of theoretical value of 0.65 nm of the hexagonal MoS2. This might be due to the intercalation of small molecules [17], such as NH4+.
To evaluate the microwave absorption performance of MoS2, the coaxial samples of MoS2/paraffin were made and studied by VSM. According to the transmission theory, for single-layer microwave absorbent, the RL (Reflection Loss) can be expressed by following equations [18]:
|
(1) |
where Z0 is the impedance of air; Zin is the input impedance, which can be expressed as:
|
(2) |
where εr and μr are the complex permittivity and permeability of the absorbent, respectively; f is the frequency of incident electromagnetic wave; d is the thickness of the absorber and c is the velocity of light in free space.
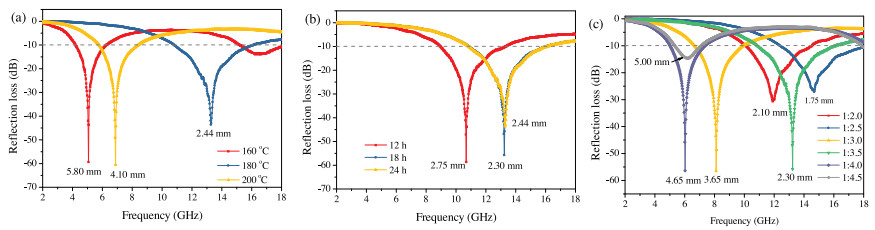
Firstly, we calculate the RL values of the MoS2 prepared under different reaction conditions at different thicknesses, and the matching thickness of each samples can be determined using the RL curves (Figs. S2, S5 and S8 in Supporting information). Then, we made a summary of the RL curves of MoS2 at their matching thicknesses, as shown in Fig. 2.

|
Download:
|
| Fig. 2. The theoretical RL curves of MoS2 prepared under different (a) reaction temperatures, (b) reaction time and (c) Mo:S in precursor at the matching thickness in the frequency range of 2–18 GHz. | |
According to Fig. 2a, we can visually compare the microwave absorption performance of MoS2 prepared under different temperatures, and microwave absorption indicators were summarized in Table S1 (Supporting information). It could be found that the minimum RL of samples 1–1 and 1–3 could reach -60 dB, which presented excellent performances compared with reported values (Table 1). Although the minimum RL of sample 1–2 was only -43.62 dB, it was still good enough. In addition, compared with samples 1-1 and 1–3, the matching thickness of sample 1–2 was decreased to 2.44 mm and the effective bandwidth was up to 5.33 GHz. It should be recognized that when the RL was below -10 dB, 90% of the microwave has been attenuated, and the improvement in effective bandwidth and matching thickness was more meaningful and practical. Therefore, we think that sample 1–2 had the best comprehensive absorption performance.
|
|
Table 1 The microwave absorption properties of some common absorbents. |

After determining the effects of reaction temperature on microwave absorption properties of MoS2, we investigated the reaction time. The XRD and SEM images were presented in Figs. S3 and S4 (Supporting information), the as-synthesized MoS2 were also nanosheets and stacked into flower-like structure. Fig. S5 (Supporting information) and Fig. 2b showed the RL curves of MoS2 in the frequency range of 2–18 GHz and the microwave absorption indicators were summarized in Table S2 (Supporting information). Considering three indicators comprehensively, sample 2-2 had the best performance, that was to say, when the reaction time was 18 h, the hydrothermal product MoS2 was more favorable for absorbing microwave.
Also, the effects of Mo:S in precursor on microwave absorption performances of MoS2 were studied. The XRD and SEM images were presented in Figs. S6 and S7 (Supporting information). Fig. S8 (Supporting information) and Fig. 2c showed the RL curves of MoS2 in the frequency range of 2–18 GHz and the microwave absorption indicators were summarized in Table S3 (Supporting information). Considering three indicators comprehensively, sample 3–4 had the best performance, that was to say, when the Mo:S was 1:3.5, the hydrothermal product MoS2 was more favorable for absorbing microwave. It was worth mentioned that when the Mo:S was 1:2.5, sample 3-2 had the thinnest matching thickness and the widest effective bandwidth.
In summary, the final results showed that when the reaction temperature was 180 ℃, reaction time was 18 h, and Mo:S was 1:3.5, the MoS2 had the best performance: Its minimum reflection loss could reach 55.78 dB, and the corresponding matching thickness was 2.30 mm with a wide effective bandwidth of 5.17 GHz.
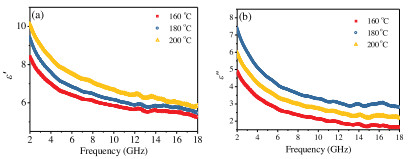
MoS2 is considered to be a typical dielectric loss absorbent with large dielectric constant. In order to find out the reason why the microwave absorption properties of MoS2 was optimized. We took samples 1-1, 1–2 and 1–3 as examples and studied the effects of hydrothermal conditions on the dielectric properties of MoS2. Figs. 3a and b showed the dielectric frequency spectra of three samples. For all the samples, the ε' decreased with increasing frequency and fluctuated between 10.5 to 5.3. The ε' value of sample 1–3 was the highest, which implyed the strongest ability to propagate and store electromagnetic waves. The ε" showed the same trend with ε' in 2–18 GHz and fluctuated between 7.5~1.6. The ε" value of sample 1–2 was the highest, which implyed the strongest ability to attenuate electromagnetic wave, and correspondingly, sample 1–2 showed the best microwave absorption performance. Other samples had the similar pattern, as shown in Figs. S9 and S10 (Supporting information).

|
Download:
|
| Fig. 3. The complex permittivity of MoS2 prepared under different reaction temperatures: (a) the real part (ε') and (b) the imaginary part (ε"). | |
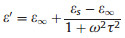
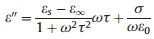
In general, the dielectric loss is mainly derived from various polarization effects and can be expressed by the Debye theory as follows [27]:
|
(3) |
|
(4) |
Where σ is the dc conductive, ω is the angular frequency, τ is the polarization relaxation time, εs is the static permittivity, and ε∞ is the relative dielectric permittivity at the high frequency limit.
The ε' and ε" exhibited a remarkable dispersion effect, which could be expressed by Eqs. (3) and (4), and this effect may be attributed to the failure of induced charges to follow the electromagnetic field, causing a reduction in the electronic oscillations at high frequency [28]. As reported previously, the relaxation located in 2–18 GHz were attributed to polarization of the defects [29]. MoS2 synthetized by aggressive hydrothermal method may produce many defects, which was conductive to enhance microwave attenuation. On the other hand, large specific surface area benefited to provide more defect sites. BET analysis showed that the specific surface area of three samples were 57.3 m2/g, 84.7 m2/g and 63.6 m2/g, respectively. Combined with the morphology observation, sample 1–2 had the largest specific surface area, which may be due to the regular morphology, reducing the disordered stacking of MoS2 nanosheets. Therefore, temperature condition is very important for regulating the morphology of MoS2 and improved electromagnetic properties.
In order to further understand the dielectric properties, conductivity (σ) of the three samples was measured. It was known from Eq. (4) that ε" was positively correlated with the conductivity. The conductivity of samples was 2.15×10 -3 S/m, 3.31×10 -3 S/m and 2.08×10 -3 S/m, respectively. Sample 1–2 had the largest σ, and the corresponding ε" was also the largest. Ning et al. [30] proposed that when the conductivity was large enough, the conductive paths could be established. Then the electrons from MoS2 could migrate along the nanosheets or hop across defects, which would increase the ε" value, contributing to dielectric loss. The conductivity of our samples far exceeded the reported value, which was more propitious to conductivity loss.
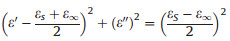
Next, we took sample 1–2 as example to discuss the microwave absorption mechanism of MoS2. According to the above two Eqs. (3) and (4), the relationship between ε' and ε" can be deduced as follows:
|
(5) |
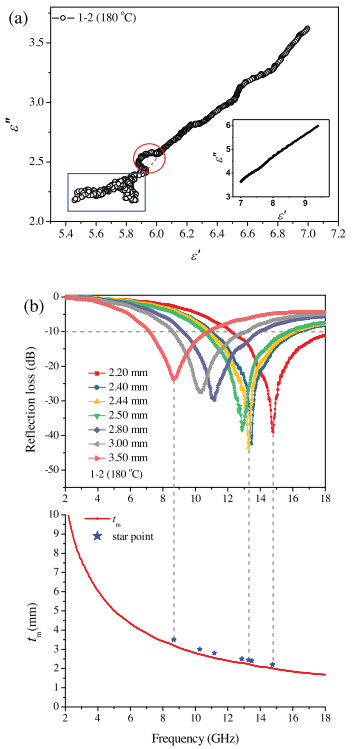
The curve of ε' versus ε" is also called the Cole-Cole semicircle, and each semicircle corresponds to a Debye relaxation process. As shown in Fig. 4a, for better illustration, we divided the graph into two parts, an obvious semicircle could be observed, corresponding to a relaxation process, but in the inset figures, it was hard to describe the Cole-Cole curve, which may involve multiple relaxation process. Other samples had the similar pattern, as shown in Figs. S11–S13 (Supporting information), which indicated the same various polarization process.

|
Download:
|
| Fig. 4. (a) The ε'-ε" curves, (b) RL curves and tm-λ/4- curves of MoS2 prepared under 180 ℃ (sample 1–2). | |
In addition, it could be observed that the RL peak position moved toward low frequency with increasing matching thickness. In general, the peak frequency (fm) and the matching thickness (tm) corresponding to the RL peak could be described by a quarter-wavelength model [31, 32]:
|
(6) |
where λ is the electromagnetic wavelength in free space, λ0 is the propagating wavelength in the material; εr and μr are the complex permittivity and permeability of the absorbent, respectively; c is the velocity of light in free space.
For single-layer microwave absorbent, when the matching thickness conformed to quarter-wavelength model, the incident and reflected waves in the absorbent were out of phase by 180°, generating an interference phenomenon. The tm curves were calculated by Eq. (6), and the tRL were simulated by Eqs. (1) and (2) and represented by start points. Fig. 4b showed the tm-λ/4 curve of sample 1–2 and the tRL was expressed with star points. It could be well explained that the RL peak position moved toward low frequency with increasing matching thickness. And the star points fell above the tm-λ/4 curve, indicating that the tRL values were larger than tm values. The reason may be that quarter-wavelength model only involved interference cancellation, but Eqs. (1) and (2) described a comprehensive microwave absorption performance. The different between tm and tRL may be caused by other absorption mechanism, such as dielectric loss, as mentioned above. Other samples had the similar pattern, as shown in Figs. S14–S16 (Supporting information), which indicated the same the destructive interference phenomenon.
In summary, MoS2 nanosheets had been synthesized by a hydrothermal method under various reaction conditions. The results showed that when the reaction temperature was 180 ℃, reaction time was 18 h, and Mo:S was 1:3.5, the MoS2 had the best performance: Its minimum reflection loss could reach -55.78 dB, and the corresponding matching thickness was 2.30 mm with a wide effective bandwidth of 5.17 GHz. For the microwave absorp-tion mechanism of MoS2, there were mainly two ways: (1) the destructive interference of electromagnetic waves; (2) various polarization phenomena such as defects dipole polarization. Further studies revealed that the improved performance of MoS2 nanosheets were mainly attibuted to the following points: (1) high dielectric constant; (2) large numbers of defects; (3) high specific surface area. We believe that MoS2 is a candidate for a practical microwave absorbent. This paper not only obtained microwave absorption materials with excellent performances, but also improved its characteristics through process optimization. We anticipated that our study could provides reference for the research and practical application of MoS2.
AcknowledgmentThe work was financially supported by the National Natural Science Foundation of China (No. 21403298).
Appendix A. Supplementary dataSupplementary material related to this article can be found, in the online version, at doi:https://doi.org/10.1016/j.cclet.2019.07.003.
| [1] |
Z.G. Wang, Q.L. Su, G.Q. Yin, et al., Mater. Chem. Phys. 147 (2014) 1068-1073. DOI:10.1016/j.matchemphys.2014.06.060 |
| [2] |
B. Radisavljevic, A. Radenovic, J. Brivio, V. Giacometti, A. Kis, Nat. Nanotechnol. 6 (2011) 147-150. DOI:10.1038/nnano.2010.279 |
| [3] |
Q.H. Wang, K. Kalantar-Zadeh, A. Kis, J.N. Coleman, M.S. Strano, Nat. Nanotechnol. 7 (2012) 699-712. DOI:10.1038/nnano.2012.193 |
| [4] |
K.S. Novoselov, D. Jiang, F. Schedin, et al., J. Am. Chem. Soc. 102 (2005) 10451-10453. |
| [5] |
Z.Y. Zeng, Z.Y. Yin, X. Huang, et al., Angew. Chem. Int. Ed. 50 (2011) 11093-11097. DOI:10.1002/anie.201106004 |
| [6] |
H. Bian, X.J. Zhang, D.X. Huang, N. Zhang, Chin. Chem. Lett. 30 (2019) 311-313. DOI:10.1016/j.cclet.2018.07.002 |
| [7] |
Y.H. Lee, X.Q. Zhang, W.J. Zhang, et al., Adv. Mater. 24 (2012) 2320-2325. DOI:10.1002/adma.201104798 |
| [8] |
X.H. Liang, X.M. Zhang, W. Liu, et al., J. Mater. Chem. C 4 (2016) 6816-6821. DOI:10.1039/C6TC02006B |
| [9] |
X.J. Zhang, S. Li, S.W. Wang, et al., J. Phys. Chem. C 120 (2016) 22019-22027. DOI:10.1021/acs.jpcc.6b06661 |
| [10] |
X. Ding, Y. Huang, S.P. Li, N. Zhang, J.G. Wang, Compos. Part A Appl. Sci. Manuf. 90 (2016) 424-432. DOI:10.1016/j.compositesa.2016.08.006 |
| [11] |
X.J. Zhang, S.W. Wang, G.S. Wang, et al., RSC Adv. 7 (2017) 22454-22460. DOI:10.1039/C7RA03260A |
| [12] |
Z.Y. Guo, Y. Zhong, Y. Liu, C.M. Mao, G.C. Li, Chin. Chem. Lett. 28 (2017) 743-747. DOI:10.1016/j.cclet.2016.10.007 |
| [13] |
C.J. Han, Z. Tian, H.L. Dou, X.M. Wang, X.W. Yang, Chin. Chem. Lett. 29 (2018) 606-611. DOI:10.1016/j.cclet.2018.01.017 |
| [14] |
X.L. Su, D. Wang, Q. Yan, et al., J. Mater. Sci.-Mater. Electron. 29 (2018) 4020-4029. DOI:10.1007/s10854-017-8344-x |
| [15] |
P. Joensen, R.F. Frindt, S.R. Morrison, Mater. Res. Bull. 21 (1986) 457-461. DOI:10.1016/0025-5408(86)90011-5 |
| [16] |
G. Eda, H. Yamaguchi, D. Voiry, et al., Nano Lett. 11 (2011) 5111-5116. DOI:10.1021/nl201874w |
| [17] |
D. Wang, X. Zhang, S. Bao, et al., J. Mater. Chem. A 5 (2017) 2681-2688. DOI:10.1039/C6TA09409K |
| [18] |
J.R. Liu, M. Itoh, K.I. Machida, Appl. Phys. Lett. 83 (2003) 4017-4019. DOI:10.1063/1.1623934 |
| [19] |
X. Tian, F.B. Meng, F.C. Meng, et al., ACS Appl. Mater. Interfaces 9 (2017) 15711-15718. DOI:10.1021/acsami.7b02607 |
| [20] |
T. Zhang, B. Xiao, P.Y. Zhou, et al., Nanotechnology 28 (2017) 355708. DOI:10.1088/1361-6528/aa7ae9 |
| [21] |
J.H. Luo, P. Shen, W. Yao, C.F. Jiang, J.G. Xu, Nanoscale Res. Lett. 11 (2016) 141-154. DOI:10.1186/s11671-016-1340-x |
| [22] |
J. Wang, X.Y. Lin, R.X. Zhang, R.X. Zhang, Z.Y. Chu, J. Alloys Compd. 743 (2018) 26-35. DOI:10.1016/j.jallcom.2018.01.118 |
| [23] |
Y. Zhang, Y. Huang, T. Zhang, et al., Adv. Mater. 27 (2015) 2049-2053. DOI:10.1002/adma.201405788 |
| [24] |
X.G. Huang, J. Zhang, M. Lai, T.Y. Sang, J. Alloys Compd. 627 (2015) 367-373. DOI:10.1016/j.jallcom.2014.11.235 |
| [25] |
P. Wang, L.F. Cheng, Y.N. Zhang, L.T. Zhang, J. Alloys Compd. 716 (2017) 306-320. DOI:10.1016/j.jallcom.2017.05.059 |
| [26] |
B. Zhao, G. Shao, B.B. Fan, et al., J. Mater. Chem. A 3 (2015) 10345-10352. DOI:10.1039/C5TA00086F |
| [27] |
M.S. Cao, J. Yang, W.L. Song, et al., ACS Appl. Mater. Interfaces 4 (2012) 6949-6956. DOI:10.1021/am3021069 |
| [28] |
V. Panwar, R.M. Mehra, Polym. Eng. Sci. 48 (2008) 2178-2187. DOI:10.1002/pen.21163 |
| [29] |
N. Tang, W. Zhong, C. Au, et al., J. Phys. Chem. C 112 (2008) 19316-19323. DOI:10.1021/jp808087n |
| [30] |
M.Q. Ning, M.M. Lu, J.B. Li, et al., Nanoscale 7 (2015) 15734-15740. DOI:10.1039/C5NR04670J |
| [31] |
I. Kong, S.H. Ahmad, M.H. Abdullah, et al., J. Magn. Magn. Mater. 322 (2010) 3401-3409. DOI:10.1016/j.jmmm.2010.06.036 |
| [32] |
B. Wang, J. Wei, Y. Yang, T. Wang, F.S. Li, J. Magn. Magn. Mater. 323 (2011) 1101-1103. DOI:10.1016/j.jmmm.2010.12.028 |