 2020, Vol. 31


b School of Basic Medicine, Xinxiang Medical University, Xinxiang 453003, China;
c College of Bioengineering and Food, Hubei University of Technology, Wuhan 430068, China
Fruit is one of the most widely consumed foods in the world and constitute an indispensable source of nutrients for human health such as sugars, vitamins and minerals [1]. The analysis of nutrition content in fruit is of extreme significance for determining edible quality and monitoring quality changes during the production and storage. Among various nutrients, sugars and vitamin C are considered as two capital important indicators for fruit evaluation. The sugars, including glucose, fructose and sucrose, are intimately related to the taste of fruit and are often used as indices of fruit development and ripening, which is beneficial for guiding fruit farmers to harvest reasonably and ensure the maximization of economic benefits [2, 3]. Otherwise, the vitamin C, an attractive index of foodstuff quality for consumers, is extensively used to assess the nutritional value and freshness of fruit, which has important practical significance for guiding preservation and consumption [3]. Consequently, the knowledge of exact qualitative and quantitative distribution of characteristic individual sugar and vitamin C in fruits is of capital importance to the quality classification, origin traceability and consumption guidance, which is conducive to the long-term and healthy development of fruits industry.
Current analytical methods for the determination of sugars and vitamin C rely mainly on chromatographic or spectroscopic techniques such as high-performance liquid chromatography (HPLC) [3-6], infrared spectroscopy [6, 7], nuclear magnetic resonance (NMR) [8, 9] and fluorescence spectroscopy [10]. Although these assays enable higher accuracy and sensitivity, they are suffering from drawbacks of complicated pre-processing, expensive instruments and professionals, which are not ideal for on-site quantification, especially in orchards. Accordingly, to better realize fast and reliable field test, developing an easy-to-operate and cost-effective device is imminent.
Paper-based microfluidic analytical device (μPAD) is deemed as an alternative approach for point-of-care food testing by virtue of its simplicity, low-cost and ease of handling [11-16]. As the compatibility and producibility of μPAD improve, so does the number of applications [17-20]. On the one hand, the μPAD integrated with signal reporters can provide field visual detection such as smartphones [21], scanners [22, 23] and even naked-eye. On the other hand, various physical [24] and chemical patterns [25], including ink-jet etching [26], laser treatment [27] and flexography printing [28], etc., make the industrial mass production of μPAD possible [29-31]. However, the general bare paper sensor is susceptible to interference by undesirable proteins, biomolecules or microorganism, which limits its wider practical application in complex real samples [19, 32]. In order to address this issue, zwitterionic polymer poly(carboxybetaine methacrylate) (pCBMA) has been proved to be an efficacious choice as its excellent dual capacity of high hydrophilicity and superior antibio-fouling performance [20]. Jiang's group [33-36] illustrated that PCB modified cellulose paper had excellent anti-fouling capacity and could successfully detect glucose in serum with a quicker analytic diffusion rate and higher sensitivity. Inspired by previous studies, the construction of high-efficiency paper device for rapid and simultaneous detection of multiple nutrients in fruits is a promising but challenging subject. Herein, we presented an economical and easy-to-use pCBMA-functionalized microfluidic paper-based analytical device (pCBMA-μPAD) for rapidly simultaneous detection of vitamin C, glucose, sucrose and fructose in complex fruits. The pCBMA was coated on the surface of cellulose filter (CF) using surface-initiated atom transfer radical polymerization (SI-ATRP), which was characterized by Fourier transform infrared spectra (FT-IR) and X-ray photoelectron spectroscopy measurement (XPS). As the pCBMA exhibited the outstanding features of superior hydrophilicity and ultra-low fouling, the pCBMA-μPAD enabled efficient and parallel detection of interest analytes in 3 min without a large number of reagents and samples. Qualitative analysis was performed by visual observation the specific color changes in the test zones, and quantitative results were achieved by recording the corresponding greyscale intensity. Additionally, the pCBMA-μPAD was successfully applied to the determination of vitamin C, glucose, sucrose and fructose in 9 fruits and the results were consistent with spectrum analysis events.
Fabrication and characterization of the pCBMA-μPAD. The simple protocol for fabricating pCBMA-μPAD, according to the previous work [35, 37], is mainly divided into three steps (Scheme 1). (i) The preparation of hydrophobic PDMS channels: The glass surface was first silanization via trialkoxysilane and then was coated with PDMS to pattern hydrophobic barriers, which finally followed by laser-cutting to create hydrophobic channels. (ii) The fabrication and characterization of pCBMA coated cellulose filter (pCBMA-CF): The Whatman No. 1 filter paper was used to pattern hydrophilic channels and the design of the branch-shaped paper sheet with reaction zone (5 mm diameter) and a straight channel (6 mm wide and 8 mm long) was carried out by AutoCAD software. After bare cellulose filter (bare-CF) was cut into size, the pCBMA was coated on the surface of CF using SI-ATRP, which was characterized by X-ray photoelectron spectroscopy measurement (XPS, Fig. S1 in Supporting information) and FT-IR (Fig. S2a in Supporting information). The detailed protocol was presented in Supporting information. (iii) The pCBMA-CF was mounted onto the patterned PDMS channels to form pCBMA-μPAD assay platform. The super-hydrophilicity and sensing properties between bare-CF and pCBMA-CF were compared and discussed in Figs. S2b and S3 (Supporting information).

|
Download:
|
| Scheme 1. (a) Schematic diagram for fabricating the pCBMA-μPAD: (i) The procedure of fabricating the hydrophobic PDMS channels, (ii) the procedure of coating pCBMA on the surface of CF and (iii) place the pCBMA-CF onto the patterned PDMS to form the pCBMA-μPAD assay platform. (b) The reaction scheme for grafting pCBMA onto cellulose substrate. | |
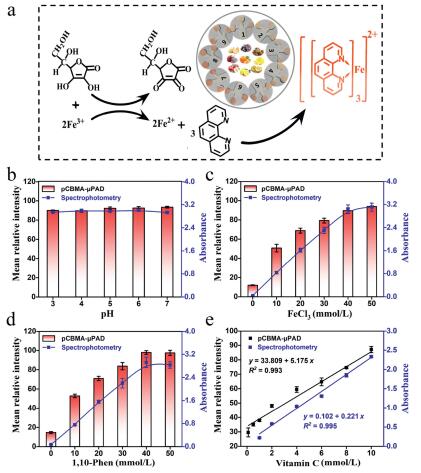
Colorimetric detection of vitamin C. The principle of vitamin C analysis is displayed in Fig. 1a, which is based on its excellent reducing ability that can reduce Fe from trivalent to divalent, and ferrous iron further couple with 1, 10-phenanthroline (1, 10-Phen) to generate a special orange-red chelate [38]. To realize the best analytical performance for vitamin C, we explored the effects of pH, time, concentration of FeCl3 and 1, 10-Phen on pCBMA-μPAD. As shown in Fig. 1b, the mean relative intensity was almost no change when the pH increased from 3.0 to 7.0, indicating the pH did not affect the color reaction. This phenomenon, for one thing is attributed to the ability of vitamin C to reduce Fe3+ under acidic and neutral conditions is not significantly different; for another, it is because the orange-red chelate is stable in the pH range of 2–9 [39]. Moreover, we found that the color reaction began to stabilize after 3 min (Fig. S4 in Supporting information). As a result, the mild condition (pH 6, 3 min) was selected in subsequent experiments. On the contrary, the chromogenic reagent had a great influence on color development. The chromogenic reagent was prepared with different concentrations of FeCl3 (10–50 mmol/L) and 1, 10-Phen (10–50 mmol/L) in a 1:3 (v/v) ratio. As shown in Figs. 1c and d, the mean relative intensity increased markedly with the increasing concentration of FeCl3 and 1, 10-Phen and tended to be a stable level when their concentration up to 40 mmol/L. Therefore, the 40 mmol/L FeCl3 and 40 mmol/L 1, 10-Phen were further chosen to pretreat the test zone for subsequent experiments. Under optimized conditions, a good linear correlation was obtained between the mean relative intensity and the vitamin C concentration ranging from 0.1 mmol/L to 10 mmol/L, with the correlation equation of y = 33.809 + 5.175x (y, mean relative intensity; x, vitamin C concentration, mmol/L), and the correlation coefficient was R2 = 0.993 (Fig. S5 in Supporting information, Fig. 1e). The detection limit was determined to be 0.179 mmol/L (LOD, defined as 3σ/S, σ = 0.309, σ refers to the standard deviation of the blank samples (n = 11), and S refers to the slope of the fitting standard curve). Concurrently, contrast experiments with spectrophotometry were accomplished, and all data were collected and analyzed at the characteristic peak (510 nm, Fig. S11a in Supporting information). Under the optimal experimental conditions (pH 6, 40 mmol/L FeCl3 and 40 mmol/L 1, 10-Phen), a good linear equation (y = 0.102 + 0.221x, R2 = 0.995, LOD = 0.149 mmol/L, σ = 0.011) was obtained. All above results indicate that pCBMA-μPAD not only possesses excellent detection performance for vitamin C, but also shows high consistency with spectrophotometry.

|
Download:
|
| Fig. 1. The detection for vitamin C by pCBMA-μPAD and spectrophotometry. (a) The reaction principle of vitamin C analysis. The effects of experimental conditions including (b) pH of system buffer, (c) the concentration of FeCl3 and (d) the concentration of 1, 10-Phen on pCBMA-μPAD and spectrophotometry. (e) Linear relationship between vitamin C concentration with gray intensity of pCBMA-μPAD (black) or absorbance of spectrophotometry (blue). All values are given as means ± SD (n ≥ 3). | |
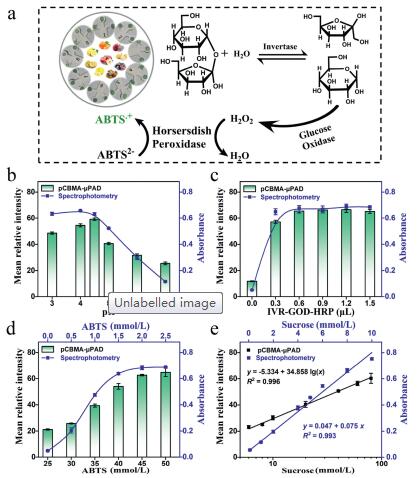
Colorimetric detection of sucrose and glucose. The glucose and sucrose assay are based on GOD-HRP and Inver-GOD-HRP enzymes mediated-oxidation ABTS, respectively [18]. The schematic diagram is displayed in Fig. 2a. Sucrose is first hydrolyzed by invertase to generate glucose, GOD further catalyzes glucose to produce H2O2, and then H2O2/HRP-mediated oxidation of ABTS generates a green substance. Compared with the analysis of sucrose, the GODHRP system without invertase was used for glucose analysis. Thus, this highly specific analysis of glucose served as the basis for accurate analysis of other sugars.

|
Download:
|
| Fig. 2. The detection for sucrose by pCBMA-μPAD and spectrophotometry. (a) The reaction principle of sucrose analysis. The effects of experimental conditions including (b) pH of buffer, (c) the amount of IVR-GOD-HRP and (d) the concentration of ABTS on pCBMA-μPAD and spectrophotometry. (e) Linear relationship between sucrose concentration with gray intensity of pCBMA-μPAD (black) or absorbance of spectrophotometry (blue). All values are given as means ± SD (n ≥ 3). | |
The optimization experiments of pH, IVR-GOD-HRP and ABTS for sucrose detection were carried out, respectively. As manifested in Fig. 2b, the proposed pCBMA-μPAD exhibited an optimal intensity at pH 4.5 system, indicating that the enzyme activity of IVR-GOD-HRP was the highest under this condition. In addition, the gray intensity increased and gradually up to a plateau when the IVR-GOD-HRP dose reached 0.6 μL (Fig. 2c) or ABTS concentration (Fig. 2d) reached 50 mmol/L. Hence, the acetate buffer (pH 4.5), IVR-GOD-HRP (0.6 μL) and ABTS (50 mmol/L) were selected to pretreat the detection area. On the optimal conditions, a linear response over the range of 6–80 mmol/L was obtained, with a correlation equation of y = -5.334 + 34.858lg(x) (y, mean relative intensity; x, sucrose concentration, mmol/L) and a correlation coefficient R2 = 0.996 (Fig. S7 in Supporting information, Fig. 2e). The detection limit as low as 0.097 mmol/L (σ = 1.128) was achieved. Correspondingly, the analysis of sucrose was implemented by spectrophotometry, and all data were collected at 414 nm characteristic peaks (Fig. S11b in Supporting information). Under the optimal experimental conditions (pH 4, IVR-GOD-HRP 1 mL, ABTS 45 mmol/L), a good linear equation of sucrose (y = 0.047 + 0.075x, R2 = 0.993, LOD = 0.160 mmol/L, σ = 0.004) was obtained.
For glucose assay, as the reaction principle of glucose and sucrose analysis is the same, the determination of glucose was based on the above optimal conditions, in which only the complex enzyme was replaced by the GOD-HRP with the same enzyme activity. As a result, a good correlation equation of y = -0.113 + 30.066lg(x) (y, mean relative intensity; x, glucose concentration, mmol/L) was realized with a correlation coefficient R2 = 0.988 (Fig. S8 in Supporting information) over the range of 2 — 100 mmol/L. The detection limit was low to 0.095 mmol/L (σ = 0.954). Moreover, an excellent linear relationship between glucose concentration and absorbance was also obtained (y = 0.047 + 0.075x, R2 = 0.993, LOD = 0.157 mmol/L, σ = 0.004). Compared with spectrophotometry, the pCBMA-coated paper sensor greatly shortens the incubation time (30 min, Fig. S6 in Supporting information) of the enzymatic reaction that enables the detection of glucose and sucrose fast and accurate.
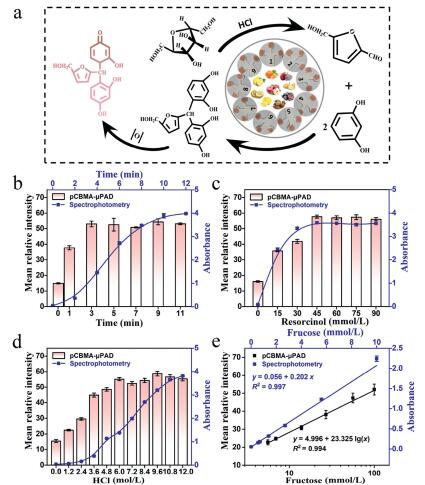
Seliwanoff test, a well-known specific chemical reaction for ketose, is often used to identify and quantify fructose. The schematic diagram of this assay is depicted in Fig. 3a. In short, in the presence of hydrochloric acid, fructose is oxidized to 4-hydroxymethyl furfural, which further reacts with resorcinol to form a red compound in a boiling water bath [40].

|
Download:
|
| Fig. 3. The detection for fructose by pCBMA-μPAD and spectrophotometry. (a) The reaction principle of fructose analysis. The effects of experimental conditions including (b) reaction time, (c) the concentration of resorcinol and (d) the concentration of HCl on pCBMA-μPAD and spectrophotometry. (e) Linear relationship between fructose concentration with gray intensity of pCBMA-μPAD (black) or absorbance of spectrophotometry (blue). All values are given as means ± SD (n ≥ 3). | |
To successfully manipulate this reaction on pCBMA-μPAD, the hot air condition was employed instead of boiling water bath. The exploration for the reaction temperature and time was prioritized. As shown in Fig. 3b, it took 8 min for the reaction to produce a stable signal in boiling water bath by spectrophotometry, while only 3 min for pCBMA-μPAD in 60 ℃ oven environment (Fig. S9 in Supporting information). Although the mean relative intensity increased as increasing temperature and time, we chose 60 ℃ for 3 min as the optimum reaction environment to avoid the scorched state of paper chip due to excessive temperature or time. Moreover, as shown in Figs. 3c and d, with the increasing concentration of resorcinol or hydrochloric acid, the mean relative intensity increased and tended to be a plateau when resorcinol exceeded 45 mmol/L or hydrochloric acid over 6 mol/L. Consequently, 45 mmol/L resorcinol, 6 mol/L hydrochloric acid and deionized water were selected to prepare a color reagent with a volume ratio of 3:5:4 to pretreat the test area for further test. Under the optimal conditions, a good linear calibration equation was determined as y = 4.996 + 23.325lg(x) (y, mean relative intensity; x, fructose concentration, mmol/L) with R2 = 0.994 (Fig. S10 in Supporting information, Fig. 3e). The detection limit was achieved to be 0.140 mmol/L (σ = 1.091). Meanwhile, the determination of fructose was also proceeded by spectrophotometry (Figs. 3b and e). All data were collected at 480 nm characteristic peaks (Fig. S11c in Supporting information), and a good linear equation was established as y = 0.056 + 0.202x (R2 = 0.997, LOD = 0.029 mmol/L, σ = 0.002). All the above results not only indicate that the two methods have good synchronization performance, but exhibit the advantage of micro-device that can significantly simplify the experimental steps for fructose analysis.
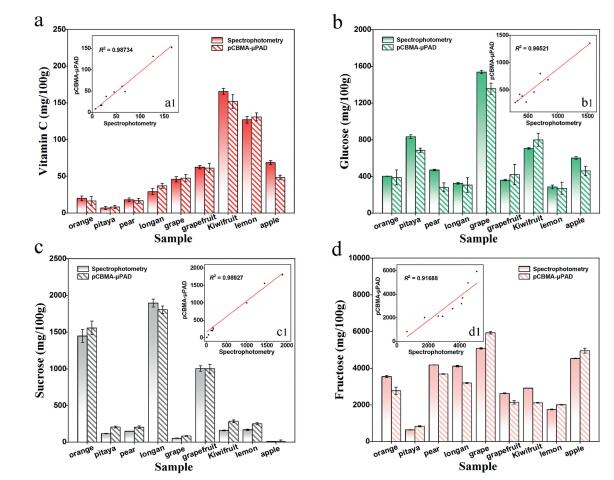
As a demonstration of its availability in real sample, the proposed pCBMA-μPAD was applied to analyze vitamin C, glucose, sucrose and fructose in 9 fruits (kiwifruit, lemon, grapefruit, apple, grape, longan, mandarin orange, pear, pitaya). Chromogenic reagents and enzymes were fully adequate for each nutrient test in the fruit, and the real content of each nutrient was calculated from the formula mentioned above. As shown in Fig. 4a, kiwifruit had the highest vitamin C content (~170 mg/100 g) while pitaya had the lowest (< 15 mg/100 g). Similarly, there were significant differences in the levels of glucose, sucrose and fructose among different fruits. The glucose content in fruits was as follows: grape (≈1600 mg/100 g) >> pitaya ≈ kiwifruit > apple > orange ≈ pear > longan ≈ grapefruit ≈ lemon (Fig. 4b). And the higher sucrose content was observed in longan (2000 mg/100 g), orange (1500 mg/100 g) and grapefruit (1000 mg/100 g) (Fig. 4c). Moreover, it was found that the fructose was more than 2000 mg/100 g in most fruits, except for pitaya (< 1000 mg/100 g) (Fig. 4d). Contemporaneously, the contents of vitamin C, glucose, sucrose and fructose in fruits were determined by spectrophotometry, and good correlation coefficients were obtained to 0.978, 0.965, 0.989 and 0.917 in these two methods, respectively.

|
Download:
|
| Fig. 4. Quantitative results of vitamin C, glucose, sucrose and fructose in nine fruit samples by pCBMA-μPAD and spectrophotometry (a–d), and the correlation coefficients (a1-d1) on analytical results by these two methods. | |
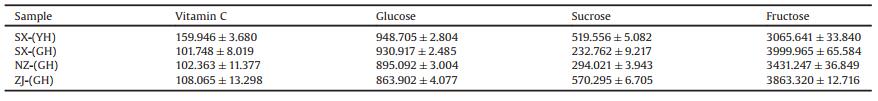
In addition, the developed pCBMA-μPAD was used to evaluate nutrients of kiwifruit from different habitats (Shaanxi, New Zealand, Zhejiang; labeled as SX, NZ and ZJ) and categories (yellow-heart, green-heart; labeled as YH and GH) (Table 1). The synchronous experiment was also verified by spectrophotometry (Table S2 in Supporting information). All the results indicate the category of kiwifruit has a greater impact on its nutrition than the origin, suggesting that the pCBMA-μPAD possesses potential applications in nutrition assessment and origin discrimination.
|
|
Table 1 The nutritional evaluation of kiwifruit from different origins and varieties by pCBMA-μPAD (n = 3), unit: mg/100 g. |
In summary, we described a method for efficient determination of coexisting nutrients in fruits by using a simple and affordable multiplexed pCBMA-μPAD. For an assay, all buffers, chromogenic reagents and enzymes are pre-stored in dry form on each test area, and then the user only needs to add a few drops of fruit to each reaction area, waiting for 3 min to measure the gray intensity of the color image. Given the merits of readily available, cheap, portable and capable of on-site assays even by nonskilled persons, the pCBMA-μPAD could be distributed to areas of orchards, supermarkets and even families to guide picking, preservation, consumption and intake. In addition, we also hope to extend additional spot tests, such as chemical or biological contaminants testing, to create a comprehensive analytical platform for evaluation of food quality and safety. Overall, this particularly practical micro-device provides enormous boost for moving the laboratory to the field.
Declaration of competing interestThe authors declare no competing financial interest.
AcknowledgmentsThis work was financially supported by the National Natural Science Foundation of China (Nos. 31701678, 31801638), the Key Project of Shanghai Agriculture Prosperity through Science and Technology (No. 2019-02-08-00-15-F01147), the Key Science and Technology Project of Henan (No. 172102310586), China PostDoctoral Science Foundation (No. 2018T110338). The authors sincerely thank all the panelists for experimental support.
Appendix A. Supplementary dataSupplementary material related to this article canbefound, in the online version, at doi:https://doi.org/10.1016/j.cclet.2019.11.005.
| [1] |
S. Jawaheer, S.F. White, S.D.D.V. Rughooputh, D.C. Cullen, Biosens. Bioelectron. 18 (2003) 1429-1437. DOI:10.1016/S0956-5663(03)00073-3 |
| [2] |
J. Gine Bordonaba, L.A. Terry, J. Agric. Food Chem. 57 (2009) 8220-8226. DOI:10.1021/jf901596w |
| [3] |
A.G. Pérez, R. Olías, J. Espada, et al., J. Agric. Food Chem. 45 (1997) 3545-3549. DOI:10.1021/jf9701704 |
| [4] |
J.G. Muir, R. Rose, O. Rosella, et al., J. Agric. Food Chem. 57 (2009) 554-565. DOI:10.1021/jf802700e |
| [5] |
C. Ma, Z. Sun, C. Chen, et al., Food Chem. 145 (2014) 784-788. DOI:10.1016/j.foodchem.2013.08.135 |
| [6] |
Y. Liu, Y. Ying, H. Yu, X. Fu, J. Agric. Food Chem. 54 (2006) 2810-2815. DOI:10.1021/jf052889e |
| [7] |
E. Lanza, B.W. Li, J. Food Sci. 49 (1984) 995-998. DOI:10.1111/j.1365-2621.1984.tb10378.x |
| [8] |
G.G. Martin, R. Wood, G.J. Martin, J. AOAC Int. 79 (1996) 917-928. DOI:10.1093/jaoac/79.4.917 |
| [9] |
K. Fan, M. Zhang, Crit. Rev. Food Sci. Nutr. (2018) 1-12. |
| [10] |
D. Baunsgaard, L. Munck, L. Nørgaard, Appl. Spectrosc. 54 (2016) 438-444. |
| [11] |
Y. Lin, D. Gritsenko, S. Feng, et al., Biosens. Bioelectron. 83 (2016) 256-266. DOI:10.1016/j.bios.2016.04.061 |
| [12] |
S. Chaiyo, W. Siangproh, A. Apilux, O. Chailapakul, Anal. Chim. Acta 866 (2015) 75-83. DOI:10.1016/j.aca.2015.01.042 |
| [13] |
S.M. Hossain, J.D. Brennan, Anal. Chem. 83 (2011) 8772-8778. DOI:10.1021/ac202290d |
| [14] |
M.M. Mentele, J. Cunningham, K. Koehler, J. Volckens, C.S. Henry, Anal. Chem. 84 (2012) 4474-4480. DOI:10.1021/ac300309c |
| [15] |
L.Q. Yao, T. Cheng, X.Q. Shen, et al., Chin. Chem. Lett. 29 (2018) 587-591. DOI:10.1016/j.cclet.2018.01.007 |
| [16] |
Y. Zhang, P. Zuo, B.C. Ye, Biosens. Bioelectron. 68 (2015) 14-19. DOI:10.1016/j.bios.2014.12.042 |
| [17] |
Y. Zhang, P. Gao, Q. Yue, P. Trefonas, Y.H. Deng, Chin. Chem. Lett. 29 (2018) 1661-1665. DOI:10.1016/j.cclet.2018.06.023 |
| [18] |
Z.M. Li, Z.H. Li, D.Y. Zhao, et al., Biosens. Bioelectron. 87 (2017) 874-880. DOI:10.1016/j.bios.2016.09.046 |
| [19] |
X.Q. Hu, L. Lu, C.Y. Fang, B.W. Duan, Z.W. Zhu, J. Agric. Food Chem. 63 (2015) 9863-9868. DOI:10.1021/acs.jafc.5b04530 |
| [20] |
F. Sun, K. Wu, H.C. Hung, et al., Anal. Chem. 89 (2017) 10999-11004. DOI:10.1021/acs.analchem.7b02876 |
| [21] |
S.C. Kim, U.M. Jalal, S.B. Im, S. Ko, J.S. Shim, Sens. Actuators B-Chem. 239 (2017) 52-59. DOI:10.1016/j.snb.2016.07.159 |
| [22] |
G.G. Morbioli, T. MazzuNascimento, A.M. Stockton, E. Carrilho, Anal. Chim. Acta 970 (2017) 1-22. DOI:10.1016/j.aca.2017.03.037 |
| [23] |
D.A. Duford, Y. Xi, E.D. Salin, Anal. Chem. 85 (2013) 7834-7841. DOI:10.1021/ac401416w |
| [24] |
W. Dungchai, O. Chailapakul, C.S. Henry, Analyst 136 (2011) 77-82. DOI:10.1039/C0AN00406E |
| [25] |
L. Cai, C. Xu, S. Lin, et al., Biomicrofluidics 8 (2014) 056504. DOI:10.1063/1.4898096 |
| [26] |
X. Li, J. Tian, W. Shen, Cellulose 17 (2010) 649-659. DOI:10.1007/s10570-010-9401-2 |
| [27] |
G. Chitnis, Z. Ding, C.L. Chang, C.A. Savran, B. Ziaie, Lab Chip 11 (2011) 1161-1165. DOI:10.1039/c0lc00512f |
| [28] |
J. Olkkonen, K. Lehtinen, T. Erho, Anal. Chem. 82 (2010) 10246-10250. DOI:10.1021/ac1027066 |
| [29] |
X. Li, D.R. Ballerini, W. Shen, Biomicrofluidics 6 (2012) 11301-1130113. DOI:10.1063/1.3687398 |
| [30] |
Y.Y. Xue, W.T. Zhang, M.Y. Zhang, et al., Anal. Biochem. 525 (2017) 100-106. DOI:10.1016/j.ab.2017.03.001 |
| [31] |
D.M. Cate, J.A. Adkins, J. Mettakoonpitak, C.S. Henry, Anal. Chem. 87 (2015) 19-41. DOI:10.1021/ac503968p |
| [32] |
S. Jiang, Z. Cao, Adv. Mater. 22 (2010) 920-932. DOI:10.1002/adma.200901407 |
| [33] |
J.H. Li, D.B. Zhang, X.X. Ni, H. Zheng, Q.Q. Zhang, Chin. J. Polym. Sci. 35 (2017) 809-822. DOI:10.1007/s10118-017-1944-3 |
| [34] |
Z. Zhang, S. Chen, S. Jiang, Biomacromolecules 7 (2006) 3311-3315. DOI:10.1021/bm060750m |
| [35] |
Y. Zhu, X. Xu, N.D. Brault, et al., Anal. Chem. 86 (2014) 2871-2875. DOI:10.1021/ac500467c |
| [36] |
L. Zheng, H.S. Sundaram, Z. Wei, C. Li, Z. Yuan, React. Funct. Polym. 118 (2017) 51-61. |
| [37] |
Z. Li, Y. Zhu, W. Zhang, et al., Food Anal. Methods 10 (2016) 666-674. |
| [38] |
O.W. Lau, S.F. Luk, J. Assoc. Off. Anal. Chem. 70 (1987) 518-520. |
| [39] |
Y. Klopotek, K. Otto, V. Bohm, J. Agric. Food Chem. 53 (2005) 5640-5646. DOI:10.1021/jf047947v |
| [40] |
M. Shahidullah, S.S.M.A. Khorasani, Anal. Chim. Acta 61 (1972) 317-319. DOI:10.1016/S0003-2670(01)95066-4 |