 2020, Vol. 31


b Institute of Functional Materials, Donghua University, Shanghai 201620, China;
c School of Material Science and Engineering, Jingdezhen Ceramic Institute, Jindezhen 333000, China;
d Engineering Research Center of Advanced Glasses Manufacturing Technology, Ministry of Education, Shanghai 201620, China
During the past few decades, thermoelectric (TE) materials have attracted numerous attentions due to their unique characteristics allowing the direct conversion between heat and electricity. The performance of TE materials can be estimated by a dimensionless figure of merit ZT, defined as ZT = σ2ST/κ, where s is the electrical conductivity, S is the Seebeck coefficient, κ is the thermal conductivity and T is the absolute temperature [1-3]. For TE materials to become comparable to conventional refrigerators and power plants, it is critical to enhance the thermoelectric conversion efficiency. However, the biggest challenge in improving the value of ZT is to decouple the three parameters (σ, S, κ), which conflict depend on carrier concentration. For instance, as the representative of n-type TE materials for room temperature, Bi2Te3 shows high electrical conductivity and low thermal conductivity, while the Seebeck's absolute value is too low to obtain large ZT in pure Bi2Te3 [4]. Nanostructure engineering, by reducing lattice thermal conductivity through grain boundaries, is an effective and feasible way to improve the TE performance of Bi2Te3. A high ZT ≈ 0.73 at 475 K was obtained for the Bi2Te3/AgNWs (AgNPs) nanocomposites due to the phonon scattering at large density of interfaces and the energy filtering effects of the heterogeneous second phase [2, 5]. Similar successful examples were also reported such as using Bi nano-dots, SiC nanoparticles and carbon nanotubes as the second phase to enhance the thermoelectric properties of Bi2Te3-based alloy [6-8]. However, these improvements are usually at the expenses of the power factor due to the decline in electrical conductivity. The addition of Cu as the second phase has an obviously different effect on TE properties. The absolute value of Seebeck coefficient increases sharply from 120 μK-1 to 200 μK-1, while the lattice thermal conductivity also increases significantly [9-11]. These results triggered our interests in developing a novel route to optimize the ZT value.
It is all known that the crystal structure of Bi2Te3 consists of quintuple layer units of Bi and Te stacking along the c-axis with atomic order Te(1)-Bi-Te(2)-Bi-Te(1). Such quintuple layers are weakly bonded by van der Waals forces, where the Te(1)-Te(1) layers act as a good diffusion path for guest atom, such as Cu [12-15]. The intercalation of free Cu can play an effective role in improving Seebeck coefficient, which is extremely sensitive to the changes in lattice spacing, thus enhancing the ZT of Cu/Bi2Te3 nanocomposite [10]. Although Cu nanoparticles have such obvious advantages, the chemical properties of copper nanoparticles are too active and easily oxidize in the air [16]. Here, Cu@Ag composite powder instead of single Cu or Ag is considered to be an ideal option to solve the above problems. When Cu@Ag nanoparticles are used as the second phase introduced in the matrix, the incoherent interface between Ag and Cu and the energy filtering effect between silver and matrix also play an important role in reducing the thermal conductivity. As a result, the three-parameter decoupling can be achieved by boosting the Seebeck coefficient while reducing the thermal conductivity without sacrificing electrical conductivity. The overall thermoelectric power factor (S2σ) was increased by more than 300%. In order to ensure uniform dispersion of the second phase of Cu@Ag nanoparticles, a new bottom-up composite approach was proposed, which includes ultrasonic dispersion, quick freezing, and freeze-drying process. Through this simple and effective composite method, Cu@Ag nanoparticles can be uniformly embedded into Bi2Te3 matrix to form thermoelectric composite materials with both Ag and Cu.
The detail of preparation of Bi2Te3 and Cu@Ag nanoparticles were given in supporting information. The synthesized Bi2Te3 nanoparticles and Cu@Ag nanoparticles are ultrasonically dispersed in water at different proportions (0.5, 1, 1.5 vol%) for 2 h, and the dispersion were frozen rapidly with liquid nitrogen (-196 ℃) to maintain the original good dispersion state, followed by freezedrying for 72 h. For the preparation of bulk materials, the asprepared power was sintered by SPS at 653 K under pressure of 70 MPa for 5 min. in Ar atmosphere. The relative density of all the bulk samples was above 97% and the specific parameters of the means of characterization are in the supporting information.
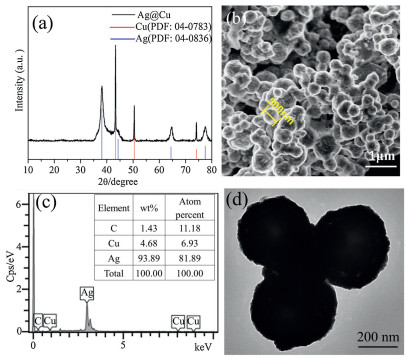
Fig. 1 is a representation of the composition and morphology of the synthesized Cu@Ag nanoparticles. The XRD pattern of Cu@Ag nanoparticles are shown in Fig. 1a. Both characteristic peaks of Ag and Cu can be clearly observed and no peaks of Cu2O was found by XRD. It is most likely due to the Cu nanoparticles being coated by oxidation-resistant silver nanoparticles. The morphology of Cu@Ag nanoparticles can be seen in Fig. 1b, in which the particles are spherical with an average diameter of about 500 nm. To identify the composition of Cu@Ag, elemental analysis was performed using energy-dispersive spectrometry (EDS). The EDS spectrum (Fig. 1c) of as-prepared Cu-Ag nanoparticles showed Ag element with a low content of Cu, indicating the main components of the shell is Ag. As both silver and copper are high atomic number atoms, the shell structure cannot be seen in the HR-TEM image, as shown in Fig. 1d.

|
Download:
|
| Fig. 1. (a) XRD pattern of Cu@Ag particles. (b) FE-SEM image of Cu@Ag particles. (c) EDS analysis of an individual particle. (d) TEM image of the Cu@Ag particles. | |
Fig. 2a shows the typical X-ray diffraction (XRD) patterns of pure Bi2Te3 powder after solution synthesis, which can be intuitively indexed to the pure Bi2Te3 phase. The microscopic morphology of Bi2Te3 powders is shown in Fig. 2a inset, indicating large particles are agglomerated by many small nanoparticles. The XRD patterns of Bi2Te3 bulk composite are shown in Fig. 2b. No Ag and Cu characteristic peaks are found due to the small amount of the composite. From the XRD magnified image of Fig. 2b, we can see that the XRD peak shifts to a small angle from the partial enlarged XRD pattern, for example, the (015) peak position XRD shifts to a small angle (Fig. 2c). The effects of Cu atom on the lattice parameters were evaluated by Rietveld refinement method, and the result is shown in Fig. 2d.

|
Download:
|
| Fig. 2. (a) Powder XRD patterns of Bi2Te3 powder with the inset of FE-SEM image of the pure Bi2Te3 powders. (b) XRD patterns of Bi2Te3 bulk containing x vol% Cu@Ag nanoparticles (x = 0, 0.5, 1.0, 1.5). (c) Expanded view of XRD patterns for angles between 26.5° and 29°. (d) Lattice parameters along a- and c-direction in composites. | |
The lattice parameters along a-axis direction were almost constant in the composites, while those along c-axis direction increased slightly with the increase of the Cu@Ag content. Considering that the atomic radius of Cu is 1.57 Å and the layer spacing between Te(1)-Te(1) in Bi2Te3 is about 1 nm, active free Cu easily diffuses into the interlayer, causing the distortion of the lattice. This result is consistent with many reported studies that demonstrated the Cu atoms diffuse rapidly and locate at the intercalation sites of the Te(1)-Te(1) [9, 10]. The orientation factor (termed as F) of all the samples are shown in Table S1 (Supporting information). All of the F values less than 5%, indicating the high randomness of the Bi2Te3 nanograins. As expected from the XRD results, the grains of the matrix and the composite bulk materials are randomly distributed without obvious orientation, which can be seen in the FE-SEM images of the fractured surface of bare Bi2Te3 and 1.0 vol% Cu@Ag/Bi2Te3 composite bulks.
Figs. 3a–d exhibits all the sintered bulk samples possess a well-crystallized and void-free feature, which is consistent with their high relative density. Figs. 3c and d shows that the grain size decreases obviously compared with the matrix when the Cu@Ag nanoparticles content is 1 vol%, and the grain size is less than 500 nm, suggesting the introduction of Cu@Ag nanoparticles effectively inhibited the grain growth by hindering the contact between the crystal grains of the matrix during SPS sintering process, which is reflected in many literatures [2, 5, 8]. As previously reported, a large number of nanograin sizes may produce more grain boundaries and interfaces, which strongly scatter long-wavelength phonons and thus significantly reduce lattice thermal conductivity [17, 18]. The existence and distribution of Cu@Ag nanoparticles can be observed by SEM-Mapping, as shown in Fig. 3e. It can be seen that the Cu and Ag are uniformly dispersed in the matrix. The specific distribution of Cu@Ag nanoparticle in the matrix can be obtained from the secondary electron image (SEI) and backscatter image (BSE). As shown in Figs. 3f and g, the black dots are evenly distributed without agglomeration. The black dots in the image are Cu@Ag, as confirmed by EDS analysis shown in Fig. 3h. This further proves the effectiveness of the method of the ultrasonic dispersion-flash freezing-drying method for preparing nanocomposites.

|
Download:
|
| Fig. 3. FE-SEM images of the fractured surfaces of Bi2Te3 composites with x vol% Cu@Ag nanoparticles: (a, b) 0.0 vol%, (c, d) 1.0 vol%, (e) element mapping of Bi2Te3 composites with 1.0 vol% Cu@Ag nanoparticles, (f, g) SE and BSE image of 1 vol% Cu@Ag and (h) element distribution of white area from (g). | |
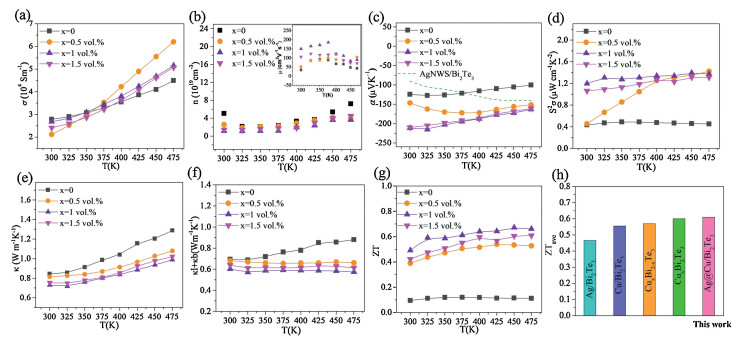
Figs. 4a and b exhibits the temperature dependence of σ, n and μ value of the different content of Cu@Ag nanoparticle embedded Bi2Te3. s of all the bulk samples increase with the increasing temperature, indicating the intrinsic semiconducting transport behavior. Compared with the pristine Bi2Te3 bulk samples, σ of composites decreased slightly before 475 K and sharply enhanced when the temperature was higher than 475 K. When the content of Cu@Ag nanoparticles was 0.5 vol%, σ was the highest, up to 6.2×10⁴ S/m at 475 K, which was 27% higher than that of the matrix (4.2×10⁴ S/m).

|
Download:
|
| Fig. 4. Temperature dependence of (a) electrical conductivity, (b) carrier concentration (inset is the temperature dependence of carrier mobility), (c) seebeck coefficient, (d) power factor, (e) thermal conductivity and (f) κl+κb, (g) ZT for Bi2Te3 bulk samples containing x vol% Cu@Ag (x = 0, 0.5, 1.0, 1.5). (h) State-of-the-art average ZTs for Bi2Te3 alloys [2, 9, 15, 21]. | |
The variation tendency in electrical conductivity is determined undoubtedly by the carrier concentration (n) and mobility (μ), which can be expressed as σ = neμ, respectively [19]. As shown in Fig. 4b, it was observed that the carrier concentrations of the composites were lower than that of the matrix though the high conductivity of Cu@Ag. As is reported, the addition of Cu@Ag refines the grains, leading to a large number of grain boundaries and interfaces. The scattering of low-energy carriers at the interface is strong near room temperature, results in a low carrier concentration. Different from the tendency of the carrier concentration of the matrix, which decreases first and then increases with the increase of temperature owe to the obvious bipolar diffusion effect, the carrier concentration of the composites increases with the increasing temperature under the premise of intrinsic excitation suppressed by the Cu atom intercalation. Therefore, intercalation Cu atom as the donor injects extra electron carriers into the matrix and the extra electron carriers overcome the interface barrier at high temperature, ultimately increasing the carrier concentration. The decrease in the carrier concentration of the composite is inevitably accompanied by a big boost in mobility which is likely due to the fact that the intercalation of Cu provides additional migration channels for carriers, as shown in the inset of Fig. 4b.
Fig. 4c shows the temperature dependence of S. A negative S of all samples is indicative of n-type electrical transport behavior. As expected, the absolute Seebeck coefficient of the Cu@Ag/Bi2Te3 composite bulks significantly increases compared to that of the Bi2Te3 samples over the entire temperature range. The peak of the absolute Seebeck coefficient reaches 210 μV/K at 325 K for the 1 vol % Cu@Ag/Bi2Te3 nanocomposite while Bi2Te3 sample only shows 127 μV/K, implying the introduction of the second phase of Cu@Ag nanoparticles effectively enhance the Seebeck coefficient by more than 65%. Because the Bi2Te3 can be reasonably regarded as degenerated semiconductors, the linear temperature dependence of the Seebeck coefficient can be calculated by [20]:

|
where h is the Planck constant. Respectively, the increase in Seebeck coefficient for Cu@Ag/Bi2Te3 nanocomposite nanobulk can also be attributed mainly to the decrease in n. Accordingly, the obtained power factor is much higher than the pristine Bi2Te3. A maximum power factor, 14 μW K-2 cm-1, was obtained at 450 K for 1 vol% Cu@Ag/Bi2Te3 nanocomposite bulk as a result of the relatively high electrical conductivity and the high absolute Seebeck coefficient, as shown in Fig. 4d. It is worth noting that the power factor maintains a high value over a wide temperature range, which plays a key role in the improvement of the overall thermoelectric figure of merit.
The thermal conductivity of all the samples increases with the temperature rising, as shown in Fig. 4e. As expected from the microstructure and the presence of nanosecond phase of the composite pellets, κ of composites was much lower than that of pristine Bi2Te3 [6, 21, 22]. Meanwhile, as the content of Cu@Ag in the composite increases, the thermal conductivity decreases first and then increases slightly. The reduction in total thermal conductivity largely comes from the reduction of the lattice plus bipolar part (κl+κbi), which were obtained by direct subtracting κe from κtat, respectively. Among them, κe can be roughly estimated using the Wiedemann-Franz law (κe = LσT, where L is the Lorentz number) [23]. Here, L was calculated by using a single parabolic band model with acoustic phonon scattering and the values are shown in Fig. S1 (Supporting information). Compared with the bare Bi2Te3, the κtat-κe values (Fig. 4g) of all the composite samples are significantly decreased, which is contrary to the influence of Cu doping on the lattice thermal conductivity of Bi2Te3 in the literatures, suggesting that the existence of the Ag nanoshell plays an important role in the reduction of the lattice thermal conductivity [9, 10, 15]. Considering that the work function of Ag is 4.52 eV and the work function of Bi2Te3 is 5.13 eV, the energy band at the heterointerface is bent and an ohmic contact is formed, which can effectively scatter phonons and has less influence on electrical conductivity at room temperature [24, 25]. We all know that Bi2Te3 is a narrow-band semiconductor, therefore, the bipolar effect is obvious as the temperature increases. Interestingly, intrinsic excitation of the Cu@Ag/Bi2Te3 composite is significantly suppressed compared to the pristine Bi2Te3 due to the intercalation of Cu atoms effectively inhibits intrinsic excitation.
Finally, the temperature dependence of ZT value for Cu@Ag/Bi2Te3 nanocomposite bulk at temperatures of 300–475 K are displayed in Fig. 4g. The ZT values for all Cu@Ag/Bi2Te3 samples are greater than that of Bi2Te3. The maximum ZT value of 1 vol% Cu@Ag/Bi2Te3 sample is about 0.69 at 450 K, which is 340% higher than the 0.12 of bare Bi2Te3. Interestingly, the ZT value notably keeps a fairly high level from 300 K to 475 K. The average ZT of 1 vol% Cu@Ag/Bi2Te3 composite sample is 0.61, much higher than the reported work of Ag/Bi2Te3, Cu/Bi2Te3 or Cu doped Bi2Te3, as shown in Fig. 4h. We believe that the high ZT of our nanocomposite is primarily due to the significant improvement of the Seebeck coefficient, much larger electrical conductivity and the lower thermal conductivity.
In summary, high thermoelectric performance has been obtained in n-type Bi2Te3 composites x vol% Cu@Ag/Bi2Te3 (x = 0, 0.5, 1, 1.5) through the incorporation of Cu@Ag nanoparticles by ultrasonic dispersion, quick freezing, freeze-drying process and SPS sintering. The highest ZT of 0.69 is obtained for 1 vol% Cu@Ag/Bi2Te3 at 450 K. The outstanding performance of the Cu@Ag/Bi2Te3 composite is mainly benefiting from the lower thermal conductivity and higher power factor. On one hand, the Cu@Ag nanoparticles introduced in the Bi2Te3 matrix can strengthen the interfacial scattering at the boundaries, which effectively scatters the thermal phonons, resulting in extremely low thermal conductivity. On the other hand, the intercalated copper atoms act as donors, not only helps to inhibit the intrinsic excitation but also greatly increases the Seebeck coefficient and provides additional electrons for the matrix at high temperatures, and thereby increases the conductivity. Our results demonstrate that the introduction of Cu@Ag nanoparticles as a second phase comprehensively realizes the decoupling of the parameters, which provides a new route to improve the TE.
AcknowledgmentsThis work was funded by the National Natural Science Foundation of China (Nos. 51774096, 51871053), Shanghai Committee of Science and Technology (Nos. 16JC1401800, 18JC1411200), the Fundamental Research Funds for the Central Universities (No. 19D110625), Program of Innovative Research Team in University of Ministry of Education of China (No. IRT16_R13).
Appendix A. Supplementary dataSupplementary material related to this article can be found, in the online version, at doi:https://doi.org/10.1016/j.cclet.2019.07.034.
| [1] |
X. Shi, L. Chen, C. Uher, Int. Mater. Rev. 61 (2016) 379-415. DOI:10.1080/09506608.2016.1183075 |
| [2] |
Q.H. Zhang, X. Ai, W.J. Wang, L.J. Wang, W. Jiang, Acta Mater. 73 (2014) 37-47. DOI:10.1016/j.actamat.2014.03.070 |
| [3] |
J.J. Shen, T. Fang, T.Z. Fu, et al., J. Inorg. Mater. 34 (2019) 260-268. DOI:10.15541/jim20180320 |
| [4] |
C.M. Bhandari, D.M. Rowe, Thermoelectrics Handbook: Macro to Nano, CRC Press Inc., Boca Raton, 1995.
|
| [5] |
Q.H. Zhang, X. Ai, L.J. Wang, et al., Adv. Funct. Mater. 25 (2015) 966-976. DOI:10.1002/adfm.201402663 |
| [6] |
S. Sumithra, N.J. Takas, D.K. Misra, et al., Adv. Energy Mater. 1 (2011) 1141-1147. DOI:10.1002/aenm.201100338 |
| [7] |
J.H. Li, Q. Tan, J.F. Li, et al., Adv. Funct. Mater. 23 (2013) 4317-4323. DOI:10.1002/adfm.201300146 |
| [8] |
Q.H. Zhang, L.L. Xu, Z.X. Zhou, et al., J. Appl. Phys. 121 (2017) 10. |
| [9] |
F.R. Sie, C.H. Kuo, C.S. Hwang, et al., J. Electron. Mater. 45 (2016) 1927-1934. DOI:10.1007/s11664-015-4297-0 |
| [10] |
W.S. Liu, Q. Zhang, Y. Lan, et al., Adv. Energy Mater. 1 (2011) 577-587. DOI:10.1002/aenm.201100149 |
| [11] |
M. Jeong, J.Y. Tak, S. Lee, et al., J. Alloys Compd. 696 (2017) 213-219. DOI:10.1016/j.jallcom.2016.11.257 |
| [12] |
J. Bludská, I. Jakubec, C. Drašar, P. Lošták, J. Horák, Philos. Mag. 87 (2007) 325-335. DOI:10.1080/14786430600990337 |
| [13] |
J.N. Yang, L. Xia, Z.H. Lin, et al., Chin. Chem. Lett. 30 (2019) 638-642. DOI:10.1016/j.cclet.2018.08.004 |
| [14] |
X. Chen, X. Liu, K. Huang, Chin. Chem. Lett. 30 (2019) 797-800. DOI:10.1016/j.cclet.2018.11.011 |
| [15] |
J. An, M.K. Han, S.J. Kim, J. Solid State Chem. 270 (2019) 407-412. DOI:10.1016/j.jssc.2018.11.024 |
| [16] |
J. Zhao, D. Zhang, J. Zhao, J. Solid State Chem. 184 (2011) 2339-2344. DOI:10.1016/j.jssc.2011.06.032 |
| [17] |
Q. Zhang, Z. Zhou, M. Dylla, et al., Nano Energy 41 (2017) 501-510. DOI:10.1016/j.nanoen.2017.10.003 |
| [18] |
R.G. Deng, X.L. Su, S.Q. Hao, et al., Energy Environ. Sci. 11 (2018) 1520-1535. DOI:10.1039/C8EE00290H |
| [19] |
T. Mori, Small 13 (2017)1702013. https://www.ncbi.nlm.nih.gov/pubmed/28961360
|
| [20] |
Y.L. Tang, Z.M. Gibbs, L.A. Agapito, et al., Nat. Mater. 14 (2015) 1223-1228. DOI:10.1038/nmat4430 |
| [21] |
S. Chen, K.F. Cai, F.Y. Li, S.Z. Shen, J. Electron. Mater. 43 (2014) 1966-1971. DOI:10.1007/s11664-013-2928-x |
| [22] |
M. Hong, Z.G. Chen, L. Yang, J. Zou, Nano Energy 20 (2016) 144-155. DOI:10.1016/j.nanoen.2015.12.009 |
| [23] |
H.S. Kim, Z.M. Gibbs, Y.L. Tang, H. Wang, G.J. Snyder, Appl. Mater. 3 (2015) 041506. DOI:10.1063/1.4908244 |
| [24] |
W.Y. Zhao, Z.Y. Liu, Z.G. Sun, et al., Nature 549 (2017) 247. DOI:10.1038/nature23667 |
| [25] |
Y. Zhang, M.L. Snedaker, C.S. Birke, et al., Nano Lett. 12 (2012) 1075-1080. DOI:10.1021/nl204346g |