 2020, Vol. 31


b Key Laboratory of Smart Drug Delivery of MOE, School of Pharmacy, Fudan University, Shanghai 201203, China
Injectable fat emulsions, a heterogeneous system in which the lipid phase is dispersed as droplets in an aqueous phase and stabilized by phospholipids. Over the last decades, the injectable fat emulsions were clinically used as an energy source for hospitalized patients by providing essential fatty acids and vitamins [1-3]. Meanwhile, they have also been developed as carriers for hydrophobic compounds [4, 5]. They have various advantages in practical application. In the first place, fat emulsions can reduce irritation, pain, and thrombophlebitis caused by some surfactants including Cremophor EL [6]. Moreover, fat emulsions are able to withstand high pressure steam sterilization, which can eliminate the impact of bacteria and spores [7]. Following successful commercialization of Intralipid® in 1961, there has been many generic nutritional fat emulsion products [4].
In spite of these advantages and widespread applications in clinical use, it is always lack of a feasible way to discriminate against nutritional fat emulsion in vivo. Nutritional fat emulsions do not contain drugs and usually have similar formulation constituents and manufacturing process in general [4]. However, the emulsifier usually uses the egg yolk lecithin which is a mixture extracted from egg yolk. They are not absolutely same among different sources. Therefore, it is necessary to evaluate the in vivo similarity of various nutritional fat emulsions prepared by different egg yolk lecithins. Nevertheless, it is difficult to discriminate against nutritional fat emulsions by conventional methods because there is no drug contained in formulation. Facing these problems, how to investigate the discrimination of nutritional fat emulsions has turned to be a hot issue. Some researches monitored phospholipids and triglycerides in blood to elucidate the in vivo behavior of nanoemulsions [8]. In the strict sense, phospholipid and triglycerides cannot represent the nano-emulsions and be used to track the intact nanoemulsions. Therefore, it is of imperative significance to develop a new strategy to explore the in vivo discrimination against fat emulsions accurately following intravenous administration.
Previously, our group developed an aggregation caused quenching (ACQ) probe to identify the intact nanoparticles from free probe-derived interference in vivo. We have used the ACQ probes to evaluate the in vivo fate of lipid nanoparticles [9, 10], polymeric nanoparticles [11, 12], micelles [13] and nanosuspension [14] accurately. The ACQ probes can be loaded in the core of nanoparticles to track the in vivo fate of intact carriers. The fluorescent signal can absolutely represent the intact nanocarriers because it emits strong fluorescence when residing nanocarriers, but absolutely quenches once releasing in aqueous environments after disassociation of carriers due to strong ACQ effect [15]. Therefore, this study employed this probe to track the fat emulsion droplets to elucidate the in vivo behavior of nanoemulsions, which provided comprehensive information to discriminate against various products of nutritional fat emulsions.
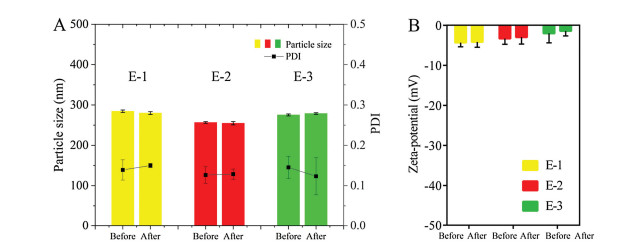
Nutritional fat emulsion injections were provided from Sino-Swed, Libang and Kelun companies and named as E-1, E-2 and E-3 group separately. Among them, the fat emulsion from Sino-Swed is regarded as original formulation and other two are generic ones. They are manufactured with the same constituents including phospholipids, glycerol and soya-bean oil. However, both phos-pholipids and soya-bean oil are mixture and from different sources which could cause some differences in trace constituents. The particle size, polydispersity indexes (PDIs) and Zeta-potentials of them are shown in Fig. 1. E-1 and E-3 groups have the same particle size, which is about 280 nm. The particle size of E-2 group is about 260 nm, which is slightly lower. All group have the same PDI (≈ 0.13) and zeta-potential (≈3 mV). On account of difference in particle size between each group is very small and zeta-potentials of all groups are near neutral, it is rational to postulate that the particle size and zeta-potential might not exert obvious effect in our study.

|
Download:
|
| Fig. 1. Particle size, PDI (A) and Zeta-potential (B) of nutritional fat emulsion injections before and after loading of the P2 probes (Mean ±SD, n = 3). | |
The nanoemulsion was labeled with P2 probe by incubation method. After that, the particle size, PDI and zeta-potential have not changed significantly (Fig. 1). Besides, the fluorescent intensity of 100 μL P2-labeled nutritional 20% fat emulsions (PNEs) in E-1, E-2 and E-3 groups quantified by IVIS was (4.74 ± 0.22) × 1010, (4.33 ± 0.21) × 1010 and (4.40 ± 0.29) × 1010 [p/s]/[μW/cm2]respectively, which were suitable to be used for in vitro and in vivo studies. The P2 probe, an environment-responsive fluorescent probe, has an aza-BODIPY parent structure, and exhibits favorable characteristics suitable for in vivo imaging including near-infrared emission, excellent chemical stability and high quantum yields [9]. The P2 molecules are able to penetrate into the core of nanoemulsion by incubation due to high hydrophobicity, which enables the nanoemulsion emit the strong fluorescence. Therefore, this method is a simple and feasible way to label the nanoemulsion products, which does not need to add the probes upon preparation.
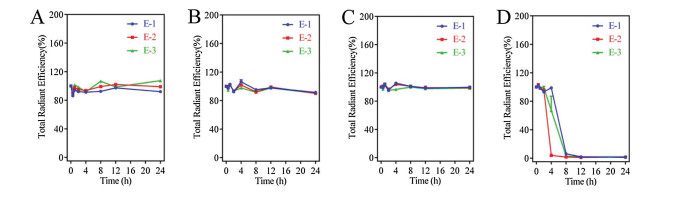
Fig. 2 showed the fluorescent stability of PNEs during storage and in different media as described in the experimental section (Supporting information). Results indicate that the fluorescence intensity of PNEs remain stable during 24 h high temperature storage in 37 ℃ (Fig. 2A) and for 24 h incubation in pH 7.4 PBS and water (37 ℃) (Figs. B and C). The fluorescent intensity of the nanoemulsion in all three groups had kept stable (100% ± 20%) over a period of 24 h incubation in buffers, so there is no possibility of unwanted breakdown of the nanoemulsion in these buffers. If they had been broken down, the P2 probe molecules would release into the surrounding medium that could cause ACQ effect and make the fluorescence quenching [9]. However, as shown in Fig. 2D, there is a different situation in the rat plasma. After 4 h, the fluorescence intensity of three groups decreased rapidly and dropped to approximately 1% at 12 h. The fluorescent stability in rat plasma indicates that nanoemulsions of them seem to be broken more easily when contacting with plasma proteins, which is consistent with the purpose of rapid nutritional supplementa-tion in the clinic [16] and shows a good mimicking of the virtual situation after intravenous administration.

|
Download:
|
| Fig. 2. Stability of fluorescent intensity of PNEs in E-1, E-2, E-3 group during 24 h storage in 37 ℃ air bath shaker (A) and stability of fluorescent intensity of all three formulations during 24 h incubation with deionized water (B), pH 7.4 PBS (C), rat plasma (D). | |
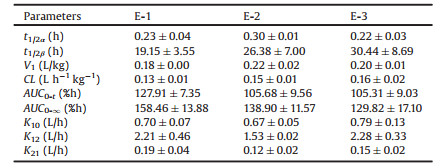
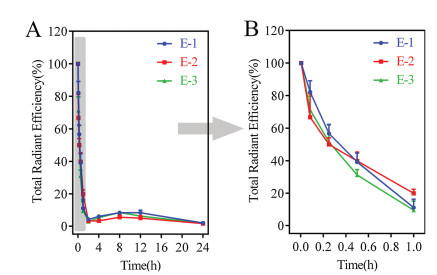
Fig. 3 shows the quantification of total fluorescence of blood after i.v. administration of PNEs. Benefit from the special properties of the P2 probe, the fluorescence signal can represent as the intact nanoemulsions, which means that Figs. 3A and B can also represent the in vivo kinetics of nanoemulsion in 24 h and 1 h respectively. According to Fig. 3A, it is obvious that the overall elimination rate of the nanoemulsion from blood stream in all three groups is very fast with a typical 'L'-type biphasic kinetic. Due to the denser time points of blood collection in the early stage, total radiant efficiency (TRE) – time curve of first hour in Fig. 3A is amplified (Fig. 3B), which intuitively shows that nanoemulsions of PNEs in three groups were rapidly cleared from the blood stream with probably 38% remaining after 30 min. This indicates probable phagocytic uptake by RES organs as a result of spontaneous opsonization by blood complementary systems [17-20]. During the 4–8 h period, the kinetic curve of nanoemulsion in three groups all increased slightly, which may be related to the efflux of the organs and the redistribution into blood circulation of nanoemulsions [21]. After 24 h, all nanoemulsions had been cleared from blood. The kinetic parameters of nanoemulsion were obtained by fitting to two-compartmental model. The 'L'-type biphasic pharmacokinetics reflect disposition in the two compartments. In phase I, the distribution of various nanoemulsions is very fast. On the contrary, the phase II indicate a very slow elimination rate from the peripheral compartment. As shown in Table 1, pharmacokinetic parameters of three groups are all not statistically different. The general elimination of nanoemulsions from the central compart-ment (CC) is very fast with a t1/2α less than 20 min. Elimination from the peripheral compartment (PC) is significantly elongated refer to the t1/2β (≈ 20 h). Obviously, CC and PC correlate closely to physical compartments, i.e., blood tank and organs, respectively. The results indicate that all nanoemulsions of PNEs groups were cleared from blood quickly, subsequently accumulated in organs and retained there for extended duration.

|
Download:
|
| Fig. 3. Kinetic profiles (n = 3) of nanoemulsion in three groups by quantifying total radiant efficiency (TRE) of different time point blood samples after i.v. administra-tion of PNEs in rats (A); enlargement of the kinetic profiles of nanoemulsion within 0–1 h (B). | |
|
|
Table 1 Kinetic parameters of nanoemulsion by fitting into two-compartmental model (Mean ± SD, n = 3). |
In clinic, these original and generic emulsion products are all used to provide essential nutrients. When the distribution of nanoemulsions to organs is different, it is likely to result in a difference in bioavailability. Moreover, excessive intake in some organs may cause side effects. Therefore, it is of significance to do the biodistribution of fat emulsions. In this section, the biodistribution of nanoemulsions into various organs was detected by IVIS live imaging system. Ex vivo imaging of organs in three groups after i.v. administration of PNEs is shown in Fig. 4. After intravenous administration, nanoemulsions of PNEs immediately distributed to most organs along with the blood flow, and began to accumulate in various organs 30 min later including liver, spleen and kidney. It is of note that brain and testicles did not show any signal of nanoemulsions within experimental time, which might be explained by the presence of blood-brain barriers (BBB) and blood-testis barriers (BTB) because intact nanoemulsions cannot cross these barriers easily [22-24]. After 24 h, the vast majority of nanoemulsions had been metabolized in RES organs such as liver and spleen [25-28].

|
Download:
|
| Fig. 4. Ex vivo imaging of organs dissected from three groups' ICR mice after i.v. administration of PNEs. The heart, lungs, liver, adrenal gland, kidneys, spleen, small intestine, testis, and brain are shown from top to bottom in each picture. | |
The fluorescent intensity of each organ was quantified by regions of interest (ROI) method based on total radiant efficiency (TRE) (Fig. 5 and Fig. S1 in Supporting information). Fluorescent quantification of nanoemulsion in all three groups revealed a trend of distributing to liver, spleen and kidneys mainly. As shown in Fig. 5A, nanoemulsions accumulated in liver quickly after i.v. administration and accumulations peaked at around 2–4 h, followed by gradual elimination. It can be found that E-2 group show a little bit lower density of nanoemulsions in the liver at around 2–8 h, which is consistent with stability in plasma (Fig. 2D). Nanoemulsions in E-3 group are more easily metabolized by the liver compared to other groups. After the peak, distribution of nanoemulsion of three groups in liver decreased gradually. It meant that nanoemulsions were eliminated from the body gradually. The situation in the spleen is similar to that in the liver, but the amounts of nanoemulsion in all groups in liver are about 18 times more than in spleen (Fig. 5B). That is mainly due to sequestration by the liver, which results that there is less distribution of nanoemulsions to the spleen. Fig. 5C shows that distribution of nanoemulsion in kidneys increased slowly, which means nanoemulsions of all groups were mainly eliminated from the body through kidneys during the entire time after i.v. administration [29]. In addition to the liver, spleen and kidneys, the biodistribution of the nanoemulsions to other organs is of less intensity (Fig. S1).

|
Download:
|
| Fig. 5. Distribution of intact nanoemulsions expressed as total radiant efficiency (TRE) in some organs including liver (A), spleen (B) and kidneys (C). | |
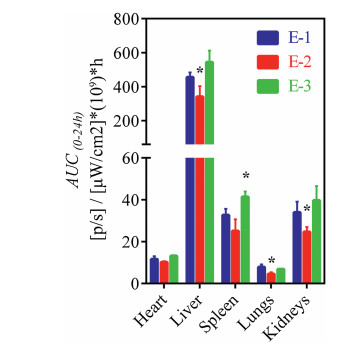
In order to quantify the total fluorescent intensity of nano-emulsion in the whole process, we fitted the TRE-time curve of each organ to the non-compartment model. The obtained statistical moment AUC(0-t) values are shown in Fig. 6. Since liver has the biggest volume among all organs investigated herein, there is no doubt that liver is the major destination of the nanoemulsions in the three groups [30-33]. Obviously, the drastic accumulation of these nanoemulsions in the three groups is in coincidence with their rapid clearance from circulating [34, 35]. For all groups, the AUC(0-24 h) values of nanoemulsion in different organs revealed a trend of biodistribution in an order of liver > spleen > kid-neys > heart > lungs. In all organs, it is evident that E-2 group has shown the lowest AUC values and it has significant difference in liver, lungs and kidneys compared to E-1. AUC values of E-3 group seem to be a little bit higher and has significant difference in spleen compared to E-1 (Fig. 6). Comparing the fluorescence data of three group, we can draw an initial conclusion. Although there is no significant difference in the blood, the results of organ fluorescent quantitation indicate that the amounts of nanoemulsions in some organs is not consistent due to the differences in product manufacturers. Obviously, it is accurate and effective to do discrimination of nutritional fat emulsions based on our water quenching fluorescent probe.

|
Download:
|
| Fig. 6. Statistical moment AUC(0-t) values (n = 3) of nanoemulsion by fitting the TRE-time curve of each organ to the non-compartment model. All AUC values had been statistically analyzed. * represents significant difference compared to E-1 (P < 0.05). | |
In summary, this study is to establish a reliable method to do discrimination of nutritional fat emulsions based on water quenching fluorescent probe. The P2 probe is employed to label nanoemulsion by incubation for tracking the in vivo behavior of intact nanoemulsion. In vitro fluorescent stability study confirms the feasibility of using a novel ACQ P2 probes to label fat emulsions and identify the integral nanoemulsions. In all groups, kinetics of nanoemulsions in blood and ex vivo examination has shown a process of rapid removal from the blood and an accumulated distribution to most organs. However, the AUC values of nano-emulsions in these groups were dissimilar in some organs. Therefore, these findings provide novel insights for the in vivo discrimination and give us a more accurate understanding of the in vivo behaviors of nanoemulsions.
AcknowledgmentsThis work was financially supported by the National Natural Science Foundation of China (Nos. 81872826, 81573363, 81690263), Science and Technology Commission of Shanghai Municipality (No. 18ZR1404100) and Shanghai Pujiang Program (No. 18PJD001).
Appendix A. Supplementary dataSupplementary material related to this article can be found, in the online version, at doi:https://doi.org/10.1016/j.cclet.2019.07.016.
| [1] |
P.C. Calder, G.L. Jensen, B.V. Koletzko, et al., Intensive Care Med. 36 (2010) 735-749. DOI:10.1007/s00134-009-1744-5 |
| [2] |
K.M. Gura, S. Lee, C. Valim, et al., Pediatrics 121 (2008) 678-686. DOI:10.1542/peds.2007-2248 |
| [3] |
F.D. Battistella, J.T. Widergren, J.T. Anderson, et al., J. Trauma Acute Care 43 (1997) 52-58. DOI:10.1097/00005373-199707000-00013 |
| [4] |
K. Hippalgaonkar, S. Majumdar, V. Kansara, AAPS Pharm. Sci. Tech. 11 (2010) 1526-1540. DOI:10.1208/s12249-010-9526-5 |
| [5] |
L.G. Lucca, S.P. de Matos, C.B. deMattos, et al., J. Biomed.Nanotechnol. 13 (2017) 583-590. DOI:10.1166/jbn.2017.2366 |
| [6] |
H. Gelderblom, J. Verweij, K. Nooter, et al., Eur. J. Cancer 37 (2001) 1590-1598. DOI:10.1016/S0959-8049(01)00171-X |
| [7] |
J.W. Goodwin, Curr. Opin. Colloid Interf. Sci. 17 (2012) 233-234. DOI:10.1016/j.cocis.2012.07.004 |
| [8] |
T. Sakaeda, K. Hirano, J. Drug Target 6 (1998) 119-127. DOI:10.3109/10611869808997887 |
| [9] |
X. Hu, J. Zhang, Z. Yu, et al., Nanomed.Nanotechnol.Biol.Med. 11 (2015) 1939-1948. DOI:10.1016/j.nano.2015.06.013 |
| [10] |
X. Hu, W. Fan, Z. Yu, et al., Nanoscale 8 (2016) 7024-7035. DOI:10.1039/C5NR07474F |
| [11] |
H. He, S. Jiang, Y. Xie, et al., Nanoscale Horiz. 3 (2018) 397-407. DOI:10.1039/C8NH00010G |
| [12] |
Y. Li, C. Wang, S. Zong, et al., J. Biomed. Nanotechnol. 15 (2019) 686-702. DOI:10.1166/jbn.2019.2724 |
| [13] |
H. He, J. Zhang, Y. Xie, et al., Mol. Pharm. 13 (2016) 4013-4019. DOI:10.1021/acs.molpharmaceut.6b00705 |
| [14] |
D.L. Liu, B. Wan, J.P. Qi, et al., Chin. Chem. Lett. 29 (2018) 1834-1838. DOI:10.1016/j.cclet.2018.11.015 |
| [15] |
F. Xia, W. Fan, S. Jiang, et al., ACS Appl. Mater. Interfaces 9 (2017) 21660-21672. DOI:10.1021/acsami.7b04916 |
| [16] |
S.J. Dudrick, J. Am. Coll. Nutr. 28 (2009) 243-251. DOI:10.1080/07315724.2009.10719778 |
| [17] |
K.M. Tsoi, S.A. MacParland, X.Z. Ma, et al., Nat. Mater. 15 (2016) 1212. DOI:10.1038/nmat4718 |
| [18] |
L. Araujo, R. Löbenberg, J. Kreuter, J. Drug Target 6 (1999) 373-385. DOI:10.3109/10611869908996844 |
| [19] |
M. Yu, J. Zheng, ACS Nano 9 (2015) 6655-6674. DOI:10.1021/acsnano.5b01320 |
| [20] |
A.C. Anselmo, S. Kumar, V. Gupta, et al., Biomaterials 68 (2015) 1-8. DOI:10.1016/j.biomaterials.2015.07.043 |
| [21] |
B. Wang, X. He, Z. Zhang, et al., Acc. Chem. Res. 46 (2013) 761-769. DOI:10.1021/ar2003336 |
| [22] |
I. Brigger, J. Morizet, G. Aubert, et al., J. Pharmacol. Exp. Ther. 303 (2002) 928-936. DOI:10.1124/jpet.102.039669 |
| [23] |
C. Zhan, W. Lu, Curr. Pharm. Biotechnol. 13 (2012) 2380-2387. DOI:10.2174/138920112803341798 |
| [24] |
H.S. Sharma, E. Pontén, T. Gordh, et al., CNS Neurol. Disord.-DR 13 (2014) 1595-1603. DOI:10.2174/1871527313666140806122906 |
| [25] |
P. Decuzzi, B. Godin, T. Tanaka, et al., J. Control Release 141 (2010) 320-327. DOI:10.1016/j.jconrel.2009.10.014 |
| [26] |
Z. Liu, C. Davis, W. Cai, et al., Proc. Nat. Acad. Sci. U.S.A. 105 (2008) 1410-1415. DOI:10.1073/pnas.0707654105 |
| [27] |
M.L. Schipper, G. Iyer, A.L. Koh, et al., Small 5 (2009) 126-134. DOI:10.1002/smll.200800003 |
| [28] |
B.T. Jeon, E.A. Jeong, H.J. Shin, et al., Diabetes 61 (2012) 1444-1454. DOI:10.2337/db11-1498 |
| [29] |
H.S. Choi, W. Liu, F. Liu, et al., Nat. Nanotechnol. 5 (2009) 42. |
| [30] |
Y.N. Zhang, W. Poon, A.J. Tavares, et al., J. Control Release 240 (2016) 332-348. DOI:10.1016/j.jconrel.2016.01.020 |
| [31] |
P. Aggarwal, J.B. Hall, C.B. McLeland, et al., Adv. Drug Del. Rev. 61 (2009) 428-437. DOI:10.1016/j.addr.2009.03.009 |
| [32] |
J.P.M. Almeida, A.L. Chen, A. Foster, et al., Nanomedicine 6 (2011) 815-835. DOI:10.2217/nnm.11.79 |
| [33] |
M. Arnida, M. Janát-Amsbury, A. Ray, C.M. Peterson, H. Ghandehari, Eur. J. Pharm. Biopharm. 77 (2011) 417-423. DOI:10.1016/j.ejpb.2010.11.010 |
| [34] |
M. Longmire, P.L. Choyke, H. Kobayashi, Nanomedicine 3 (2008) 703-717. DOI:10.2217/17435889.3.5.703 |
| [35] |
W.H. De Jong, W.I. Hagens, P. Krystek, et al., Biomaterials 29 (2008) 1912-1919. DOI:10.1016/j.biomaterials.2007.12.037 |