 2020, Vol. 31


b Key Laboratory of Flexible Electronics(KLOFE) & Institute of Advanced Materials(IAM), Nanjing Tech University, Nanjing 211800, China;
c State Key Laboratory of Luminescent Materials and Devices, South China University of Technology, Guangzhou 510640, China
Formaldehyde (FA) acts as a protein and DNA crosslinking agent, which can be endogenously generated by enzymatic demethylation of histones, one-carbon metabolism and oxidative decomposition of the folate backbone [1-5]. Importantly, FA could be converted into formate within seconds to minutes and further promoted nucleotide synthesis [5], as well as involved in the synthesis of purines, amino acids, and neurotransmitters [6-9]. In addition, the abnormal level of FA (normal range: 0.2-0.4 mmol/L) is associated with some diseases [2, 10], such as Alzheimer's disease, neurodegenerative diseases, diabetes and cancers [10-14]. The World Health Organization (WHO) has classified FA as cancerogen and third largest indoor chemical pollutant due to its carcinogenicity and toxicity, for avoiding harm from FA, the tolerable daily intake of FA should be no more than 0.15 mg/kg [15, 16]. Thus, the development of dependable tool is critically needed to timely monitor FA level in vivo.
Thanks to the high selectivity, real-time and in situ imaging, fluorescent probes have attracted great attention [17-30]. So far, considerable amounts of excellent fluorescent probes have been observed for detecting and imaging intracellular FA [14, 31-36]. Despite the intensive efforts, most of probes are small molecule compounds and usually undergo the poor ability of less satisfactory water dispersity, biocompatibility and complex synthesis [37-41]. Compared with these traditional fluorescent probes based on small molecules, carbon dots (CDs)-based fluorescent nanoprobes have been developed for detecting multifarious biomarkers (e.g., NO, H2O2, Cys, Fe3+ and Cu2+) because of its outstanding water dispersity, favorable biocompati-bility, gratifying photostability and easy preparation [42-49]. However, most of them are simply utilized for one-photon microscopy (OPM) applications, and thus being limited to some extent mainly due to auto-fluorescence of biological tissues and small tissue-penetration depths [50-52]. To improve the short-coming in the OPM applications, some CDs with two-photon excitation were reported for detecting target markers, such as GSH, β-glucuronidase, etc. [53-55]. They could not only overcome the unwelcome water insolubility existed in traditional organic fluorescent probes, but also increase the tissue penetration, endow the lower background fluorescence and levels of photon scattering [50, 54, 55]. In view of the unique features of these CDs with two-photon excitation, it is extremely urgent to construct a CDs-based two-photon fluorescent probe for imaging and detecting FA in vivo.
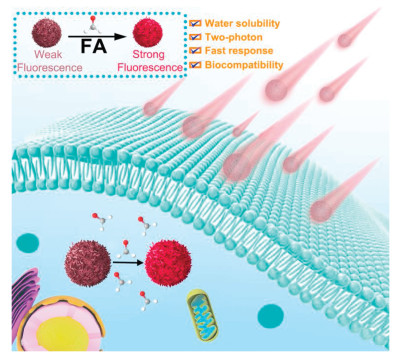
Herein, we described the development of red CDs (RCD) with two-photon excitation for detecting and imaging FA. As illustrated in Scheme 1, in the absence of FA, only a weak red fluorescence of RCD can be seen due to the strong hydrogen bonds between the -OH of solvents and -NH2 on the surface of RCD. However, upon addition of the FA, amine groups attached on the surface of CDs could rapidly react with aldehydes to form Schiff base, which subsequently resulted in the destruction of the strong hydrogen bond interaction between RCD and solvents. Therefore, RCD showed an obvious fluorescence increase and blue-shift of the emission peak. Moreover, combination with its satisfactory advantages including excellent water dispersity and biocompatibility, RCD were also successfully used for directly and in situ imaging FA in living cells and zebrafishes through the one-photon and two-photon excitation.

|
Download:
|
| Scheme 1. Schematic illustration of RCD for sensing and imaging FA. | |
For RCD designing, p-phenylenediamine (p-PD) was employed to fabricate RCD by using a simple one-pot hydrothermal strategy (Scheme S1 in Supporting information) [56]. Notably, this strategy is much more favorable to design the RCD-based excellent fluorescent probes because it not only possesses simple prepara-tion process, tunable surface-functionalization, outstanding fluo-rescent stability and high brightness, but also endows prominent water dispersity and biocompatibility. The preparation process of RCD and its diameter size (~10 nm) were well characterized by dynamic light scattering (DLS), transmission electron microscope (TEM), nuclear magnetic resonance (1H NMR), and fourier transform infrared spectroscopy (FTIR) (Figs. S1-S4 in Supporting information). The optical performance including UV-vis absorption spectra, fluorescence excitation spectra and emission spectra were also investigated (Figs. S5 and S6 in Supporting information). In addition, the fluorescence emission spectra of the RCD in various solvents with different polarity indicated the RCD have polarity-sensitive fluorescence emission (Fig. S7 in Supporting information).
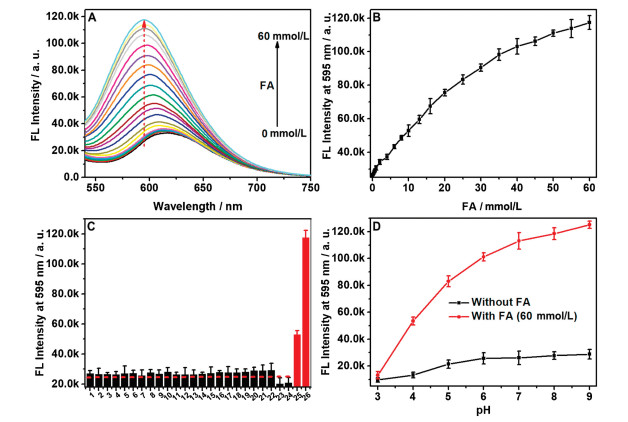
The fluorescence titration of RCD towards FA was firstly tested in a PBS buffer (pH 7.4). As denoted in Figs. 1 A and B, with the gradual addition of FA (from 0 to 60 mmol/L), the emission intensity of RCD at 595 nm steadily increased, accompanying an increase in quantum yield (QY, from 3% to 10.4%) and fluorescence lifetimes (from 2.58 to 4.42 ns, Fig. S8 in Supporting information). In addition, a clear blue shift (from 618 nm to 595 nm) can be observed. It was noteworthy that the RCD depicted outstanding response performance for the detection of FA even its concentration was as low as 100 μmol/L (Fig. S9 in Supporting information). In addition, a prominent linear relationship can be achieved via plotting the fluorescence intensity at 595 nm versus FA concentration (0-20 mmol/L) (Fig. S10 in Supporting information). And then the detection limit was also determined to be 9.9 μmol/L, thus evidencing that RCD were sensitive enough to sense FA level in biosystem (The concentration of FA: 0.2-0.4 mmol/L) [10, 57]. Consideration of formaldehyde has a relatively rapid reactivity in cells (seconds to minutes) [5], the kinetics of RCD in detection of FA was further examined, and the conversion reaction of RCD to RCD-FA was finished completely within 1 min (Fig. S11 in Supporting information), indicating that RCD could be acted as a forceful probe for rapid FA recognition in living cells.

|
Download:
|
| Fig. 1. (A) Fluorescence spectra of RCD (2 μg/mL) in PBS buffer (pH 7.4, 10 mmol/L) with the presence of different concentrations of FA (0-60 mmol/L, λex = 500 nm); (B) Fluorescence intensity at 595 nm for RCD (2 μg/mL) versus FA concentration; (C) Fluorescence intensity at 595 nm for the RCD (2 μg/mL) in the presence of one putative interferant: 1, Blank; 2, Na+ (100 mmol/L); 3, K+ (100 mmol/L); 4, F-(100 mmol/L); 5, Cl-(100 mmol/L); 6, Br-(100 mmol/L); 7, I-(100 mmol/L); 8, PO43- (100 mmol/L); 9, NO2-(100 mmol/L); 10, NO3-(100 mmol/L); 11, CO32- (100 mmol/L); 12, HCO3-(100 mmol/L); 13, SO42- (100 mmol/L); 14, SO32- (100 mmol/L); 15, HS-(100 mmol/L); 16, GSH (100 mmol/L); 17, Hcy (100 mmol/L); 18, Cys (100 mmol/L); 19, BSA (1.0 mg/mL); 20, glucose (100 mmol/L); 21, propanal (100 mmol/L); 22, acetaldehyde (100 mmol/L); 23, MDA; 24, MGO; 25, FA (10 mmol/L); 26, FA (60 mmol/L); λex = 500 nm; (D) Effects of pH on the fluorescence intensity of RCD (2 μg/mL) in the absence (black) and presence (red) of FA (60 mmol/L). | |
Subsequently, the selectivity of RCD towards FA was also examined by recording the fluorescence intensity (595 nm) of RCD in the presence of various possible putative interferents including anions, thiols and other aldehyde group compounds. As displayed in Fig. 1C, FA can cause an increased fluorescence intensity (595 nm), whereas MDA, MGO and other interferents exhibited a tiny change in fluorescence intensity (595 nm) of RCD. Further-more, the anti-interference experiments were also carried out. As denoted in Fig. S12 (Supporting information), upon addition of these interferents, the fluorescence intensity of RCD (595 nm) in the presence of FA illustrated a weeny change (< 10%). The above results indicated that the RCD can be utilized to the selective response of FA in complex biosystems.
Considering the environment of organism, the recognition behavior of RCD against FA was further investigated under buffer solutions with different pH values (from 3 to 9). The results in Fig. 1D exhibited that obvious fluorescence changes could be achieved from pH 4.0 to 9.0 with the addition of FA, which clearly demonstrated that the RCD were capable to monitor FA in multifarious physiological environments. In addition, the fluorescence stability of RCD before and after the addition of FA was also explored upon successive UV light irradiation (365 nm, 2.8 mW/cm2, Fig. S13 in Supporting information). High photostability was achieved, which was suitable for potential biological detecting and imaging applications.
According to previous reports, strong hydrogen bonds can be formed between the OH of solvents and -NH2 on the surface of RCD in some polar solvents (i.e., water, methanol and ethanol) with hydroxyl, which lead to the stabilization of the excited state and produce evident fluorescent quenching and red-shift (from green emission to red emission) [56, 58]. In this work, upon addition of FA, the amine groups of RCD could quickly and specially react with aldehydes to form Schiff base, which subsequently broken the strong hydrogen bond interaction between RCD and water. Therefore, the strong fluorescence of RCD and blue-shift emission was recovery in the presence of FA. The response mechanism of the RCD for sensing FA was proposed in Scheme S2. The expected mechanism was further confirmed using FTIR (Fig. S14 in Supporting information) and 1H NMR (Fig. S15 in Supporting information). Both of the results indicated that the amine groups of RCD reacted with FA to form a Schiff bases. Upon addition of FA, the same results were observed in the comparison between p-PD and RCD (Figs. S14 and S15). To further investigate this mechanism, the fluorescence titration of RCD towards FA was explored in ethanol. As illustrated in Fig. S15, upon gradual addition of FA (0-50 mmol/L), the fluorescence intensity (569 nm) of RCD steadily increased, along with a clear blue-shift (from 601 nm to 569 nm). In addition, some other polar solvents without hydroxyl moieties including acetone, acetonitrile, DMF and DMSO were employed to explore this mechanism. Compared with the polar solvents with hydroxyl, negligible increase of fluorescence intensity could be recorded (Fig. S17 in Supporting information), indicating that the weak hydrogen bonds and polar solvent could not lead to the stabilization of the excited state or produce evident fluorescent quenching and red-shift. Therefore, these above results undoubtedly agreed with the proposed reaction mechanism.
Encouraged by the excellent performance of RCD response to FA in buffered solution, we next assessed the RCD to image FA in live cells. At first, the cytotoxicity of RCD was evaluated with MTT assay using HepG2 cells (Fig. S18 in Supporting information). The result indicated that the RCD revealed little cytotoxicity up to 10 μg/mL and were propitious to the intracellular imaging. The IC50 value of the RCD was calculated to be 138.5 μg/mL (Fig. S18).
Subsequently, the RCD were utilized to investigate the feasibility of imaging intracellular FA in HepG2 cells with onephoton microscopy (OPM). As shown in Fig. 2, when the HepG2 cells were incubated with RCD only, it displayed weak fluorescence (Fig. 2I (D-F)); while the cells exhibited an evident red fluores-cence after co-incubated with the RCD and the different concentrations of FA (Fig. 2I (G-R), Ⅱ), which were accorded with the previous result of fluorescence measurement (Figs. 1A and B). The cellular localization of the RCD via co-staining with commercial subcellular dyes including LysoTracker and MitoTracker was performed (Fig. S19 in Supporting information). The Pearson's values were calculated to be 0.74 for lysosome and 0.39 for mitochondria, respectively, indicating that the RCD mainly stayed in lysosome.

|
Download:
|
| Fig. 2. (Ⅰ) Confocal fluorescence images of HepG2 cells incubated with RCD (5 μg/mL) and different concentrations of FA. Control (A-C), 0 mmol/L (D-F), 10 mmol/L (G-I), 20 mmol/L (J-L), 30 mmol/L (M-O), 40 mmol/L (P-R), respectively. Blue: Hoechst channel; Red: RCD channel. Scale bar = 20 mm. Inset: bright field images. (Ⅱ) Quantification of fluorescence intensity per unit area for the image group (B, E, H, K, N and Q). | |
Next, the two-photon fluorescence properties of RCD in the absence or presence of FA were investigated for the cell imaging. As manifested in Fig. S20 (Supporting information), with the addition of FA, the fluorescence intensity (595 nm) of RCD was enhanced with a two-photon excitation (740 nm). A power dependence experiment was further implemented in the absence or presence of FA (50 mmol/L). As depicted in Fig. S21 (Support-ing information), all slopes were close to 2 demonstrated that RCD and RCD-FA possessed a typical two-photon excitation process.
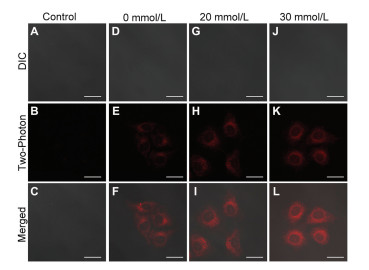
In addition, the RCD showed a maximal two-photon absorption cross-section (σ) of 103.4 GM at 740 nm after incubation with the 50 mmol/L of FA (Fig. S22 in Supporting information). To finally explore the two-photon microscopy (TPM) imaging ability for intracellular FA detection, the cells were imaged on a two-photon excitation (740 nm). Similar to the OPM imaging results, weak fluorescence was obtained in absence of FA. However, after the addition of 20 mmol/L and 30 mmol/L FA respectively, an enhanced red fluorescence can be observed in Fig. 3. The above results indicated that the RCD could be served as a good platform for OPM and TPM imaging of intracellular FA in live cells.

|
Download:
|
| Fig. 3. Two-photon fluorescence images of HepG2 cells incubated with RCD (5 μg/mL) and different concentrations of FA. (A-C): control, (D-F): 0 mmol/L, (G-I): 20 mmol/L, (J-L): 30 mmol/L. Scale bar = 20 μm. | |
Thanks to the excellent properties in living cells, we further evaluated the feasibility of RCD in vivo. Recently, a number of studies indicated that zebrafishes could be severed as a highly valuable vertebrate model to extensively apply for fluorescent probe research due to its around 87% homologous genes with humans and optical transparency of embryo and larva [59, 60]. Thus, zebrafishes were herein employed as the animal model to investigate the applicability of RCD. Firstly, the zebrafishes were incubated with RCD (50 μg/mL) for 1 h in an E3 medium. As depicted in Fig. 4B, compared with control group (Fig. 4A), a weak red fluorescence can be observed. After the zebrafishes were pretreated with RCD (50 μg/mL) for 1 h and subsequently treated with FA (5 mmol/L) for another 1 h, a gratifying enhance in red fluorescence intensity was found (Figs. 4C and F). Next, for further confirmation, the zebrafishes were pretreated with NaHSO3 (200 μmol/L, FA inhibitor) for 1 h and then followed by 1 h of incubation with RCD. As anticipated in Fig. 4D, only weak fluorescence signal was observed in red channel. Subsequently, the above experimental groups were incubated with FA (5.0 mmol/L) for another 1 h, we observed a slight increased red fluorescence signal (Fig. 4E). These zebrafishes imaging results illustrated that a clear enhanced red fluorescence could be attributed to the exogenous FA in zebrafishes. Note that a similar result can also be obtained under two-photon excitation (Figs. 4G-L). In addition, the fluorescence intensity at different depths (0-240 mm) was recorded via using the z-scan mode of two-photon fluorescence microscopy, as shown Fig. S23 (Supporting information), RCD could stain the tissue at depths interval of up to 240 mm under two-photon excitation. Therefore, the above experiments demon-strated that RCD can image and detect FA in vitro and in vivo with OPM and TPM.

|
Download:
|
| Fig. 4. One-photon (Ⅰ, A-F) and two-photon (Ⅱ, G-L) excited fluorescence images for zebrafish upon exposure to the RCD (50 μg/mL). (A, G) zebrafish was treated for 1 h in E3 medium; (B, H) zebrafish was pre-treated with 50 μg/mL RCD for 1 h; (C, I) zebrafish was pre-treated with RCD for 1 h and then treated with FA (5 mmol/L) for 1 h; (D, J) zebrafish was pre-treated with NaHSO3 (200 μmol/L) for 1 h and then treated with RCD (50 μg/mL) for 1 h; (E, K) zebrafish was pre-treated with NaHSO3 (200 μmol/L) for 1 h, then treated with RCD for 1 h and pretreated with FA (5 mmol/L) for 1 h; (F, L) Quantification of fluorescence intensities for group (A-E) and group (G-K), respectively. The collected fluorescent intensities from the images (A-E) and (G-K) were plotted, respectively. Values are the mean S.D. for n = 5 zebrafish larvae. λex = 480 nm (one-photon, λem= 500-700 nm); λex= 740 nm (two-photon, λem= 500-700 nm). Scale bar = 400 μm. | |
In order to further expand its application, round test papers with a diameter of 0.8 cm were firstly prepared by using filter paper loaded with RCD. As manifested in Fig. S24 (Supporting information), when the test papers were disposed for 30 s in FA with different concentration (from 0 to 1 mol/L), the fluorescence color of test papers revealed a clear change from red to orange, indicating that RCD can be acted as a visualized fluorescence indicator for rapidly tracking wide range concentration of FA in the point of care testing (POCT).
Compared with traditional small molecular fluorescent probes for FA (Table S1 in Supporting information), RCD revealed several advantages: First, RCD possessed favorable water dispersity and can be used in a completely buffered solution; Second, RCD revealed rapid response to FA (< 1 min); Third, it can directly and in situ imaging FA with TPM, while most of the current fluorescent probes displayed OPM imaging, thus, RCD can serve as competent tools for FA monitoring in live cells and in vivo.
In summary, we have successfully presented RCD for the detection of FA. In vitro experiments demonstrated that the RCD could detect FA with high selectivity and fast response. In addition, thanks to the advantages of outstanding water dispersity and satisfactory biocompatibility, the RCD were successfully utilized to monitor FA in live cells and zebrafishes with OPM and TPM. We expected that the RCD may be actually useful tools for the detection of FA in the living systems and studying its function in FA-associated diseases. Thus, future work toward this aspect, including the fabrication of CD-based near-infrared probes for detecting FA and the better performance of two-photon, are currently underway.
AcknowledgmentsWe gratefully acknowledge the financial support of the present work by the National Natural Science Foundation of China (Nos. 51773056, 51603067 and 21705040), Natural Science Foundation of Hunan Province, China (No. 2018JJ3143), China Postdoctoral Science Foundation (Nos. 2017M622571, 2017M622568 and 2018T110824), Open Project Program of State Key Laboratory of Chemo/Biosensing and Chemometrics (No. 2016019), Open Fund of the State Key Laboratory of Luminescent Materials and Devices (South China University of Technology) (No. 2019-skllmd-09) and Natural Science Foundation of Guangdong Province (No. 2017A030313299).
Appendix A. Supplementary dataSupplementary material related to this article can be found, in the online version, at doi:https://doi.org/10.1016/j.cclet.2019.09.021.
| [1] |
G. Burgos-Barragan, N. Wit, J. Meiser, et al., Nature 548 (2017) 549-554. DOI:10.1038/nature23481 |
| [2] |
A. Roth, H. Li, C. Anorma, et al., J. Am. Chem. Soc. 137 (2015) 10890-10893. DOI:10.1021/jacs.5b05339 |
| [3] |
I.V. Rosado, F. Langevin, G.P. Crossan, et al., Nat. Struct. Mol. Biol. 18 (2011) 1432-1434. DOI:10.1038/nsmb.2173 |
| [4] |
H. Kalasz, Mini-Rev. Med. Chem. 3 (2003) 175-192. DOI:10.2174/1389557033488187 |
| [5] |
E.A. Hoffman, B.L. Frey, L.M. Smith, et al., J. Biol. Chem. 290 (2015) 26404-26411. DOI:10.1074/jbc.R115.651679 |
| [6] |
H. Huang, P.B. Hopkins, J. Am. Chem. Soc. 115 (1993) 9402-9408. DOI:10.1021/ja00074a005 |
| [7] |
X.J. Liu, J.W. Locasale, Nature 548 (2017) 533-534. DOI:10.1038/nature23541 |
| [8] |
J.W. Locasale, Nat. Rev. Cancer 13 (2013) 572-583. DOI:10.1038/nrc3557 |
| [9] |
A.S. Tibbetts, D.R. Appling, Annu. Rev. Nutr. 30 (2010) 57-81. DOI:10.1146/annurev.nutr.012809.104810 |
| [10] |
Z. Tong, C. Han, W. Luo, et al., Age 35 (2013) 583-596. DOI:10.1007/s11357-012-9388-8 |
| [11] |
Z. Tong, J. Zhang, W. Luo, et al., Neurobiol. Aging 32 (2011) 31-41. DOI:10.1016/j.neurobiolaging.2009.07.013 |
| [12] |
K. Tulpule, R. Dringen, J. Neurochem. 127 (2013) 7-21. |
| [13] |
M.E. Andersen, H.J. Clewell III, E. Bermudez, et al., Toxicol. Sci. 118 (2010) 716-731. DOI:10.1093/toxsci/kfq303 |
| [14] |
Y. Tang, X. Kong, Z.R. Liu, et al., Anal. Chem. 88 (2016) 9359-9363. DOI:10.1021/acs.analchem.6b02879 |
| [15] |
Guidelines for Drinking-Water Quality, 2nd ed., vol. 2, World Health Organization, Geneva, 1993.
|
| [16] |
Y. Tang, X. Kong, A. Xu, et al., Angew. Chem. Int. Ed. 55 (2016) 3356-3359. DOI:10.1002/anie.201510373 |
| [17] |
J. Zhang, X. Chai, X.P. He, et al., Chem. Soc. Rev. 48 (2019) 683-722. DOI:10.1039/C7CS00907K |
| [18] |
Y. Wang, L. Feng, S. Wang, Adv. Funct. Mater. 29 (2019) 1806818. DOI:10.1002/adfm.201806818 |
| [19] |
P. Zhang, H. Wang, Y. Hong, et al., Biosens. Bioelectron. 99 (2018) 318-324. DOI:10.1016/j.bios.2017.08.001 |
| [20] |
C. Yu, X. Li, F. Zeng, et al., Chem. Commun. 49 (2013) 403-405. DOI:10.1039/C2CC37329G |
| [21] |
A.C. Sedgwick, L. Wu, H.H. Han, et al., Chem. Soc. Rev. 47 (2018) 8842-8880. DOI:10.1039/C8CS00185E |
| [22] |
P. Zhang, H. Wang, D. Zhang, et al., Sens. Actuators B 255 (2018) 2223-2231. DOI:10.1016/j.snb.2017.09.025 |
| [23] |
H.W. Liu, L. Chen, C. Xu, et al., Chem. Soc. Rev. 47 (2018) 7140-7180. DOI:10.1039/C7CS00862G |
| [24] |
W. Qin, C. Xu, Y. Zhao, et al., Chin. Chem. Lett. 29 (2018) 1451-1455. DOI:10.1016/j.cclet.2018.04.007 |
| [25] |
M. Gao, F. Yu, C. Lv, et al., Chem. Soc. Rev. 46 (2017) 2237-2271. DOI:10.1039/C6CS00908E |
| [26] |
P. Yuan, R. Ma, Q. Xu, Sci. China Chem. 59 (2016) 78-82. DOI:10.1007/s11426-015-5532-5 |
| [27] |
C. Xu, C. Xin, C. Yu, et al., Chem. Commun. 54 (2018) 13491-13494. DOI:10.1039/C8CC06698A |
| [28] |
W. Chen, A. Pacheco, Y. Takano, et al., Angew. Chem. Int. Ed. 55 (2016) 9993-9996. DOI:10.1002/anie.201604892 |
| [29] |
D. Li, B. Liu, P.J.J. Huang, et al., Chem. Commun. 54 (2018) 12519-12522. DOI:10.1039/C8CC07062H |
| [30] |
Z.P. Guan, N.Y. Gao, X.F. Jiang, et al., J. Am. Chem. Soc. 135 (2013) 7272-7277. DOI:10.1021/ja400364f |
| [31] |
X. Zhao, C. Ji, L. Ma, et al., ACS Sens. 3 (2018) 2112-2117. DOI:10.1021/acssensors.8b00664 |
| [32] |
H. Xu, H. Xu, S. Ma, et al., J. Am. Chem. Soc. 140 (2018) 16408-16412. DOI:10.1021/jacs.8b09794 |
| [33] |
X. Song, X. Han, F. Yu, et al., Analyst 143 (2018) 429-439. DOI:10.1039/C7AN01488K |
| [34] |
S. Singha, Y.W. Jun, J. Bae, et al., Anal. Chem. 89 (2017) 3724-3731. DOI:10.1021/acs.analchem.7b00044 |
| [35] |
T.F. Brewer, C.J. Chang, J. Am. Chem. Soc. 137 (2015) 10886-10889. DOI:10.1021/jacs.5b05340 |
| [36] |
Y.H. Lee, Y.H. Tang, P. Verwilst, et al., Chem. Commun. 52 (2016) 11247-11250. DOI:10.1039/C6CC06158C |
| [37] |
X. Huang, J. Song, B.C. Yung, et al., Chem. Soc. Rev. 47 (2018) 2873-2920. DOI:10.1039/C7CS00612H |
| [38] |
K. Li, B. Liu, Chem. Soc. Rev. 43 (2014) 6570-6597. DOI:10.1039/C4CS00014E |
| [39] |
Y.W. Wang, L. Wu, C.Y. Liu, et al., J. Mater. Chem. B 5 (2017) 3377-3382. |
| [40] |
H. Zhu, J.L. Fan, Q.L. Xu, et al., Chem. Commun. 48 (2012) 11766-11768. DOI:10.1039/c2cc36785h |
| [41] |
Z. Xie, B. Yin, J. Shen, et al., Org. Biomol. Chem. 16 (2018) 4628-4632. DOI:10.1039/C8OB00989A |
| [42] |
S. Bhattacharya, R. Sarkar, B. Chakraborty, et al., ACS Sens. 2 (2017) 1215-1224. DOI:10.1021/acssensors.7b00356 |
| [43] |
C. Yu, Y. Wu, F. Zeng, et al., J. Mater. Chem. B 1 (2013) 4152-4159. DOI:10.1039/c3tb20686f |
| [44] |
C.Q. Ding, A.W. Zhu, Y. Tian, Acc. Chem. Res. 47 (2014) 20-30. DOI:10.1021/ar400023s |
| [45] |
W. Song, W. Duan, Y. Liu, et al., Anal. Chem. 89 (2017) 13626-13633. DOI:10.1021/acs.analchem.7b04211 |
| [46] |
W. Lv, M. Lin, R. Li, et al., Chin. Chem. Lett. 30 (2019) 1410-1414. DOI:10.1016/j.cclet.2019.04.011 |
| [47] |
J. Chen, Y. Li, K. Lv, et al., Sens. Actuators B 224 (2016) 298-306. DOI:10.1016/j.snb.2015.10.046 |
| [48] |
G. Gao, Y.W. Jiang, H.R. Jia, et al., Carbon 134 (2018) 232-243. DOI:10.1016/j.carbon.2018.02.063 |
| [49] |
X.W. Hua, Y.W. Bao, J. Zeng, et al., ACS Appl. Mater. Interfaces 11 (2019) 32647-32658. DOI:10.1021/acsami.9b09590 |
| [50] |
D. Li, P. Jing, L. Sun, et al., Adv. Mater. 30 (2018) e1705913. DOI:10.1002/adma.201705913 |
| [51] |
L. Qian, L. Li, S.Q. Yao, Acc. Chem. Res. 49 (2016) 626-634. DOI:10.1021/acs.accounts.5b00512 |
| [52] |
Z.D. Xie, M.L. Fu, B. Yin, et al., Chin. J. Org. Chem. 38 (2018) 1364-1376. DOI:10.6023/cjoc201712031 |
| [53] |
L. Cao, X. Wang, M.J. Meziani, et al., J. Am. Chem. Soc. 129 (2007) 11318-11319. DOI:10.1021/ja073527l |
| [54] |
H.M. Meng, D. Zhao, N. Li, et al., Analyst 143 (2018) 4967-4973. DOI:10.1039/C8AN00677F |
| [55] |
P.W. Gong, L. Sun, F. Wang, et al., Chem. Eng. J. 356 (2019) 994-1002. DOI:10.1016/j.cej.2018.09.100 |
| [56] |
K. Jiang, S. Sun, L. Zhang, et al., Angew. Chem. Int. Ed. 54 (2015) 5360-5363. DOI:10.1002/anie.201501193 |
| [57] |
R. Baan, Y. Grosse, K. Straif, et al., Lancet Oncol. 10 (2009) 1143-1144. DOI:10.1016/S1470-2045(09)70358-4 |
| [58] |
H. Wang, C. Sun, X. Chen, et al., Nanoscale 9 (2017) 1909-1915. DOI:10.1039/C6NR09200D |
| [59] |
Y.B. Liu, D.L. Li, Z. Yuan, Appl. Sci. 6 (2016) 392. DOI:10.3390/app6120392 |
| [60] |
S.K. Ko, X. Chen, J. Yoon, et al., Chem. Soc. Rev. 40 (2011) 2120-2130. DOI:10.1039/c0cs00118j |