 2020, Vol. 31


b Department of Chemistry, School of Science, Beijing Technology and Business University, Beijing 100048, China
As the next generation of solid-state lighting diodes, white LEDs are believed to trigger a lighting revolution. LEDs have many distinct advantages over traditional incandescent and halogen lamps, such as energy savings, long life, and high efficiency [1-3]. There are many potential applications for white LEDs, such as everyday lighting, LCD backlights, and displays, so white LEDs have received widespread attention in recent years [4, 5]. The earliest commercializedwhite LEDs were developed by Nichia Corporation of Japan using blue light from GaN-based LED chips to excite rare earth phosphor YAG:Ce3+ to emit yellow light and combine it into white light [6-8]. However, such a white LED lacks a spectrum of a red light region, resulting in a poor color rendering index and low luminous efficiency. At present, the use of near-ultraviolet chips to excite trichromatic phosphors to achieve white light production has become the focus of currentwhite LEDs industry development [9-11]. This method overcomes the shortcomings of high color temperature and low color rendering index of "yellow-blue" combined white LED. Lumen efficiency and color reproduction performance are greatly affected by problems such as color resorption and ratio adjustment between multi-component phosphors [12]. Therefore, it has become a top priority to develop a new type of phosphor that can overcome the deficiency of mixed phosphors and improve luminescence property.
Up to date, a method of adjusting white light generated by energy transfer (ET) between a sensitizer and an activator has been obtained in a single matrix phosphor, such as Sr3NaLa(PO4)3F:Eu2+, Mn2+ [13], Ca4(PO4)2O:Dy3+, Eu2+ [14], and Ca3YNa(PO4)3:Ce3+, Mn2+ [15]. From the standpoint of the reaction conditions, these reactions need to be carried out strictly under a reducing gas (N2/H2). However, single-component phosphors synthesized in the reaction air will be more promising. Due to the transition from Dy3+ 4F9/2 level to 6H13/2 and 6H15/2, Dy3+ ions can produce strong blue and yellow emission bands with peaks at 483 and 574 nm [16, 17]. White light can be produced by appropriately combining the two kinds of light. However, in most cases, the yellow emission of Dy3+ is stronger than the blue emission, resulting in yellowwhite light by single-doped Dy3+ ions. To overcome this problem, Tm3+ ion is introduced because it produces blue emission due to 1D2-3F4 transition (about 453 nm) [18, 19]. There are some reports on such white phosphors, such as, BaLaGa3O7:Tm3+, Dy3+ [20], YAl3(BO3)4: Tm3+, Dy3+ [21], and BaWO4:Tm3+, Dy3+ [22]. Therefore, by simultaneously doping Tm3+ and Dy3+ ions into a single host, a white light of a suitable yellow-blue intensity ratio can be obtained.
Apatite refers to a group of minerals represented by calcium phosphate. Its crystal chemical formula is M5[XO4]3Z, where M is a +1, +2 and +3 valence metal; XO4 is a variety of acid ions; Z is an additional anions F-, Cl-, (OH)-, O2-, and so on. The apatite crystal belongs to the hexagonal system, P63/m, and the unit cell is Z = 2 [23, 24]. Hence, the apatite structure is an extraordinary structural model for designing high quality new phosphors. In this work, a series of single host white-emitting Ba3LaNa(PO4)3F:Tm3+, Dy3+ phosphors were prepared and their luminescence properties were investigated in detail. The results show that this strong coloradjustable BLNPF:Tm3+, Dy3+ phosphor has great potential as a UVpumped white LED.
Tm3+, Dy3+ co-doped Ba3LaNa(PO4)3F phosphor was prepared by high temperature solid phase method. Based on the preparation of 1 g of the target product, BaCO3, La2O3, NH4H2PO4, Na2CO3, BaF2, Tm2O3, and Dy2O3 were weighed according to a molar ratio of 3:(1- x-y)/2:1/2:3:1/2:1/2: x: y. The above raw materials were placed in a mortar and thoroughly ground, and the mixture was placed in an alumina crucible and placed in a high temperature tube furnace. The temperature was raised from room temperature to 1050 ℃ at a heating rate of 10 ℃/min, and kept at 1050 ℃ for 3 h. After being naturally cooled to room temperature, it is sufficiently ground with a mortar to obtain Ba3LaNa(PO4)3F:Tm3+, Dy3+ phosphor, and the next step is characterized.
Phase structure analysis was performed by a Bruker D2 X-ray diffractometer (XRD) using an X-ray source of Cu-K α ( λ = 1.5406 Å), a scan current of 10 mA, a scan voltage of 30 kV, and a scan rate of 0.08×/s, scan range is20×±80×. The excitation and emission spectra were measured using a Hitachi F-4600 fluorescence spectrometer with a 150 W xenon lamp with a slit width of 5 nm and a test voltage of 400 V. The instrument used for fluorescence decay lifetime was a FluoroLog-3 fluorescence spectrometer (HORIBA, France) using a Specral-LED (N-370) with a pulse width of 12 ns. All tests were performed at room temperature.
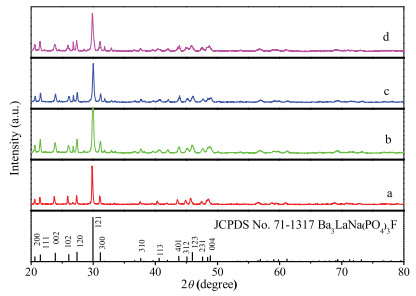
XRD patterns of the as-prepared phosphors were collected to verify the phase purity. Fig. 1 shows the XRD patterns of Ba3LaNa(PO4)3F, Ba3La0.975Na(PO4)3F:0.025Tm3+, Ba3La0.960Na (PO4)3F:0.040Dy3+, and Ba3La0.945Na(PO4)3F:0.025Tm3+, 0.030Dy3+ phosphors. It is clear that according to JCPDS documents 71–1317, all diffraction peaks of these samples can be accurately assigned to the pure hexagonal phase of Ba3LaNa(PO4)3F. The map shows that no significant changes in crystal structure caused by other phases or impurities were detected, demonstrating that Tm3+ and Dy3+ ions successfully entered the Ba3LaNa(PO4)3F host [25]. In Ba3LaNa(PO4)3F host, Tm3+ and Dy3+ substitute La3+ sites because of the similar ionic radii.

|
Download:
|
| Fig. 1. XRD patterns of (a) Ba3LaNa(PO4)3F; (b) Ba3La0.975Na(PO4)3F:0.025Tm3+; (c) Ba3La0.960Na(PO4)3F:0.040Dy3+; (d) Ba3La0.945Na(PO4)3F:0.025Tm3+, 0.030Dy3+ and the standard data Ba3LaNa(PO4)3F (JCPDS No. 71-1317) as a reference. | |
The relationship between the emission intensity of Tm3+ and its doping concentration is shown in Fig. S1 (Supporting information). Meanwhile, in the emission wavelength range of 400–550 nm, the main emission peak of Tm3+ is located at 453 nm, which belongs to the transition of 1D2-3H6. The phosphor exhibits a strong blue emission, revealing its potential value in blue-emitting LED applications. Moreover, another relatively weak blue emission was observed due to the 1G4-3H6 transition of the Tm3+ ions [26]. As the concentration of Tm3+ ions increases, the emission intensity is positively correlated with the ion concentration until the maximum value is reached at x = 0.025, and concentration quenching occurs.
Fig. S2 (Supporting information) demonstrated the emission and excitation spectra of Tm3+ and Dy3+ single doped and Tm3+/Dy3+ co-doped Ba3LaNa(PO4)3F phosphors. Fig. S2a displays the PL and PLE spectra of the Ba3La0.975Na(PO4)3F:0.025Tm3+ phosphor. The PLE spectrum monitored at 453 nm exhibited one peak centered at 358 nm corresponding to the transition from the 3H6 ground state to the 1D2 excited state of Tm3+. The band emission spectral characteristic has been discussed above. Fig. S2b shows the PLE and PL emission spectra of the Ba3La0.960Na (PO4)3F:0.040Dy3+ phosphor. The excitation spectrum consists of a series of sharp bands centered around 325, 350, 363, 387, 426, 452 and 477 nm, which are attributed to the 4f-4f transitions of Dy3+ ions from the ground state of 6H15/2 to the excited states of 4M17/2, 9P7/2, 4P5/2, 4I13/2, 4G11/2, 4I15/2 and 4F9/2, respectively [27]. It was clear that three main peaks located at 480 nm (4F9/2-6H15/2), 573 nm (4F9/2-6H13/2), and 663 nm (4F9/2-6H11/2) [28]. To further confirm the possible energy transfer process, Fig. S2c illustrates the PLE and PL spectra of Ba3La0.945Na(PO4)3F:0.025Tm3+, 0.030Dy3+ phosphor. A notable spectral overlap between the PLE spectrum of Ba3La0.960Na(PO4)3F:0.040Dy3+ and the PL spectrum Ba3La0.975Na- (PO4)3F:0.025Tm3+ is observed. So that the energy transfer from Tm3+ and Dy3+ ions can be achieved in the Ba3LaNa(PO4)3F host.
By changing the relative concentrations of co-doped Tm3+ and Dy3+, the energy transfer process between Tm3+→Dy3+ ions can be further studied. It can be seen from Fig. 2 that the emission spectrum after co-doping is composed of Tm3+ and Dy3+, and the emission intensity of Tm3+ is significantly reduced as the Dy3+ doping concentration increases. This is due to the continuously enhanced energy transfer process between Tm3+ and Dy3+. Later, due to the concentration quenching between Dy3+ and Dy3+, the Dy3+ emission peak intensity increases first and then decreases and reaches a maximum at y = 0.030.

|
Download:
|
| Fig. 2. Dependence of the PL spectra of Ba3La0.975-yNa(PO4)3F:0.025Tm3+, yDy3+ samples on the Dy3+ concentrations. The inset shows the relative intensity of Tm3+ (453 nm) and Dy3+ (573 nm) ions emission as a function of the doped content of Dy3+ ions. | |
In order to further verify the energy transfer from Tm3+ and Dy3+, we synthesize a series of samples Ba3LaNa(PO4)3F: xTm3+, 0.040Dy3+. Fig. S3 (Supporting information) shows the PL spectra of Ba3LaNa(PO4)F: xTm3+, 0.040Dy3+. The inset shows the emission intensity trends of Tm3+ (453 nm) and Dy3+ (573 nm). At 350 nm excitation, the shape of the PL spectrum is very similar to the 0.025Tm3+, yDy3+ sample. It is apparent from the inset that as the Tm3+ doping concentration increases, the emission intensity at 453 nm gradually increases. However, the intensity of luminescence at Dy3+ (573 nm) increased firstly, reached its maximum when x = 0.015, then decrease.
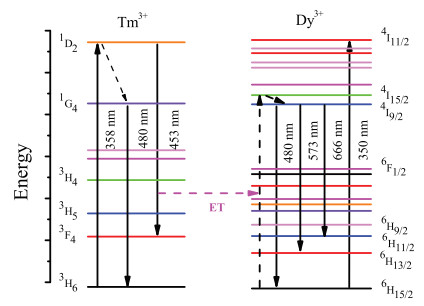
Fig. 3 illustrates the energy level model of the energy transfer process between Tm3+-Dy3+ in the BLNPF host. When Ba3LaNa (PO4)3F:Tm3+, Dy3+ phosphor is excited by 358 nm, the ground state electron (6H15/2) of Dy3+ ion is pumped to the excited state 4I11/2 state by energy transfer from Tm3+ ion. This is due to the difference between the similar energy gaps of the two ions of Tm3+ (1D2-3F4) and Dy3+ (6H15/2-4I15/2). Radiation transitions from 4F9/2 to 6H15/2, 6H13/2, and 6H11/2 can cause the emission main peaks to be centered at 480, 573, and 663 nm, respectively.

|
Download:
|
| Fig. 3. Energy level scheme of Ba3LaNa(PO4)3F:Tm3+, Dy3+phospor with electronic transitions and energy transfer process. | |
By changing the relative intensities of co-doped Tm3+/Dy3+ ions, the formula for calculating the energy transfer efficiency ( ηET) of Tm3+→Dy3+ is [29]:

|
(1) |
here, IS and IS0 are the emission intensities of Tm3+ ions when undoped and doped with Dy3+ ions, respectively. It can be visually seen from the Fig. S4(Supporting information)that the ηET value increases with the increase of Dy3+ ion concentration.When y = 0.04, the maximum ηET value is about 72.6%.
In general, the resonant energy transfer process mainly has two types of exchange interaction and electric multipole interaction. When the exchange interaction is dominant, the critical distance between the sensitization center and the activation center should be less than 5 Å. The critical distance ( Rc) from Tm3+ to Dy3+ energy transfer can be calculated by the formula given by Blasse [30, 31]:

|
(2) |
where V is the volume of the unit cell; XC is the critical concentration; N is the number of cations in the unit cell. For the BLNPF host, V = 626.735 Å3, N = 2, XC = 0.055, so the critical distance RC is determined to be 22.16 Å. Therefore, the energy transfer mechanism in this system is limited by electric multipole interaction.
The following relationship can be obtained by analyzing the energy transfer type between the sensitizer ions Tm3+ and the activator ions Dy3+ in Dexter's multipole interaction energy transfer expression and Reisfeld approximation [32]:

|
(3) |
where η0 and ηS are the luminescence quantum efficiencies of Tm3+ ions in the absence and presence of Dy3+ ions, respectively; C is the total doping concentration of Tm3+ and Dy3+ ions. When n = 6, 8, and 10, they correspond to dipole-dipole, dipole-quadrupole, and quadrupole-quadrupole interaction, respectively. The value of η0/ηS can be approximately replaced by the luminous intensity ratio IS0/IS. Fig. S5 (Supporting information) shows relationship betweenIS0/IS and C6/3, C8/3 and C10/3 of Tm3+ ions. It can be found that when n = 6, the best linear fit is obtained. The analysis shows that energy transfer from Tm3+ to Dy3+ occurs via a dipole-dipole mechanism.
The decay curves of Ba3La0.975-yNa(PO4)3F:0.025Tm3+, yDy3+ phosphors measured at 453 nm emission with 358 nm excitation were also detected, and the decay curves are shown in Fig. S6 (Supporting information). It is found that all the decay curves can be fitted well with a second-order exponential decay, which can be obtained using the equation [33, 34]:

|
(4) |
where I is the luminescence intensity, t is the time, A1 and A2 are constants, and τ1 and τ2 are rapid and slow decay times for the exponential components, respectively. According to the parameters in Eq.5, the average lifetime t* can be obtained using the formula:

|
(5) |
Based on the second-order exponential function and the decay curve, Ba3La0.975-yNa(PO4)3F:0.025Tm3+, yDy3+ at 358 nm excitation. The fluorescence decay timet at 453 nm decreases with increasing Dy3+ doping concentration, and the corresponding Tm3+ fluorescence decay time τ is 7.96, 7.78, 6.56, 6.34 and 6.12ms, respectively. Therefore, the energy of Tm3+ in the co-doped sample can be transferred to Dy3+ ions.
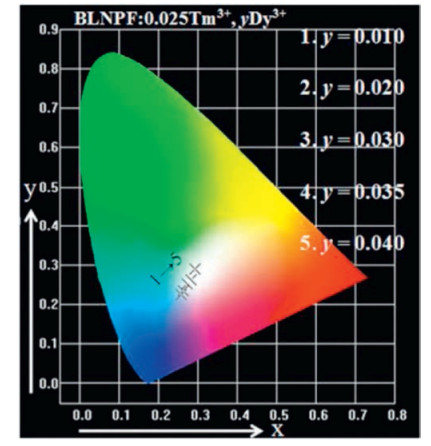
The emission spectrum of Ba3La0.975-yNa(PO4)3F:0.025Tm3+, yDy3+ phosphors were converted to the CIE 1931 chromaticity using the photoluminescence data and the CIE software diagram as shown in Fig. 4. It can be seen from the figure that as the concentration of Dy3+ increases, the CIE chromaticity coordinates change from (0.2830, 0.2992) to (0.3109, 0.3503), and the corresponding illuminating color gradually changes from blue to white. Obviously, by adjusting the doping concentration of Dy3+ in Ba3LaNa(PO4)3F:Tm3+, Dy3+, warm white light can be produced for different practical applications.

|
Download:
|
| Fig. 4. The CIE chromaticity diagram for Ba3La0.975-yNa(PO4)3F:0.025Tm3+, yDy3+ phosphors. | |
In summary, we synthesized a series of Ba3LaNa(PO4)3F:Tm3+, Dy3+ phosphors by high temperature solid phase reaction. Under the excitation of UV light, the characteristic peaks of Tm3+ and Dy3+ ions appeared in Ba3LaNa(PO4)3F: xTm3+ and Ba3LaNa(PO4)3F: yDy3+ phosphors, respectively. In addition, it is matched to commercial UV LED chips when excited at 358 nm. By fixing the Tm3+ ions concentration and changing the ions concentration of Dy3+, the luminescence color of Ba3LaNa(PO4)3F:0.025Tm3+, yDy3+ phosphor can be changed from blue to white. The analysis shows that the dipole-dipole interaction should be the reaction mechanism of the transferof energyfromTm3+toDy3+ions. These resultsindicate that Ba3LaNa(PO4)3F:Tm3+, Dy3+ may serve as a white light-emitting phosphor for white light LED.
Appendix A. Supplementary dataSupplementary material related to this article can be found, in the online version, at doi:https://doi.org/10.1016/j.cclet.2019.04.046.
| [1] |
N. Guo, Y.J. Huang, Y.C. Jia, et al., Dalton Trans. 42 (2013) 941-947. DOI:10.1039/C2DT31657A |
| [2] |
C. Feldmann, T. Jüstel, C.R. Ronda, P. Schmidt, Adv. Funct. Mater. 13 (2010) 511-516. |
| [3] |
C.C. Lin, R.S. Liu, J. Phys. Chem. Lett. 2 (2011) 1268. DOI:10.1021/jz2002452 |
| [4] |
M.L. Zhang, Z.G. Xia, M.S. Molokeev, L. Shi, Q.L. Liu, J. Mater. Chem. C 4 (2016) 9078-9084. DOI:10.1039/C6TC03373C |
| [5] |
H. Okamoto, K. Kasuga, I. Hara, Y. Kubota, Opt. Express 17 (2009) 20227-20232. DOI:10.1364/OE.17.020227 |
| [6] |
S.F. Gao, C.L. Sun, Y.X. Ji, et al., Mater. Express 3 (2013) 127-134. DOI:10.1166/mex.2013.1107 |
| [7] |
X.F. Wang, Q. Liu, Y.Y. Bu, et al., RSC Adv. 5 (2015) 86219-86236. DOI:10.1039/C5RA16986K |
| [8] |
Y.H. Zheng, X. Sun, H.J. Su, L.B. Sun, C.X. Qi, Mater. Res. Bull. 105 (2018) 149-153. DOI:10.1016/j.materresbull.2018.04.031 |
| [9] |
L. Guerbous, M. Derbal, J.P. Chaminade, J. Lumin. 130 (2010) 2469-2475. DOI:10.1016/j.jlumin.2010.08.014 |
| [10] |
K. Li, Y. Zhang, X.J. Li, et al., Phys. Chem. Chem. Phys. 17 (2015) 4283-4292. DOI:10.1039/C4CP03894K |
| [11] |
Z.L. Fu, X.J. Wang, Y.M. Yang, et al., Dalton Trans. 43 (2014) 2819-2827. DOI:10.1039/C3DT52231H |
| [12] |
Z.G. Xia, R.S. Liu, K.W. Huang, et al., J. Mater. Chem. 22 (2012) 15183-15189. DOI:10.1039/c2jm32733c |
| [13] |
S.S. Hu, W.J. Tang, J. Lumin. 145 (2014) 100-104. DOI:10.1016/j.jlumin.2013.07.044 |
| [14] |
Z.Q. Hu, Y. Guo, J.H. Zhang, Y.J. Zhang, J. Mater. Sci. 53 (2018) 6414-6423. DOI:10.1007/s10853-017-1947-z |
| [15] |
A.X. Guan, C.Y. Yao, G.F. Wang, et al., Luminescence 32 (2017) 529-534. DOI:10.1002/bio.3208 |
| [16] |
D.L. Monika, H. Nagabhushana, R.H. Krishna, et al., RSC Adv. 4 (2014) 38655-38662. DOI:10.1039/C4RA04655B |
| [17] |
F. Zhang, T. Zhang, G.Q. Li, W.F. Zhang, J. Alloys Compd. 618 (2015) 484-487. DOI:10.1016/j.jallcom.2014.08.178 |
| [18] |
G.M. Cai, N. Yang, H.X. Liu, J.Y. Si, Y.Q. Zhang, J. Lumin. 187 (2017) 211-220. DOI:10.1016/j.jlumin.2017.03.017 |
| [19] |
J. Wang, Y.H. Xu, M. Hojamberdiev, et al., J. Alloys. Compd. 479 (2009) 772-776. DOI:10.1016/j.jallcom.2009.01.076 |
| [20] |
S.F. Gao, S. Xu, Y.Q. Wang, C.Y. Tu, J. Lumin. 178 (2016) 282-287. DOI:10.1016/j.jlumin.2016.05.040 |
| [21] |
G.V. Lokeswara, L.R. Moorthy, P. Packiyaraj, B.C. Jamalaiah, Opt. Mater. 35 (2013) 2138-2145. DOI:10.1016/j.optmat.2013.05.038 |
| [22] |
H.Y. Wu, J.F. Yang, X.X. Wang, Solid. State. Sci. 79 (2018) 85-92. DOI:10.1016/j.solidstatesciences.2018.02.009 |
| [23] |
J. Zhou, Q.L. Liu, Z.G. Xia, J. Mater. Chem. C 6 (2018) 4371-4383. DOI:10.1039/C8TC01043A |
| [24] |
A.M. Latshaw, K.D. Hughey, M.D. Smith, et al., Inorg. Chem. 54 (2014) 876-884. |
| [25] |
Q.F. Guo, B. Ma, L.B. Liao, et al., Cream. Int. 42 (2016) 11687-11691. DOI:10.1016/j.ceramint.2016.04.086 |
| [26] |
Y.X. Cao, X. Ding, Y.H. Wang, J. Am. Cream. Soc. 99 (2016) 3696-3704. DOI:10.1111/jace.14394 |
| [27] |
W.T. Zhang, M. Yu, Z.Q. Wu, Y.Q. Wang, P.C. Zhang, J. Mater. Sci. 29 (2018) 8224-8233. |
| [28] |
M.H. Tong, Y.J. Liang, G.G. Li, Z.G. Xia, F. Yang, Opt. Mater. 36 (2014) 1566-1570. DOI:10.1016/j.optmat.2014.04.026 |
| [29] |
J.C. Joshi, B.C. Joshi, N.C. Pandey, R. Belwal, J. Joshi, J. Solid State Chem. 22 (1977) 439-443. DOI:10.1016/0022-4596(77)90021-4 |
| [30] |
G. Blasse, J. Solid State Chem. 62 (1986) 207-211. DOI:10.1016/0022-4596(86)90233-1 |
| [31] |
Y. Tian, N.N. Feng, M.W. Wieczorek, et al., Dyes Pigm. 131 (2016) 91-99. DOI:10.1016/j.dyepig.2016.04.010 |
| [32] |
D.L. Dexter, J.H. Schulman, J. Chem. Phys. 22 (1954) 1063-1066. DOI:10.1063/1.1740265 |
| [33] |
Q. Zhang, X.C. Wang, X. Ding, Y.T. Wang, Dyes Pigm. 149 (2018) 268-275. DOI:10.1016/j.dyepig.2017.10.004 |
| [34] |
D. Qin, W.J. Tang, RSC Adv. 6 (2016) 45376-45385. DOI:10.1039/C6RA10763J |