 2020, Vol. 31


b Department of Inorganic Chemistry, Shenyang Pharmaceutical University, Benxi 117004, China
The development of advanced energy storage devices such as supercapacitors has become the key to employ sustainable energy resources to accommodate the fast consumption of fossil fuels [1]. There are two major types of supercapacitors, one that is named pseudo-capacitors and based on redox active electrode materials. These materials usually include metal oxides, conducting polymers, and carbons rich in oxygen and nitrogen containing surface functional groups, which can operate through fast and reversible surface or near-surface Faradic reactions. The other type is the electric double layer capacitors (EDLCs), which is featured with a large surface area to keep the electrons or ionic charges at the electrode–electrolyte interface [2, 3]. On the other hand, the combination of the pseudo-capacitors with the EDLCs has also been investigated by scientists [4-6], as this type of supercapacitors would be featured with high conductivity, high surface area, redox capability, eco-friendliness and excellent electrochemical stability [2]. Therefore, the carbon-based materials should be taken into consideration due to the high conductivities, low fabrication costs and abundant resources [7, 8]. However, there are still several challenges in the development of this new energy storage devices material to meet the increasing demands for reliable efficient energy storage devices.
Graphene, as one of the most important discovery in 21st century, is featured with a 2D monolayer structure with sp2-bonded carbon atoms that provides a large specific surface area [8], and excellent electrical, mechanical and thermal properties [9], which further benefit the electron absorption on the surface [10]. Two most popular methods to synthesize graphene are oxidation-reduction method and CVD method, which can yield graphene with high quality and uniform size [11, 12]. On the other hand, this method harms the environment and could be dangerous during experimental operation. It can also bring in oxygen containing functional groups which can have a negative effect on the conductivity of the material [13]. Therefore, it remains a big challenge to apply on mass production application.
The unique worm-like structure of expanded graphite makes it a promising method to generate few-layer graphene products by exfoliating the expanded graphite [14]. However, very few works have been done to utilize the expanded graphite for supercapacitor applications. Guo reported a method to prepare expanded graphite/active carbon composites to be used in supercapacitors. The maximum of the mass specific capacitor was 359 F/g [15]. F. Barzegar also reported the preparation of porous carbon from expanded graphite for high energy density supercapacitor in aqueous electrolyte, which gave a high specific capacitance of 337 F/g at a current density of 0.5 A/g, together with a high energy density of 37.9 Wh/kg at a power density of 450 W/kg [16]. Although both of the materials were featured with high specific surface area, no redox reactions happened on their surface, indicating no pseudo capacitor properties existed on these materials. Therefore, these methods need a strategy to improve their materials by equipping the pseudo capacitor so as achieve to enhance the specific capacitance.
In order to further modify the electro-chemical property and enhance the ability of electron absorption of graphene, doping nitrogen atom into graphene plane can be a good method due to the fact that the nitrogen atom has comparable size and contains five valence electrons available to form strong valence bonds with carbon atom [17]. The functional nitrogen containing structures such as pyridine N, pyrrolic N and graphitic nitrogen can be an enhancer as pseudo-capacitors due to their redox reactions [18-21]. Lu has reported a method using o-phenylenediamine as the double-N precursor to synthesize N-doped graphene (NG) materials. Comparing to the electrode made from pristine graphene oxide (GO), the N-doped graphene electrode showed a high specific capacitance of 301 F/g at a current density of 0.1 A/g in 6 mol/L KOH electrolyte, almost 50% higher than that of the pristine GO electrode (210 F/g at 0.1 A/g) [22]. You also synthesized the three-dimensional N-doped graphene–CNT networks. The electrode of N-doped graphene–CNT networks showed excellent capacitive behavior, with high specific capacitance of 180 F/g at a current density of 0.5 A/g and still retains approximately 96% of the initial capacitance after 3000 cycles [21]. Sui presented a facile method to the prepare nitrogen-doped graphene aerogel (NGA) with excellent electrical conductivity and high nitrogen level (8.4 at%), which was featured with a highly porous network. The electrodes made from NGA materials exhibited a high specific capacitance (223 F/g at 0.2 A/g), excellent rate performance, and long-term cycling stability [23]. However, these N-doped materials can hardly be manufactured in industrial scale due to that they are difficult to prepare and need higher costs. In this paper, we utilized the expandable graphite as the carbon resource and melamine as the nitrogen resource as well as the intercalation agent and reductant, to exfoliate the graphite and produce graphene with extraordinary electrochemical properties for supercapacitor applications [24].
In this work, we presented a novel method featured with low costs and simple preparation process, to synthesize few-layer N-doped graphene with high electrochemical performance. Briefly, the N-doped expanded graphite can be obtained by heating the mixture of expandable graphite and melamine to 900 ℃, which was further exfoliated to few-layer N-doped graphene (FNG) by ball-milling method [25]. Owing to the redox property of FNG materials, the capacitor made with FNG electrode exhibited the properties of the pseudo-capacitors and EDLCs. The FNG electrode has high response time which can make our electrode have the ability of fast charging and discharging, improved specific capacitance. It is also easily prepared which benefited the industrial manufacture of FNG based capacitors.
In this experiment, the mixture of 0.5 g expandable graphite and melamine with different weight ratio (1:0, 1:1, 1:3, 1:5, 1:7.5, 1:10) were loaded to the agate mortar and milled for 15 min, followed by being loaded into a tube furnace (OTF-1200X-60, Kejing) and heated at 900 ℃ for 6 h in nitrogen atmosphere. The black worm-like samples were obtained and further milled in the planetary ball-milling machine (Pulverisette 7, Fritsch) at the condition of 500 rpm, 24 h using ethanol as the milling medium to avoid aggregation [26]. After the milling process, a black suspension was obtained and further centrifuged at 1000 r/min for 5 min to collect the supernatant. Finally, the supernatant was centrifuged at 13,000 r/min for 10 min, then collected and dried at 60 ℃ in the vacuum drying oven. The samples with different graphite: melamine ratio (1:0, 1:1, 1:3, 1:5, 1:7.5, 1:10) were named with sample 1-0, sample 1-1, sample 1-3, sample 1-5, sample 1–7.5, sample 1–10 respectively.
To fabricate the electrode, we extracted 20 mL black suspension into the centrifuge tube after the ball-milling step described above. Then a carbon paper was used as current collector to adsorb the Ndoped graphene and put into the centrifuge tube because the carbon paper can be used as electrode due to its excellent conductivities. Compared to the Ni foam used in other studies [22], carbon paper does not have nickel oxide on the surface of the foam [27], whose redox peak could interfere with the electrochemical characterization results. The tube was put into ultrasonic for 12 h in order to make the FNG adhere to the carbon paper. Finally, the electrode was heated in 200 ℃ for 12 h in order to remove the ethanol and immobilize the material on the carbon paper.
The morphology of the sample was characterized by fieldemission scanning electron microscopy (SEM, JEOL JSM 6700 F) and transmission electron microscopy (TEM, FEI Tecnai G2 F20 STwin D573) with acceleration voltage of 200 kV. The composition and structure of the material were examined by powder X-ray diffraction (XRD, Rigaku D/Max 2550 V/PC, Japan Cu-Kα radiation, λ = 0.15418 nm) and Raman microscope (Renishaw inVia Confocal Raman spectrometer using a solid-state laser at 532 nm as the excitation source). The electron binding energies of various kinds of carbon and nitrogen were determined by X-ray photoelectron spectroscopy (XPS) on an ESCALAB250 apparatus.
The electrochemical properties of as-prepared electrodes were characterized on an electrochemical workstation (CHI 760E) using a three-electrode system in a 2 mol/L KOH solution. The threeelectrode system consists of a platinum counter electrode (counter electrode), a saturated calomel electrode (reference electrode), and an as-prepared electrodes (working electrode). Electrochemical performances of the supercapacitor were tested by galvanostatic charge–discharge and cyclic voltammetry (CV). The potential range for CV measurements and galvanostatic charge–discharge tests have been performed in a potential range between -0.8 V to 0.6 V.
The structures of the sample 1-0 (no melamine in the starting material), sample 1-5 (half of maximum content of melamine in the starting material) and sample 1–10 (maximum content of melamine in the starting material), were examined by X-ray powder diffraction (XRD) and the patterns were shown in Fig. 1a. There was a sharp (002) peak at 26.3° in the XRD spectra of sample 1-0, consistent with previously reported graphite-like carbon feature [28, 29]. The pattern of sample 1-5 showed the peak at 26.7°, which indicated that nitrogen may have been doped into the graphitic structure.

|
Download:
|
| Fig. 1. (a) XRD patterns of sample 1-0 and sample 1-5; (b) HRTEM images of FNG. | |
The HRTEM image of the sample 1-5 was shown in Fig. 1b. From the figure, the interlayer distance was 0.35 nm, consistent with our previously reported distance of 0.35 ± 0.01 nm [30, 31]. From this image, we can observe the few-layer graphene in 3 layers (1.03 nm), 4 layers (1.39 nm) and 10 layers (3.47 nm). Defects can also be observed in the image which indicated that the nitrogen has doped into graphene.
The morphology and microstructure of the sample 1–7.5 which is representative among all samples were characterized by SEM and TEM, and the images were shown in Figs. 2 a and b. The results revealed the sample had the nanosheets-like structure. The TEM images of sample 1–7.5 in Figs. 2c and d also confirmed the fewlayer structure [25]. When melamine was heated over 525 ℃, retrogressive reaction happened, and melamine could react into C3N4. With the temperature increasing to 800 ℃, the C3N4 polymer could completely decompose into nitrogen-containing species (C2N2+, C3N2+, C3N3+) [32]. Most of the nitrogen-containing species left out into the nitrogen sphere. There would be still some of the N atom doped into the expanded graphite. There are some wrinkles appeared on the plane, because of the doped nitrogen atom could make the graphene molecule no longer uniform [33].

|
Download:
|
| Fig. 2. Low magnification (a) and high magnification (b) SEM images of FNG. (c, d) TEM images of FNG. | |
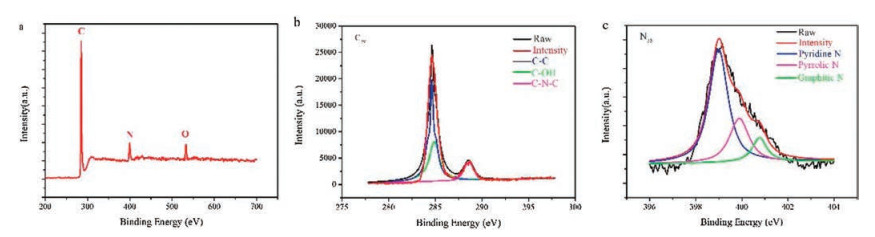
X-ray photoelectron spectroscopy (XPS) was used to analyze the valences and coordination of ions. Fig. 3a showed the XPS survey spectrum of the sample 1–10 with the highest nitrogen content of 6.13%. The high-resolution C 1s spectrum of the sample 1–10 was shown in Fig. 3b. After Gaussian fitted, three distinct peaks were obtained. The peak at 284.6 eV [34] was attributed to the C—C coordination. The peak at 284.9 eV [29] was attributed to C—OH bond which corresponds to the oxygen-containing groups in the material. The peak at 288.6 eV [35] was attributed to the C—N bond which proved the successful doping of nitrogen in the material. The high-resolution N 1s spectrum and the fitted results of the sample 1–10 were presented in Fig. 3c. After fitting the spectrum to Gaussian model, 3 peaks were identified and attributed to the graphitic N (401.1 eV), the pyrrolic N (400.5 eV) and the pyridine N (398.8 eV) respectively, which are also reflected by the C—N—C peak in the C 1s spectrum of the material. The redox reaction was mainly happened on the pyridine N which were doped into the material whose content was dominant among the nitrogen status. Table 1 listed the elemental composition analysis results of the samples, which were obtained from XPS characterization. The results showed that the carbon was the dominating element in all the samples. When more melamine was added into the expanded graphite, the final products contained more nitrogen, consistent with the fact that the melamine was the major contributor the nitrogen. On the other hand, the sample 1– 10 and sample 1–7.5 had nearly the same nitrogen content, indicating the nitrogen doping was saturated. In the meanwhile, with the nitrogen content increasing, the oxygen content decreased, which was due to the melamine reduced the oxygen functional groups from the material [30].

|
Download:
|
| Fig. 3. (a) XPS survey spectrum of sample 1-3; (b) High-resolution C 1s spectrum and (c) N 1s spectrum. | |
|
|
Table 1 Elemental analysis of samples obtained from XPS survey spectra. |

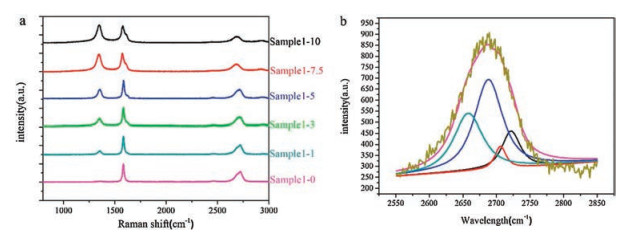
Raman spectroscopy was then applied to further characterize the crystalline quality of as-prepared samples. As shown in Fig. 4a, D band (1350 cm-1), the G band (1585 cm-1) and the 2D band (2700 cm-1) [31] of all samples were observed. The D band represented the disorderness in graphite or the edge of the graphite [36]. The G band was associated with the normal first order Raman scattering process in grapheme [31]. The 2D band originated from the double resonance (DR) Raman process, and was a robust way to quantify the number of layers in a graphene sample [13]. First of all, both nitrogen doping and the exfoliating process can significantly enhance the D band [17, 37], which was due to the doping of nitrogen atom that induced the defects inside the graphene network, and the ball-milling process exfoliated the bulk graphite, and in the meantime, produce the edge defects in the graphene sheets. In Fig. 4a, it was observed that with the increase of nitrogen content, the D band had a higher intensity as expected. Furthermore, when the nitrogen atom doping increased, the G band peak gradually split into two peaks which was also consistent with what was previously reported by Lin et al. about the N-doped graphene derived from ammonia plasma treatment of pure grapheme [17]. This phenomenon could be due to the graphitic N were doped to the lattice of graphene which caused G band split. Besides, the G band peak shifted to lower frequency when the nitrogen content became higher. In sample 1:10, the peak even shifted to 1576 cm-1 [38]. The intensity ratio ID/IG between the G and the D band was used to quantify the density of defects in monolayers and few-layer grapheme [39]. In Verónica León's research, the ID/IG of bilayer graphene was reported to be about 0.47 [24]. In our work, however, with the nitrogen atom doping into the bilayer graphene (sample 1–10), the ratio ID/IG was calculated to be 1.17 which was much higher than that in the pure bilayer graphene and indicated a low crystallinity of the obtained material. Furthermore, the shape of 2D band peak changed gradually due to the exfoliating process and nitrogen doping. The 2D band peak of graphite was asymmetric. With the nitrogen doping and the number of layer decreasing, the shape of the 2D band peak gradually became symmetric. In Fig. 4b, we presented the Gaussian fitting 2D Raman band of sample 1–10. There were 4 peaks after the fitting at 2658 cm-1, 2688 cm-1, 2706 cm-1 and 2721 cm-1 respectively, which were consistent with the reported results from L.M. Malard about Raman spectra for bilayer grapheme [40]. But the relative intensity of the four peaks were much different from previous work. The peak at 2658 cm-1 in our research turns out to have a lower intensity but the peak at 2706 cm-1 turned out to be higher which could be the result of nitrogen doping. This result also proved that the melamine facilitated exfoliation of the graphite.

|
Download:
|
| Fig. 4. (a) Raman spectra of FNG in different ratio of melamine and graphite; (b) The measured 2D Raman band of FNG in 1:10. | |
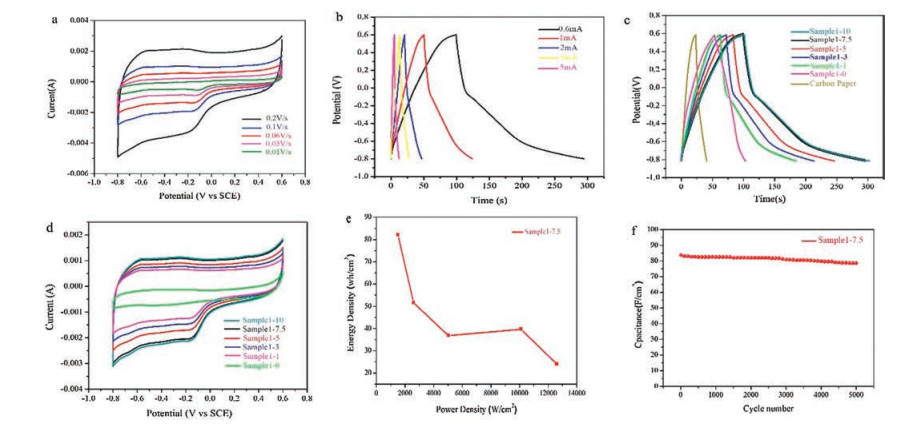
To measure the electrochemical performance of the FNG materials, the three-electrode system was setup, including a platinum counter electrode (counter electrode), a saturated calomel electrode (reference electrode), and an as-prepared electrodes (working electrode). The three-electrode configuration was soaked with 2 mol/L NaOH for 24 h in order to let the ion sufficiently contact to the as prepared FNG electrode. The CV curves are shown in Fig. 5a and the FNG electrode of sample 1–7.5 was measured from -0.8 V to 0.6 V and the curve exhibit a rectangular-like shape in the scan rate of 0.2 V/s, 0.1 V/s, 0.06 V/s, 0.03 V/s, 0.01 V/s respectively. With the scan rate changing, the rectangular-like shape had no obvious change. It indicated that the electrode had a good reversibility. The redox potential peaks appeared on the CV curves was due to the reaction on pyridine N. The galvanostatic charge-discharge curves were measured with currents of 0.6 mA, 1.0 mA, 2.0 mA, 3.0 mA, 5.0 mA, respectively (Fig. 5b). The specific capacitance of FNG electrode was calculated by the equation below [32]:

|
Download:
|
| Fig. 5. (a) CV curves with different scan rates. (b) Galvanostatic charge-discharge at different discharge current densities. (c) Galvanostatic charge-discharge curves (0.6 mA/cm2) in different ration (d). The CV curves of as-prepared samples in 0.1 V/s. (e) Ragone plot of FNG supercapacitor. (f) The cycling performance measured at a scan rate of 0.6 mA/cm2. | |

|
where I was the current density (A), t was the discharge time (s), S was the specific area in contact with the electrolyte (cm2), V was the potential range (V). According to this equation, the specific capacitance of FNG electrode of sample 1–7.5 was calculated to be about 83.8 mF/cm2 at a current density of 0.6 mA/cm2. Noticeably, if the FNG electrode was charged with a low current density, the CV curves would become rectangular in shape, as the redox reaction was not easy to take place at low current densities.
The galvanostatic charge-discharge curves of FNG electrodes (0.6 mA/cm2) made from sample 1-0, sample 1-1, sample 1-3, sample 1-5, sample 1–7.5 and sample 1–10 were compared in Fig. 5c. The current collector was also set in the graph as baseline. With more nitrogen doped into the material, the electrochemical performance improved significantly. What also should be noticed was that the FNG electrode of sample 1–7.5 was 2-folds higher than that of the sample 1-0 electrode. Due to the oxygen functional group in the expanded graphite electrode, the rectangular-like shape was also presented in the curve of sample 1-0 electrode. Around 0.8 V, a redox reaction happened, but the curve shape was very different from that of the FNG electrode. In the galvanostatic charge-discharge curves of FNG electrodes, above the electric potential of -0.2 V, the specific capacitance enhanced due to the exfoliation effect to the material. With the number of layers decreased, the specific surface area increased. Therefore, the material could adsorb more electrons. Generally, the discharge time is equal to the charge time owning to the same current density. However, the discharge time is larger than charge time in Fig. 5c because the redox reaction happens during the discharge process. Two redox potential peaks appeared at -0.2 V and -0.6 V which were not presented in the sample 1-0 electrode. The -0.2 V corresponded to the redox reaction of pyridine and the -0.6 V to the redox reaction of pyrrolic, which were consistent with the previous XPS results as well as CV curves. Because of the pyridine N had lower binding energy than pyrrolic N, the redox reaction took place easier. Another fact that was in accordance with the XPS results was that the pyridine N was dominant among the N species in the FNG material. Therefore, the redox reaction of pyridine N showed strong effect in the galvanostatic charge-discharge curves of FNG electrode. Moreover, the redox potential peak of oxygen functional group was weakened due to the fact that the oxygen functional group had been reduced by the melamine. The electrode of sample 1–10 and sample 1–7.5 shows nearly the same specific capacitance, which is also accordance with the XPS test that they have the same nitrogen content. The CV curves of as-prepared samples in different weight ratio were scanned in 0.1 V/s, which is accordance with the galvanostatic charge-discharge curves in Fig. 5d. The excellent electrochemical performance suggested that the FNG electrode had faster electron transfer rate compared with that of the expanded graphite electrode.
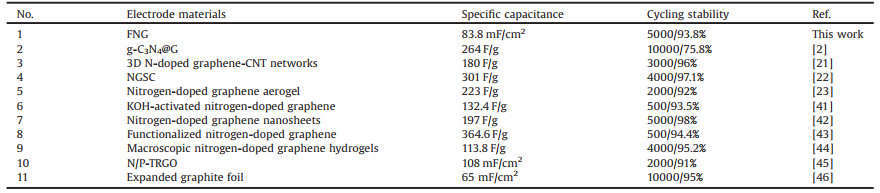
Fig. 5d showed the Ragone plot of the FNG (sample 1–7.5) supercapacitor. At the current density of 0.6 mA/cm2, the energy density is 82.14 Wh/cm2 and the power density was 1511.78 W/cm2 which indicated that the FNG-based supercapacitor could operate in both high power and high energy densities. The cycling stability of the supercapacitor electrodes is also an important index to evaluate the performance of a supercapacitor [33]. As shown in Fig. 5e, after 5000 charge-discharge cycle, the FNG electrode of sample 1–7.5, which has the highest nitrogen content, retained 93.8% of the initial specific capacitance, demonstrating of the excellent cycling stability of FNG supercapacitor. Relevant literatures in Table 2 [2, 21, 23, 41-46] show that the FNG electrode has an excellent performance in supercapacitor. Compared with other work, the FNG electrode shows both high specific capacitance and excellent cycling stability.
|
|
Table 2 Electrochemical performance compared with relevant literature. |
To summarize, FNG was prepared by a novel method from melamine and expandable graphite. The products were thoroughly characterized and exhibited extraordinary electrochemical properties as electrode materials for supercapacitors. The results showed that with the intercalation impact of ball-milling method and melamine, the expanded graphite was exfoliated to fewerlayers. The melamine brought in the nitrogen atom to be doped into the material through the heating process. The doping of the nitrogen largely enhanced the electrochemical performance of the material. The electrode of sample 1–7.5 in three-electrode system shows the highest specific capacitance which is as high as of 83.8 mF/cm2 was achieved, almost 2 folds higher than that of the expanded graphite electrodes, making the FNG a desirable material for supercapacitor applications.
AcknowledgmentThis work was supported by the National Natural Science Foundation of China (Nos. 21271082 and 21371068).
| [1] |
B. Pozo, J. Garate, S. Ferreiro, I. Fernandez, E. Fernandez de Gorostiza, Electronics 7 (2018) 44-61. DOI:10.3390/electronics7040044 |
| [2] |
Q. Chen, Y. Zhao, X. Huang, N. Chen, L. Qu, J. Mater. Chem. A 3 (2015) 6761-6766. DOI:10.1039/C5TA00734H |
| [3] |
T.M. Masikhwa, M.J. Madito, D.Y. Momodu, et al., RSC Adv. 6 (2016) 46723-46732. DOI:10.1039/C6RA07419G |
| [4] |
Y. Chen, X. Zhang, P. Yu, Y. Ma, J. Power Sources 195 (2010) 3031-3035. DOI:10.1016/j.jpowsour.2009.11.057 |
| [5] |
X. Cao, Y. Shi, W. Shi, et al., Small 7 (2011) 3163-3168. DOI:10.1002/smll.201100990 |
| [6] |
Y.C. Lin, C.Y. Lin, P.W. Chiu, Appl. Phys. Lett. 96 (2010) 133110-133112. DOI:10.1063/1.3368697 |
| [7] |
Y. Tan, C. Xu, G. Chen, et al., ACS. Appl. Mater. Inter. 5 (2013) 2241-2248. DOI:10.1021/am400001g |
| [8] |
I.W.P. Chen, Y.S. Chen, N.J. Kao, et al., Carbon 90 (2015) 16-24. DOI:10.1016/j.carbon.2015.03.067 |
| [9] |
X. Wang, H. Yang, L. Song, et al., Compos. Sci. Technol. 72 (2011) 1-6. DOI:10.1016/j.compscitech.2011.05.007 |
| [10] |
T. Peng, Z. Kou, H. Wu, S. Mu, Sci. Rep. 4 (2014) 5494-5499. |
| [11] |
M. Losurdo, M.M. Giangregorio, P. Capezzuto, G. Bruno, PCCP 13 (2011) 20836-20843. DOI:10.1039/c1cp22347j |
| [12] |
Y. Zhu, S. Murali, W. Cai, et al., Adv. Mater. 22 (2010) 3906-3924. DOI:10.1002/adma.201001068 |
| [13] |
R. Zhang, B. Zhang, S. Sun, RSC Adv. 5 (2015) 44783-44791. DOI:10.1039/C5RA04480D |
| [14] |
C. Chao, M. Gao, S. Chen, J. Therm. Anal. Calorim. 131 (2017) 71-79. |
| [15] |
C. Guo, C. Wang, Compos. Sci. Technol. 67 (2007) 1747-1750. DOI:10.1016/j.compscitech.2006.11.011 |
| [16] |
F. Barzegar, A. Bello, D. Momodu, et al., J. Power Sources 309 (2016) 245-253. DOI:10.1016/j.jpowsour.2016.01.097 |
| [17] |
D. Deng, X. Pan, L. Yu, et al., Chem. Mater. 23 (2011) 1188-1193. DOI:10.1021/cm102666r |
| [18] |
Y. Lu, Y. Huang, M. Zhang, Y. Chen, J. Nanosci. Nanotechno. 14 (2014) 1134-1144. DOI:10.1166/jnn.2014.9102 |
| [19] |
D. Long, W. Li, L. Ling, et al., Langmuir 26 (2010) 16096-16102. DOI:10.1021/la102425a |
| [20] |
H. Peng, G. Ma, K. Sun, J. Mu, Z. Lei, J. Mater. Chem. A 2 (2014) 17297-17301. DOI:10.1039/C4TA03929G |
| [21] |
B. You, L. Wang, L. Yao, J. Yang, Chem. Commun. 49 (2013) 5016-5018. DOI:10.1039/c3cc41949e |
| [22] |
Y. Lu, F. Zhang, T. Zhang, et al., Carbon 63 (2013) 508-516. DOI:10.1016/j.carbon.2013.07.026 |
| [23] |
Z.Y. Sui, Y.N. Meng, P.W. Xiao, et al., ACS Appl. Mater. Int. 7 (2015) 1431-1438. DOI:10.1021/am5042065 |
| [24] |
V. León, A.M. Rodriguez, P. Prieto, M. Prato, E. Vázquez, ACS Nano 8 (2014) 563-571. DOI:10.1021/nn405148t |
| [25] |
Y. Wang, H. Xuan, G. Lin, et al., J. Power Sources 319 (2016) 262-270. DOI:10.1016/j.jpowsour.2016.04.069 |
| [26] |
Q. Sun, X. Wang, B. Li, et al., Chem. Res. Chin. U. 34 (2018) 1-6. DOI:10.1007/s40242-017-7334-0 |
| [27] |
L. Wu, W. Li, P. Li, et al., Small 10 (2014) 1421-1429. DOI:10.1002/smll.201302730 |
| [28] |
G. Carotenuto, D. Altamura, C. Giannini, D. Siliqi, Acta Crystallogr. 67 (2011) C558-C558. |
| [29] |
Y.H. Guo, D.X. Zhuo, L.X. Wu, et al., Adv. Mater. Res. 937 (2014) 260-266. DOI:10.4028/www.scientific.net/AMR.937.260 |
| [30] |
W. Mizutani, J. Inukai, M. Ono, J. Appl. Phys. 29 (1990) L815-L817. DOI:10.1143/JJAP.29.L815 |
| [31] |
F. Pendolino, N. Armata, T. Masullo, A. Cuttitta, Mater. Chem. Phys. 164 (2015) 71-77. DOI:10.1016/j.matchemphys.2015.08.024 |
| [32] |
J.M. Carlsson, Nat. Mater. 8 (2009) 76-80. DOI:10.1038/nmat2317 |
| [33] |
W.J. Ong, L.L. Tan, Y.H. Ng, S.T. Yong, S.P. Chai, Chem. Rev. 116 (2016) 7159-7329. DOI:10.1021/acs.chemrev.6b00075 |
| [34] |
B. Dong, C. Liu, L. Zhang, Y. Wu, RSC Adv. 5 (2015) 17140-17148. DOI:10.1039/C4RA17051B |
| [35] |
A. Ganguly, S. Sharma, P. Papakonstantinou, J. Hamilton, J. Phys. Chem. C 115 (2012) 17009-17019. |
| [36] |
A.K. Sood, R. Gupta, S.A. Asher, J. Appl. Phys. 90 (2001) 4494-4497. DOI:10.1063/1.1408590 |
| [37] |
L.M. Malard, M.A. Pimenta, G. Dresselhaus, M.S. Dresselhaus, Phys. Rep. 473 (2009) 51-87. DOI:10.1016/j.physrep.2009.02.003 |
| [38] |
M.S. Dresselhaus, G. Dresselhaus, R. Saito, A. Jorio, Phy. Rep. 409 (2005) 47-99. DOI:10.1016/j.physrep.2004.10.006 |
| [39] |
A. Jorio, M.M. Lucchese, F. Stavale, et al., J. Phys. Condens. Matter 22 (2010) 334204-334208. DOI:10.1088/0953-8984/22/33/334204 |
| [40] |
L.M. Malard, M.A. Pimenta, G. Dresselhaus, M.S. Dresselhaus, Phy. Rep. 473 (2009) 51-87. DOI:10.1016/j.physrep.2009.02.003 |
| [41] |
B. Zheng, T.W. Chen, F.N. Xiao, W.J. Bao, X.H. Xia, J. Solid. State. Electr. 17 (2013) 1809-1814. DOI:10.1007/s10008-013-2101-8 |
| [42] |
K. Wang, L. Li, T. Zhang, Z. Liu, Energy 70 (2014) 612-617. DOI:10.1016/j.energy.2014.04.034 |
| [43] |
C. Chen, W. Fan, T. Ma, X. Fu, Ionics 20 (2014) 1489-1494. DOI:10.1007/s11581-014-1231-z |
| [44] |
P. Chen, J. Yang, S. Li, et al., Nano Energy 2 (2013) 249-256. DOI:10.1016/j.nanoen.2012.09.003 |
| [45] |
C. Wang, Y. Zhou, L. Sun, et al., J. Phys. Chem. C 117 (2013) 14912-14919. DOI:10.1021/jp4015959 |
| [46] |
H. Li, Y. Yu, L. Liu, L. Liu, Y. Wu, Electrochim. Acta 228 (2017) 553-561. DOI:10.1016/j.electacta.2017.01.063 |