 2020, Vol. 31


b College of Chemistry, State Key Laboratory of Elemento-Organic Chemistry, Nankai University, Tianjin 300071, China
The extensive application of organic dyes in various industrial processes indeed has enriched our life, whereas unfortunately the consequent environmental issues, particularly groundwater, also have burdened our homeland, the earth [1]. It is well known that organic dyes have dramatically adverse effects on environmental sustainability and public health owing to their toxicity, durability, and bioaccumulation [2]. Nevertheless, more than 400, 000 tons of dyes production and approximately 10%-20% of them annual worldwide was directly discarded into water system, which will lead to water eutrophication and ominously reduce biodiversity. There is no doubt that water pollution caused by these compounds has recently become an imperative environmental problem of worldwide concern, especially in the coming era of resource scarcity. Therefore, the detection of organic dyes content in industrial wastewater before discharge to environment plays a great role in environment protection particularly water resource protection and even human health [3, 4].
At present, various methods have been proposed to detect single pollutant, including physical, biological and chemical etc. [1, 5-9]. Among them, surface enhanced Raman scattering (SERS) is regarded as a promising technology because of its low cost, high efficiency, easy operation and no secondary pollution [10-12]. Until now, various pollutants have been effectively detected by the means of SERS, such as crystal violet, methylene blue, malachite green and so on [13]. However, the weak affinity of MO, a widely used dye molecule, to noble metals with SERS activity poses a great challenge to the SERS detection. Therefore, it is imperative to design a new method for the effective detection of this kind of dyes which possess low capacity of metal affinity [14].
Recently, some contaminants detection methods with SERS have been realized by functionalizing the precious metal surface so as to make contaminants close to it [15-20]. They used modified precious metals as substrates to promote the SERS of contaminants and made use of the hydrophobic interaction between functional molecules and contaminants to include them into the cavity of the former within the electromagnetic enhancement zone. For example, Jones et al. [15] and Costa et al. [19] obtained the SERS spectra of polycyclic aromatic hydrocarbons (PAHs) by assembling alkyl thiol monolayer on silver and gold films over nanosphere substrates. Guerrini et al. [16-18] developed a new SERS substrate prepared by self-assembly of dithiocarbamate calix[4]arene derivative and viologen dications on silver nanoparticles. In 1999, Wieland et al. [21] firstly proposed that the detection limit of MO can be decreased to about 10-5 mol/L under the help of cyclodextrin (CD) in the SERS measurement. However, the SERS substrate employed for the measurement is not uniform and thus leads to low reproducibility of the SERS spectra. Moreover, the sensitivity was not high enough for real environmental monitoring.
β-Cyclodextrin (β-CD) is a macrocyclic receptor possessing hydrophilic exterior and hydrophobic interior cavity. As a highly effective adsorbent, it has received extensive attention in environmental treatment [22, 23]. The unique selective adsorption of pollutants by β-CD is mainly due to the formation of host-guest inclusion complexes between target molecules and β-CD with appropriate size and geometrically well-defined cavities [24-26]. In addition, the abundant -OH groups outside β-CD not only can capture contaminants, but also can be easily modified with specific functional groups to endow β-CD with controlled molecular binding abilities [27].
In this work, we developed a novel SERS substrate based on mono-6-deoxy-6-thio-β-cyclodextrin (β-CD-SH) modified Ag NP monolayer to detect more trace MO with high repeatability by the host-guest molecular recognition. This kind of SERS substrate has obvious advantages compared with others: First, the silver film is more uniform than other SERS-active substrates. Second, the substrate can specifically bind MO dye molecules. For this reason, SERS can be a fast and real-time method to selectively detect these toxic compounds through supramolecular recognition.
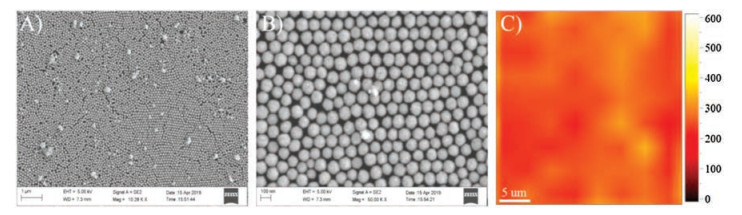
In order to make the SERS detection reproducible and comparable, the Ag NPs with a diameter of about 100 nm were well assembled into close-packed monolayer at the toluene-water interface through the interfacial tension [28-30]. The SEM images of the prepared Ag NP monolayer are shown in Figs. 1A and B. It can be clearly seen from the SEM images that the Ag NP monolayer is well-dispersed without obvious aggregation. The average distance between two adjacent Ag NPs in the prepared NP monolayer is ~2 nm, which is very beneficial for the generation of enhanced electromagnetic fields under intense light-plasmonic coupling and resonant illumination. The average enhancement factor (EF) on the entire Ag surface is ~1.3 × 10⁴, when the maximum EF value in the hot spot is estimated to be ~8.9 × 10⁶ (Fig. S1 in Supporting information). The characteristic peak of β-CD at 998 cm-1 was employed to evaluate the uniformity of the prepared Ag NP monolayer film under laser irradiation at 532 nm [31]. High SERS reproducibility was obtained as shown in Fig. 1C.

|
Download:
|
| Fig. 1. (A, B) SEM images of Ag NP monolayers in different magnification. Scale bars in A and B are 1 μm and 100 nm, respectively. (C) The SERS intensity distribution of the SERS peak at 998 cm-1 of the β-CD on 100 nm Ag NP monolayers. | |
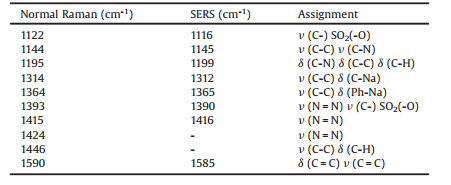
The absorption of the azo dye MO was tested utilizing the inclusion capability of β-CD-SH to MO so that MO can be enriched near the surface of Ag NPs with SERS activity. In this work, the adsorption of MO on the Ag substrate was measurable at the concentration of about 0.1 mmol/L, but it became disabled when the solution of MO was just diluted 10 times. Therefore, β-CD-SH modified Ag NP monolayer is prepared to solve this problem. As expected, a strong SERS spectrum of MO was obtained even for substrates immersed in 0.5 μmol/L solutions, in which however no adsorption was detectable with bare metal substrates. The SERS spectrum of MO on the β-CD@Ag NP monolayer shows five characteristic peaks at 1116, 1145, 1365, 1390 and 1416 cm-1 and the assignments are listed in Table 1 [32, 33]. In order to prove that the SERS enhancement is caused by β-CD@Ag NP monolayer rather than Ag NPs and itself, control experiments were conducted. As shown in Fig. 2A, we observed many characteristic peaks for the MO solution (10-5 mol/L) with β-CD@Ag NP monolayer corresponding to that of MO solid in the Raman spectrum, whereas there is no obvious indication in the MO solution or with Ag NPs only at the same MO concentration. Additionally, it can be seen from Fig. S2 (Supporting information) that a strong C-S stretching band appears at 686 cm-1 and a strong enhancement of a peak centered at 998 cm-1. The results strongly indicate that β-CD-SH is covalently bound to the silver surface via S-Ag bonds. Therefore, it can be concluded that Raman scattering signals we measured did come from MO on the functionalized substrate.
|
|
Table 1 Main SERS peaks assignment of MO molecules. |

|
Download:
|
| Fig. 2. (A) Raman spectrum of (a) 10 μmol/L MO and (d) MO solid, SERS spectrum of 10 μmol/L MO on the β-CD-SH functionalized (c) or not (b) Ag NP monolayer film. (B) SERS spectrum of (a-e) MO with the concentrations of 0, 5 × 10⁻⁷, 5 × 10⁻⁶, 10-6 and 10-5 mol/L, respectively on the β-CD-SH functionalized Ag NP monolayer film, (f) solid MO. (C) SERS spectrum of (a) 10 μmol/L 1-AT on the Ag NP monolayer film, (b, c) 10 μmol/L MO on the β-CD-SH functionalized Ag NP monolayer film with the presence of 1-AT (c) or not (b), (d) Raman spectrum of 1-AT solid. | |
Fig. 2B shows the SERS spectra of different MO concentrations on the complex SERS substrate (β-CD-SH functionalized Ag NPs). It can be seen that the main peaks of MO at about 1393 and 1415 cm-1 show striking concentration dependency (from 10-5 mol/L to 5 × 10⁻⁷ mol/L) and there still are distinct SERS signals of MO even when the MO concentration is diluted to 10-7 mol/L. It indicates that we can adsorb and detect MO in wastewater through the β-CD@Ag NP monolayer substrates, even though the color is invisible to the naked eyes at a very low concentration. It can be an important means of determining MO molecules.
In order to confirm that the SERS signals of MO we obtained are derived from the MO incorporated into the hydrophobic cavity of β-CD, 1-adamantanol (1-AT) which has stronger binding affinity to β-CD was added. Compared with the SERS spectra added 1-AT or not (Fig. 2C), it is obvious that the characteristic peaks of MO disappeared and many characteristic peaks (such as 727 and 780 cm-1) for 1-AT alternatively appeared corresponding to that of 1-AT solid in the Raman spectrum. Combined with the above result that there is no characteristic peak only with Ag NPs at the same concentration (Fig. 2A), it is reasonable to believe that the interaction between MO and β-CD plays a critical role here, which makes it possible to detect trace MO by ensuring MO within the electromagnetic enhancement zone. Moreover, this conclusion will be further corroborated in the following part.
As is generally accepted, the inclusion of MO into β-CD cavity will give rise to a prominent fluorescence at about 335 nm due to the fluorescence sensitization effect. Accordingly, the fluorescence spectra of MO in the presence of β-CD at different concentrations were measured to consolidate the above result, as shown in Fig. 3A. Although there was a weak fluorescence prior to the addition of β-CD, which may be attributed to the background and the aggregation-induced fluorescence enhancement, it still can be easily found that the fluorescence of MO increases significantly by the addition of β-CD (until 48 mL of 10-2 mol/L β-CD) within a short period (< 40 min) and reaches a plateau at last. Relatively, after the introduction of the competitive binder 1-AT whose fluorescence appeared at around 275 nm, the fluorescence of MO gradually decreased upon increasing the addition content of 1-AT while the fluorescence of 1-AT was correspondingly enhanced (Fig. 3B). Namely, when 1-AT was competitively included into the β-CD cavity, the release of MO from the β-CD cavity resulted in a significant decrease in fluorescence due to the elimination of the fluorescence sensitization effect between MO and β-CD. It should be a solid evidence for the inclusion of MO into β-CD.

|
Download:
|
| Fig. 3. (A) Fluorescence spectra of MO@β-CD solutions after adding varying amounts of β-CD. (B) Fluorescence spectra of MO@β-CD solutions when different 1-AT contents were introduced. | |
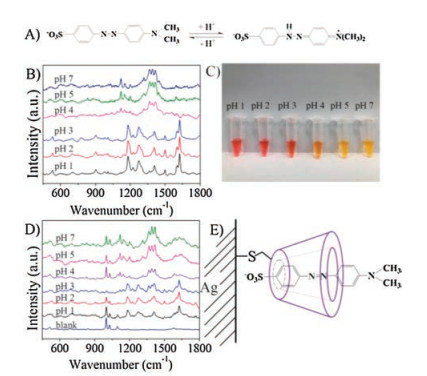
It is known that the structure and color of MO are different when pH changes (Fig. 4A) [34]. Fortunately, SERS spectrum in the present work notwithstanding holds favorable applicability for this. As it can be seen from Fig. 4B: at below pH 3, the appearance of a C = C stretching band at 1624 cm-1 and disappearance of a N = N stretching band at 1391 and 1415 cm-1 [35] indicate that the dominant azo form existing under neutral conditions is converted into the azonium species at pH below 3. The striking color evolution (as shown in Fig. 4C) can also provide solid evidence for the above result. The SERS spectra obtained by the functionalized SERS substrate (Fig. 4D) were also changed significantly with the pH value ascending from 1 to 7 as compared to the free MO solution did (Fig. 4B). Particularly, the faint peaks at 1624, 1391, and 1415 cm-1 indicating the presence of both two forms of MO molecules at pH 3 in Fig. 4B become more distinct here. Therefore, we can confirm the different variants of MO molecules in different pH solutions at very low concentrations under the help of β-CD@Ag NP monolayer substrates (Fig. 4E). It is worthy to mention that the MO concentrations used in Figs. 4B and D are 10-4 and 10-5 mol/L, respectively, which provided further evidence for the sensitivity of our method. In order to verify the detection performance of this method in real water samples, we measured three wastewater samples using the SERS detection method. The measured values match well with the real concentrations determined by GC-MS (Fig. S4 in Supporting information).

|
Download:
|
| Fig. 4. (A) Changes in MO molecules between acid-base conditions. (B) Raman spectra of MO at different pH. (C) The picture of MO solution at different pH. (D) SERS spectra of MO included in the cavity of β-CD@Ag at different pH and that of β-CD-SH functionalized Ag NPs. (E) Adsorption of MO molecules on the β-CDmodified Ag surface. | |
In summary, the as-prepared β-CD@Ag NP monolayer composites showed excellent adsorption capability toward MO due to its unique structural characteristics. More importantly, the substrate makes it possible to sensitively detect trace MO in the wastewater based on the SERS activity. The results here showed that the substrate performed outstanding detection capability of MO and even of its different structures under different pH conditions. This work may provide new insight into the design of a highly efficient and easily recyclable adsorbent to detect and even remove dye contaminants from complex wastewater.
AcknowledgmentsThe authors acknowledge the financial support from the National Natural Science Foundation of China (Nos. 51601098, 21775074 and 21861132016), the Natural Science Foundation of Tianjin (No. 17JCQNJC05400), and the National Key Research and Development Project of China (Nos. 2017YFA0206702 and 2016YFB0901502).
Appendix A. Supplementary dataSupplementary material related to this article can be found, in the online version, at doi:https://doi.org/10.1016/j.cclet.2019.07.037.
| [1] |
J.H. Deng, X.R. Zhang, G.M. Zeng, et al., Chem. Eng. J. 226 (2013) 189-200. DOI:10.1016/j.cej.2013.04.045 |
| [2] |
J. Li, Q.H. Fan, Y.J. Wu, et al., J. Mater. Chem. A 4 (2016) 1737-1746. DOI:10.1039/C5TA09132B |
| [3] |
H.J. Hou, R.H. Zhou, P. Wu, L. Wu, Chem. Eng. J. 211- 212 (2012) 336-342. DOI:10.1016/j.cej.2012.09.100 |
| [4] |
R. Rakhshaee, M. Giahi, A. Pourahmad, Chin. Chem. Lett. 22 (2011) 501-504. DOI:10.1016/j.cclet.2010.10.041 |
| [5] |
F.M. Amaral, M.T. Kato, L. Florêncio, S. Gavazza, Bioresour. Technol. 163 (2014) 364-369. DOI:10.1016/j.biortech.2014.04.026 |
| [6] |
N. Meunier, P. Drogui, C. Montané, et al., J. Hazard Mater. 137 (2006) 581-590. DOI:10.1016/j.jhazmat.2006.02.050 |
| [7] |
S.W. Liu, J.G. Yu, M. Jaroniec, J. Am. Chem. Soc. 132 (2010) 11914-11916. DOI:10.1021/ja105283s |
| [8] |
S.K. Li, J.M. Xu, S. Wang, et al., Chin. Chem. Lett. 30 (2019) 1581-1592. DOI:10.1016/j.cclet.2019.05.049 |
| [9] |
H. Zhang, L. Su, J. Iqbal, Y.P. Du, Chin. Chem. Lett. 29 (2018) 981-984. DOI:10.1016/j.cclet.2017.10.017 |
| [10] |
V.K. Gupta, A. Nayak, Chem. Eng. J. 180 (2012) 81-90. DOI:10.1016/j.cej.2011.11.006 |
| [11] |
Y.L. Li, Y.F. Hu, F.X. Shi, et al., Angew. Chem. Int. Ed. 58 (2019) 9049-9053. DOI:10.1002/anie.201902825 |
| [12] |
Y. Liu, M. Chen, Y.M. Hao, Chem. Eng. J. 218 (2013) 46-54. DOI:10.1016/j.cej.2012.12.027 |
| [13] |
G.H. Ding, S. Xie, Y. Liu, L. Wang, F.G. Xu, Appl. Surf. Sci. 345 (2015) 310-318. DOI:10.1016/j.apsusc.2015.03.175 |
| [14] |
M.E. Skold, G.D. Thyne, J.W. Drexler, D.L. Macalady, J.E. McCray, Environ. Sci. Technol. 42 (2008) 8930-8934. DOI:10.1021/es801835x |
| [15] |
C.L. Jones, K.C. Bantz, C.L. Haynes, Anal. Bioanal. Chem. 394 (2009) 303-311. DOI:10.1007/s00216-009-2701-4 |
| [16] |
L. Guerrini, J.V. Garcia-Ramos, C. Domingo, S. Sanchez-Cortes, Phys. Chem. Chem. Phys. 11 (2009) 1787-1793. DOI:10.1039/b812811a |
| [17] |
L. Guerrini, J.V. Garcia-Ramos, C. Domingo, S. Sanchez-Cortes, Anal. Chem. 81 (2009) 953-960. DOI:10.1021/ac801709e |
| [18] |
L. Guerrini, J.V. Garcia-Ramos, C. Domingo, S. Sanchez-Cortes, Anal. Chem. 81 (2009) 1418-1425. DOI:10.1021/ac8021746 |
| [19] |
J.C.S. Costa, A.C. Sant'Ana, P. Corio, M.L.A. Temperini, Talanta 70 (2006) 1011-1016. DOI:10.1016/j.talanta.2006.01.036 |
| [20] |
C.E. Taylor, M.H. Schoenfisch, J.E. Pemberton, Langmuir 16 (2000) 2902-2906. DOI:10.1021/la990061e |
| [21] |
W. Hill, V. Fallourd, D. Klockow, J. Phys. Chem. B 103 (1999) 4707-4713. DOI:10.1021/jp990574u |
| [22] |
H. Cao, J. He, L. Deng, X.Q. Gao, Appl. Surf. Sci. 255 (2009) 7974-7980. DOI:10.1016/j.apsusc.2009.04.199 |
| [23] |
G.M. Durán, A.M. Contento, A. Ríos, Talanta 131 (2015) 286-291. DOI:10.1016/j.talanta.2014.07.100 |
| [24] |
R. Sawicki, L. Mercier, Environ. Sci. Technol. 40 (2006) 1978-1983. DOI:10.1021/es051441r |
| [25] |
B.Y. Yu, J.W. Chung, S.Y. Kwak, Environ. Sci. Technol. 42 (2008) 7522-7527. DOI:10.1021/es800895x |
| [26] |
Y.M. Zhang, Q.Y. Xu, Y. Liu, Sci. China Chem. 62 (2019) 549-560. DOI:10.1007/s11426-018-9405-3 |
| [27] |
F.P. Zhao, E. Repo, D.L. Yin, et al., Environ. Sci. Technol. 49 (2015) 10570-10580. DOI:10.1021/acs.est.5b02227 |
| [28] |
J. Xu, W.M. Yang, S.J. Huang, et al., Nano Energy 49 (2018) 363-371. DOI:10.1016/j.nanoen.2018.04.048 |
| [29] |
L. Pause, M. Robert, J.M. Savéant, J. Am. Chem. Soc. 121 (1999) 7158-7159. DOI:10.1021/ja991365q |
| [30] |
B. Vanrenterghem, P. Jovanovič, M. Šala, et al., Electrochim. Acta 286 (2018) 123-130. DOI:10.1016/j.electacta.2018.08.037 |
| [31] |
P. Jiang, Y.Y. Dong, W. Xie, J. Phys. Chem. C 123 (2019) 16741-16746. DOI:10.1021/acs.jpcc.9b03238 |
| [32] |
A.P. Zhang, Y. Fang, Chem. Phys. 331 (2006) 55-60. DOI:10.1016/j.chemphys.2006.09.024 |
| [33] |
A.P. Zhang, Y. Fang, J. Colloid. Interf. Sci. 305 (2007) 270-274. DOI:10.1016/j.jcis.2006.09.068 |
| [34] |
Y. Maeda, H. Kitano, J. Phys. Chem. 99 (1995) 487-488. DOI:10.1021/j100002a004 |
| [35] |
D. Lin-Vien, B. Colthup, W.G. Fateley, J.G. Grasselli, The Handbook of Infrared and Raman Frequencies of Organic Molecules, Academic Press, Boston, 1991.
|