 2020, Vol. 31


b Shale Gas Institute of Southwest Oil & Gas Field Company, PetroChina, Chengdu 610051, China;
c C. Eugene Bennett Department of Chemistry, West Virginia University, Morgantown, West Virginia 26506-6045, United States
Nowadays with the development of economy, the energy issue has received extensive attention in the world. Petroleum has been known as an important energy source. The exploitation of shale gas greatly facilitates people's lives and satisfies the needs of social development [1, 2]. Kerogen [3-6] arises from shale is highly related to the production of natural gas. Although many studies have been carried out, its mechanical properties and chemical structures are not fully understood [7]. In this article, for the first time we reveal the friction behavior of kerogen with AFM and advanced analysis technology.
The internal structure of kerogen is a complex organic system. Previous experiments and models are proposed to study the chemical structure of kerogen. For example, Djurici-c et al. created Green River Shale (GRS) to characterize the chemical structure of kerogen [8]. By using of AFM to measure Young's modulus of kerogen rocks, Javadpour et al. [9] made significant progress in the application of AFM in petroleum engineering. Modern characterization techniques such as X-ray photoelectron spectrometer (XPS), Fourier transform infrared (FTIR) and nuclear magnetic resonance (NMR) have been used to unravel the characteristics of kerogen [10, 11]. The chemical structure of kerogen was studied by XPS [10] and NMR [11, 12], which was comprehensively studied by FTIR [13, 14] subsequently. Yang et al. [15] first used AFM-based infrared spectroscopy (AFM-IR [16, 17]) to measure the mechanical and chemical properties of solid organic matter in shale. Although great progress has been made, the friction behavior of kerogen remains unclear, which obstacle the full understanding of the kerogen at nanoscale.
In this paper, with the assistant of AFM, we test the friction of continental rock and marine rock in nanoscale. The schematic diagram of the experiment is shown in Fig. S1 (Supporting information). XPS and FTIR spectrum reveals the main chemical bonding of kerogen is C—C, C=C and C=O. The chemical structure of kerogen in marine and continent remain the same. Through the AFM test, we found that the friction of kerogen increases as the pressure increases but decreases with the rise of temperature. The friction decreases logarithmically as the sliding velocity rises. The findings could help scientists and research fully understand the kerogen in nanoscale.
Rock samples from the continent and marine were collected from the "extension" group and the "Longmaxi Formation". After cutting, argon ion polishing was performed for subsequent experiments. Rough polishing was first performed followed by precise polishing at 4 kV and 8° for 4 h. Then, the sample was vacuumed and cleaned with high-pressure air. The voltage was changed to 3 kV, and the angle was polished by 6° for 3 h. The temperature during the polishing process was between 40° and 50°, and the speed of the sample stage was 1.5 rpm. The sample went through a five-fold acid treatment with a mixture of HCl and HF in order to remove the carbonate and silicate. The kerogen powder as remained and pressed into a sheet at a pressure of 10 GPa for later measurement.
The prepared sample was subjected to SEM-EDS scanning using a scanning electron microscope (SEM, SU8010) shown in Fig. 1 to determine the element distribution on the surface. In order to obtain a clear and intuitive image, the voltage used is 5 kV and the current is 10 mA. The boundary between the inorganic and kerogen in the marine and continental samples was selected in the scanning to more intuitively depict the difference in elemental distribution between the two different materials.

|
Download:
|
| Fig. 1. SEM images of (a) continental shale sample and (b) marine shale sample with EDX mapping. | |
Samples were measured by Bruker's VERTEX 70 FTIR type FTIR. FTIR determines the bond form between chemical elements by measuring the difference in the bond absorptions. 0.1 mg of each of the purified scallop inorganic powders in the continental and seawater was mixed with 10 mg of potassium bromide powder to prepare a tablet, and the chemical bond form contained in the sample was measured.
X-ray photoelectron spectrometer (Thermo Scientific Kα) was used in the sample testing. Approximately 5 mg of the sample was compressed into tablet. Information on the elemental composition, chemical state and molecular structure of the sample surface can be obtained by measuring the peak position and peak shape in the result. Comparison of the FTIR and XPS results will lead to accurate determination of the chemical bonding of kerogen and inorganic substances.
The friction of the marine and continental kerogen which was compressed into tablets was measured by Bruker's AFM (Dimension Icon AFM, Bruker Co., Inc.) The needleless probe (TL-NCL-50) used in this test was adhered to alumina beads having a diameter of 10 μm. The cantilever beam of the probe has a length of 225 μm, a width of 38 μm, a thickness of 7 μm, and an average spring constant of 19.64 N/m. The room temperature was maintained at 24 ℃ and the humidity was maintained at 20% to exclude the impact of the environment on the experiment.
The rock sample is polished by argon ion to make the surface smooth, which is prepared for the subsequent measurement. The EDX surface scan images of the polished sample are shown in Fig. 1. The EDX image of the interface between the rock and the kerogen clearly shows the difference of the element's distribution in the two materials. Marine and terrestrial inorganic samples contain more silicon, aluminum and oxygen; however, the kerogen samples are rich in carbon. Figs. S2a and b (Supporting information) represents Micro-CT image of continental and marine shale samples. The Micro-CT is a 3D imaging technique that demonstrates the porosity of a sample. The porosity of marine shale is higher. Porosity can affect methane and carbon dioxide storage in shale, and higher porosity ensures stronger gas production potential.
To fully analyze the elemental composition and molecular structure of the sample, XPS detection was performed. The elemental compositions of marine and continental kerogen are very similar, both of which contain Al, C, N, O elements with only slightly difference in chemical bond. Four peaks, 282.9, 283.5, 284.8 and 287.3 eV, are found in C 1s spectrum of marine kerogen (Fig. 2a). The 284.8 eV peak represents the signal of single bond between two carbons. The 287.5 eV peak represents the signal of carbon-oxygen double bond. The 285.3 eV peak represents the signal of carbon-carbon double bond. The peak at 284.3 eV corresponds to a C—N bond. The continental kerogen has C—C, C=O, C=C and C—N bonds too (Fig. 2b). Both main peaks correspond to the C—C bond, and the C=C bond signal is stronger in the spectrum of marine kerogen. The O 1s spectrum of marine kerogen can be curve-resolved to two peaks of 530.6 and 532.3 eV, represent Al—O and C=O respectively (Fig. 2c). The oxygen bond in the continental kerogen is more diverse, which contains C—H—O, Fe=O, Al—O and C=O (Fig. 2d). Obviously, there are more Al—O and C=O bonds found in marine kerogen. It can be seen in Fig. 2e that the N 1s spectrum of marine kerogen has two peaks of 400.95 and 399.06 eV, which represent quaternary and pyridinic respectively. Nitrogen of continental kerogen mainly exists in amino and quaternary in C—N bond formation is as shown in Fig. 2f. Figs. 2g and h show the Al 2p spectra of these two kerogens. The Al in marine kerogen mainly exists in Al—O bond and aluminosilicate, and the Al in continental kerogen mainly exists in Al—Si and Al—O bonds. In conclusion, the main chemical bonds contained in kerogen are C—C, C=C and C=O. There are more Al-O bonds found in marine kerogen and most of the chemical bonds in the sea and terrestrial kerogen are same. The percentage content of all the elements is listed in Table S1 (Supporting information).

|
Download:
|
| Fig. 2. (a, c, e, g) XPS spectra for C 1s, O 1s, N 1s and Al 2p of marine kerogen; (b, d, f, h) XPS spectra for C 1s, O 1s, N 1s and Al 2p of continental kerogen. | |
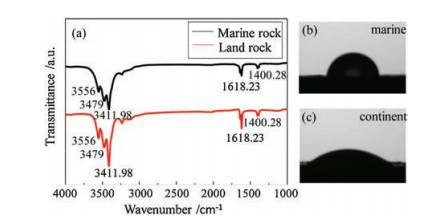
Fig. 3a gives the FTIR spectra of marine and continental kerogen samples. A total of five chemical bonds are observed in each of these spectra. The chemical bonds of terrestrial and marine samples are identical, nevertheless, the intensity is slightly different. The peak belonging to N—H bond appears at 3556 and 3479 cm-1. The peak belonging to O—H bond appears 3411 cm-1, and the chemical bond strength of the kerogen is greater. The peaks at 1618 cm-1 and 1400 cm-1 belong to C=O or C=C bonds and more pronounced peak at 1618 cm-1 is found in the continental kerogen spectrum [18]. Figs. 3b and c reveal the contact angle of marine and continental kerogen to water, which is 75.62° and 26.78° respectively.

|
Download:
|
| Fig. 3. (a) FTIR spectra of marine and continental kerogen samples, contact angle of (b) marine and (c) continental kerogen. | |
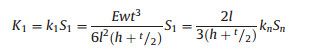
Fig. 4a reveals the friction of marine and continental kerogen at a pressure of 1.038 μN in room temperature (24 ℃). Friction is obtained by multiplying the voltage by the elastic coefficient. The vertical elastic coefficient can be measured by a thermal tuning method, and the horizontal elastic coefficient is measured by the following formula:
|

|
Download:
|
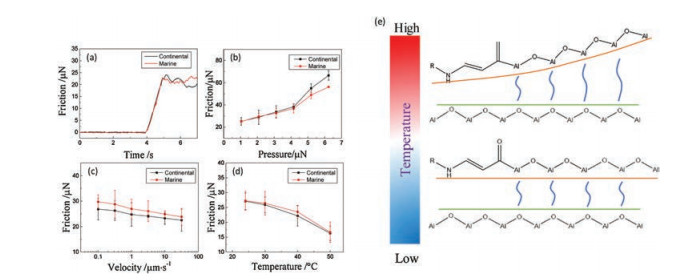
| Fig. 4. (a) Time evolution of friction in marine and continental kerogen; Friction of kerogen in (b) pressure range 1–6.22 μN, (c) velocity range 0.1–31.6 μm/s and (d) temperature range 24–50 ℃; (e) Schematic diagram of the friction between alumina pellets and kerogen (blue curve: Al-O linkage). | |
where E, w, t, l are the Young's modulus, width, thickness and length of the cantilever beam, h is the height of the tip, and Sn is the reflection sensitivity in the vertical direction.
Fig. 4b reveals the relationship between kerogen friction and pressure changes. It can be clearly seen that the frictional force increases with the rise of pressure. There is a turning point at the pressure of 4.152 μN and the curve grows drastically afterwards. The contact area increases along with the growth of pressure causing the enhancement of friction. The growth in continental kerogen is more obvious, which is 63%. Fig. 4c shows the effect of the sliding speed of the probe on the friction of the kerogen at a pressure of 1.038 μN. As shown, friction decreases logarithmically as the sliding speed rises. Riedo et al. [19] found that the friction decreases as sliding velocity increases in the presence of capillary necking. Al—O linkage formed at the interface between alumina pellet and kerogen. Increasing the sliding velocity will break the Al—O linkage at the interface resulting in the decrease of the friction. Fig. 4d shows the influence of temperature on friction of kerogen and alumina pellet at a pressure of 1.038 μN and a probe sliding speed of 1 μm/s. The friction of kerogen in both marine and continent reduce by about 45% with the increasement of temperature. When the temperature rises, molecular thermal motion is enhanced, and the Al—O linkage is weakened [20-22]. As a result of these changes, the friction coefficient will decrease and the frictional force will increase [23-25]. The average friction and adhesion of the kerogen in the sea is greater than that of the kerogen in the continent, which is also insistent with our last paper [2]. This may be because the kerogen in sea contains more Al-O bonds based on the XPS results. Fig. S3 (Supporting information) is the adhesion of marine and continental kerogen at a pressure of 1.038 μN in room temperature (24 ℃). Fig. S4 (Supporting information) shows the SEM images of kerogen surface after AFM test, indicating that the friction tests of AFM didn't cause plastic deformation of kerogen. Fig. 4e shows schematic diagram of the friction between alumina pellets and kerogen.
Due to the ability of kerogen in storing methane, kerogen study has been given high expectation by the researchers and has become a major area of petroleum research. However, the composition of kerogen is complicated which makes the analysis of its chemical structure very challenging. Until now, no significant achievement has been made in this area. In this study, EDX analysis shows that the content of O, Si, Al in kerogen is less than the inorganic substances, but the content of C element is higher. The analytical results of the FTIR and XPS can be mutually validated to better understand the chemical structure of the kerogen. The chemical bonds of kerogen in sea and land are slightly different, mainly containing C—C, C=O, C=C and other chemical bonds. More Al—O bonds are observed in marine kerogen which may be the reason why marine kerogen friction is generally higher than that of continental kerogen. The AFM experiment investigated the effects of pressure, sliding speed and temperature on friction by quantitative analysis. In order to understand the properties of the kerogen more accurately, real temperature of kerogen in the ground is simulated by heating in the temperature experiment. Study on the friction of kerogen has a profound and positive impact on the study of kerogen properties.
In our experiments, the main chemical bonds contained in kerogen are C—C, C=C, C=O, and most of the chemical bonds in the sea and terrestrial kerogen are same. The AFM test results demonstrate that the friction of interface between kerogen and alumina is enhanced at higher pressure while inhibited at increased temperature. The friction decreases logarithmically as the sliding velocity rises. Al—O linkage can influence the friction. When the temperature and sliding velocity rises, the Al—O linkage is weakened and friction decreases. The results of this study are of great significance for further research on kerogen in the field of petroleum engineering.
AcknowledgmentsThis project was supported by the National Natural Science Foundation of China (No. 51875577), the Beijing Nova Program (No. Z171100001117058) and the Science Foundation of China University of Petroleum-Beijing (No. 2462018BJC004).
Appendix A. Supplementary dataSupplementary material related to this article can be found, in the online version, at doi:https://doi.org/10.1016/j.cclet.2019.04.060.
| [1] |
J. Liu, L. Wang, S. Xi, D. Asthagiri, W.G. Chapman, Langmuir 33 (2017) 11189-11202. DOI:10.1021/acs.langmuir.7b02055 |
| [2] |
S. Tian, X. Dong, T. Wang, et al., Langmuir 34 (2018) 13882-13887. DOI:10.1021/acs.langmuir.8b03151 |
| [3] |
T. Wang, S. Tian, G. Li, M. Sheng, J. Nat. Gas Sci. Eng. 50 (2018) 181-188. DOI:10.1016/j.jngse.2017.12.002 |
| [4] |
T. Wang, S. Tian, G. Li, et al., J. Phys. Chem. C 122 (2018) 17009-17018. DOI:10.1021/acs.jpcc.8b02061 |
| [5] |
D.M. Jarvie, R.J. Hill, T.E. Ruble, R.M. Pollastro, AAPG Bull. 91 (2007) 475-499. DOI:10.1306/12190606068 |
| [6] |
D.J.K. Ross, R. Marc Bustin, J. Nat. Gas Sci. Eng. 26 (2009) 916-927. |
| [7] |
S.R. Kelemen, M. Afeworki, M.L. Gorbaty, et al., Energ. Fuel. 21 (2007) 1548-1561. DOI:10.1021/ef060321h |
| [8] |
M. Djuricic, R.C. Murphy, D. Vitorovic, K. Biemann, Geochim. Cosmochim. Acta 35 (1971) 1201-1207. DOI:10.1016/0016-7037(71)90111-6 |
| [9] |
F. Javadpour, M.M. Farshi, M. Amrein, J. Can. Pet. Technol. 51 (2012) 236-243. DOI:10.2118/161015-PA |
| [10] |
Q. Wang, Y. Hou, W. Wu, et al., Fuel Process. Technol. 166 (2017) 30-40. DOI:10.1016/j.fuproc.2017.05.024 |
| [11] |
S.R. Kelemen, M. Afeworki, M.L. Gorbaty, et al., Energ. Fuels 16 (2002) 1507-1515. DOI:10.1021/ef0200828 |
| [12] |
J. Tong, X. Han, S. Wang, X. Jiang, Energ. Fuels 25 (2011) 4006-4013. DOI:10.1021/ef200738p |
| [13] |
A. Dazzi, F. Glotin, R. Carminati, J. Appl. Phys. 107 (2010) 124519. DOI:10.1063/1.3429214 |
| [14] |
A. Centrone, Annu. Rev. Anal. Chem. 8 (2015) 101-126. DOI:10.1146/annurev-anchem-071114-040435 |
| [15] |
J. Yang, J. Hatcherian, P.C. Hackley, A.E. Pomerantz, Nat. Commun. 8 (2017) 2179. DOI:10.1038/s41467-017-02254-0 |
| [16] |
A. Dazzi, C.B. Prater, Q. Hu, et al., Appl. Spectrosc. 66 (2012) 1365-1384. DOI:10.1366/12-06804 |
| [17] |
A. Dazzi, C.B. Prater, Chem. Rev. 117 (2017) 5146-5173. DOI:10.1021/acs.chemrev.6b00448 |
| [18] |
P.C. Painter, R.W. Snyder, M. Starsinic, et al., Appl. Spectrosc. 35 (1981) 475-485. DOI:10.1366/0003702814732256 |
| [19] |
E. Riedo, F. Lévy, H. Brune, Phys. Rev. Lett. 88 (2002) 185505. DOI:10.1103/PhysRevLett.88.185505 |
| [20] |
Y. Wang, X. Gong, J. Mat. Chem. A 5 (2017) 3759-3773. DOI:10.1039/C6TA10474F |
| [21] |
Y. Wang, X. Gong, Adv. Mater. Interfaces 4 (2017) 1700190. DOI:10.1002/admi.201700190 |
| [22] |
X. Gong, Y. Wang, T. Kuang, ACS Sustain. Chem. Eng. 5 (2017) 11204-11214. DOI:10.1021/acssuschemeng.7b03613 |
| [23] |
S.Y. Krylov, K.B. Jinesh, H. Valk, M. Dienwiebel, J.W.M. Frenken, Phys. Rev. E 71 (2005) 065101. DOI:10.1103/PhysRevE.71.065101 |
| [24] |
X. Zhao, M. Hamilton, W.G. Sawyer, S.S. Perry, Tribol. Lett. 27 (2007) 113-117. DOI:10.1007/s11249-007-9220-2 |
| [25] |
A. Schirmeisen, L. Jansen, H. Hölscher, H. Fuchs, Appl. Phys. Lett. 88 (2006) 123108. DOI:10.1063/1.2187575 |