 2020, Vol. 31


b Research Institute for New Materials Technology, Chongqing University of Arts and Sciences, Chongqing 402160, China;
c Stomatology Department of the General, Department of Orthopedic, Hospital of Chinese PLA, Beijing 100853, China
Carbon dots (CDs) are a new branch of carbon-containing materials with a zero-dimensional morphology and a diameter less than 10 nm. Since its first discovery in 2004, CDs have drawn a dramatical attention and thus being widely studied by many researchers [1]. From these studies, CDs are found to possess many unique optical properties and some outstanding advantages, such as the excellent chemical stability, low toxicity, high biocompati-bility, low cost and ease to be utilized. Based on these properties, CDs have been extensively applied in various fields which include biomedical imaging [2, 3], fluorescent probes and detectors [4-8], biosensors [9, 10], catalysis [11], and optoelectronic devices such as white light emitting diodes (WLEDs) [12, 13].
At the early stage, the fluorescence emission of many synthesized CDs was limited in a blue light region and the photoluminescence quantum yield (PLQY) was considerably low, which significantly prevented the widespread application of CDs. During decades of research, many methods have been developed for the synthesis of CDs such as heteroatom doping [14] and surface engineering [15]. With continuous efforts, CDs with various emission region from blue light to near infrared (NIR) have been prepared and the PLQY has also been greatly improved [16-23]. For instance, Yang et al. chose citric acid and ethylenedi-amine as precursors to synthesize nitrogen-doped carbon dots (N-CDs) with a PLQY up to 80% [19]. Sun et al. synthesized green luminescent CDs based on the combination of surface-doping with inorganic semiconductors and organic functionalization, and the prepared CZnS-dots and CTiO2-dots exhibited a high PLQY of 78% in ethanol [18]. Although blue and green emissive CDs with high PLQY over 70% have been achieved, there are still challenges to synthesize the long-wavelength emissive CDs with a high PLQY because it is difficult to control the formation of a larger sp2 π-conjugation domains [24]. For example, Qu et al. synthesized an orange-emissive CDs with a PLQY of 46% by the surface metal-cation-functionalizing strategies from the solvo-thermally synthesized CDs [21]. Besides, it is also notable that a highly efficient red-emissive CDs with a 53% PLQY has been reported by Yang et al. [23].
In addition to the single-color photoluminescence (PL), the synthesis of CDs with a tunable PL has also attracted increasing interests recently. The key to realize the multicolor emission is to control the surface state and particle size of the CDs, which will affect their internal energy levels and thus changing the electron transition process when excited [25]. There have been several reports of CDs with tunable PL obtained by adjusting reactants and reaction conditions [25-28]. For example, Lin et al. used three isomers of phenylenediamine (PD) to obtain solvo-thermally synthesized CDs with blue, green and red emission under a single excitation wavelength [27]. Followed by this work, Yuan et al. firstly demonstrated the synthesis of five kinds of multicolor bandgap CDs from blue to red and the blue fluorescence can reach up to 75% [28]. The tunable PL feature could significantly expand the application of CDs, especially to WLEDs and bioimaging. However, to the best of our knowledge, most recent methods usually used several kinds of precursors and are time-consuming to achieve tunable PL, which is disadvantageous to the under-standing of fluorescence mechanism. Hence, it is highly desirable to develop a facial and cheap method to synthesis water-soluble CDs with tunable PL and to further explore their potential applications.
In this work, a simple method was developed to synthesize water-soluble N-CDs and with a highgreen PLQY. p-Hydroquinone (0.001 mol/L) and ethylenediamine (20 μL/10 mL) were chosen as precursors of the hydrothermal reaction and the PLQY of the as-prepared N-CDs was up to 15.9%. Before this work, several groups have synthesized green emissive CDs with a considerably high PLQY. For example, Yuan et al. used citric acid and diaminonaphthalene as precursors to synthesis green emissive CDs, with a high PLQY of 73% in ethanol [28]. Sun et al. combined the surface-doping with inorganic semiconductors and organic functionalization strategies to synthesized CDs, which realized a PLQY of 78% in ethanol [18]. However, most green emissive CDs with a relatively high PLQY are prepared through organic solvents, which may bring difficulties to the purification process and also limit their further applications. Besides, these methods are usually material-consuming. To the best of our knowledge, there has been less report on the preparation of single N doped green emissive CDs with such a high PLQY using ultra-low adding volume (20 μL/10 mL) of doping agents (Table S1 in Supporting information). Moreover, the as-prepared N-CDs showed excellent solubility in different solvents including water and several organic solvents, and an enhanced PLQY (up to 25.3%) can be achieved through the solvent-dependent strategy. Further characterization demonstrat-ed a highly passivated surface with different states of nitrogen existed in the N-CDs prepared by different adding volume of doping agents. The as-prepared N-CDs were then applied as a fluorescent sensor to detect the acetone and hydrogen peroxide in water. These findings expand the knowledge of the enhanced PLQY and the tunable PL, which is beneficial to endow CDs with more potential applications.
In this study, the N-CDs were prepared through a simple one-pot hydrothermal method. The synthesis was accomplished based on the building up process from the carbon-containing precursors. Specifically, hydroquinone and ethylenediamine were selected as precursors and passivation agents. The schematic of the N-CDs synthesis is shown in Fig. 1a. According to our previous research [29], it is believed that the PLQY of the prepared N-CDs can be affected by (ⅰ) the ratio of the precursors, (ⅱ) the temperature of the hydrothermal reaction, (ⅲ) the reaction time of the hydrothermal reaction. Therefore, an optimized experimental procedure was essential to improve the fluorescence properties of the prepared N-CDs. Based on various control experiments, the ratio of precursors was considered as a crucial factor that influences the photo-physical performance of CDs and hence was investigated firstly. The concentration of hydroquinone was fixed at 0.001 mol/L while the adding volume of doping agent (i.e., ethylenediamine) was changed from 5 μL/10 mL to 60 μL/10 mL (5, 10, 20, 40, 60 μL/10 mL were selected in this study), and the reaction temperature and time were maintained at 180 ℃ and 16 h respectively. As shown in Figs. S1a and S2 (Supporting inforamtion), with the increase of the ethylenediamine concentration, more nitrogen was doped into CDs thus contributing to an increase in the PLQY. However, although the mechanism was not clear yet, it is believed that an excess of the heterogeneous elements may have blocked the passivated surface defects, which led to a decreased PLQY. Therefore, the maximum fluorescence intensity and PLQY were obtained when the adding volume of ethylenediamine was 20 μL/10 mL. The reaction temperature and time were also optimized subsequently and the results are shown in Figs. S1b and c (Supporting information). Through the optimization experiment, it is found that an ethyl-enediamine adding volume of 20 μL/10 mL, a reaction temperature of 190 ℃ and a reaction time of 16 h led to the formation of N-CDs with the maximum PLQY (15.9%).

|
Download:
|
| Fig. 1. (a) Schematic showing the synthesis process of the green luminescence N-CDs (under the excitation of a 365 nm light); (b) Photoluminescence spectra of the N-CDs; (c) UV–vis absorption spectra of the N-CDs in a diluted suspension; (d) The fluorescence decays of N-CDs; (e) Large area TEM image depicting the well separated N-CDs and the diameter distribution of the N-CDs calculated from the TEM image; (f, g) Lattice resolved HRTEM images of N-CDs. | |
The photoluminescence properties of the as-prepared optimized N-CDs (an ethylenediamine adding volume of 20 μL/10 mL, a reaction temperature of 190 ℃ and a reaction time of 16 h) were investigated firstly using a fluorescence spectrometer. As shown in Fig. 1b, the as-prepared N-CDs demonstrated an intense emission centered at 520 nm when excited at wavelengths from 360 nm to 460 nm, among which an excitation wavelength of 410 nm led to the maximum emission. It can be indicated by this excitementindependent emission that the N-CDs possessed a homogeneous surface structure and a narrow size distribution. The UV–vis absorption spectra (Fig. 1c) shows a peak centered at 254 nm ascribed to the π-π* transition of the carbonic π-conjugation structure and a strong peak at 286 nm which are due to the n-π* transition of the nitrogen-and oxygen-contained functional groups in N-CDs. The strong n-π* transition indicated a narrow energy band in N-CDs. Besides, the obvious broadband at around 410 nm was resulted from the trapping of excited state energy by surface states. The fluorescence decay of N-CDs (Fig. 1d) shows a lifetime of approximately 4.18 ns. These observations suggest that the as-prepared N-CDs were homogeneous in properties and rich in surface states, which are believed to be responsible for the high PLQY.
The surface morphology of the optimized N-CDs was analyzed via transmission electron microscopy (TEM), high-resolution transmission electron microscopy (HRTEM) and atomic force microscopy (AFM). TEM image (Fig. 1e) shows that the size distribution of N-CDs ranges from 3.33 nm to 7.08 nm with an average diameter of 4.92 nm. As shown in HRTEM images (Figs. 1f and g), the lattice fringes of N-CDs display the interplanar spacings of 0.35 nm and 0.38 nm. In addition, the AFM image (Fig. S3 in Supporting information) further exhibited that the N-CDs are mostly quasi-spherical and monodispersed with a narrow size distribution. The apparent height of N-CDs was found to be around 9.5 nm in the AFM image. The results of both TEM and AFM indicate a homogeneous surface structure and a narrow size distribution of N-CDs, which is consistent with the excitement-independent photoluminescence in Fig. 1b.
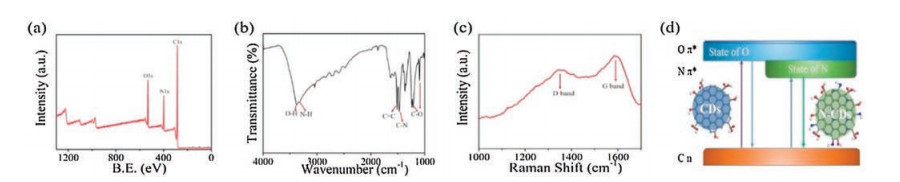
XPS, FTIR, and Raman were conducted subsequently to analyze the surface chemistry of the optimized N-CDs (an ethylenediamine adding volume of 20 μL/10 mL, a reaction temperature of 190 ℃ and a reaction time of 16 h) and thus taking insights into the mechanism of the robust photoluminescence. The XPS full spectra (Fig. 2a) shows three typical peaks which are C 1s (284.7 eV), N 1s (399.1 eV) and O 1s (532.1 eV) and the elemental content of the asprepared N-CDs was estimated to be C of 71.75 at%, N of 14.48 at%, and O of 13.77 at% by measuring the intensity ratio of the integrated peak (Table S2 in Supporting information). The XPS peaking fitting results of the optimized N-CDs were shown in Fig. S4 (Supporting information). In the C 1s high-resolution XPS spectra (Fig. S4a), three distinct peaks at 284.51, 285.76 and 287.18 eV are observed which are corresponding to C=C, C-C/C-N and C-O, respectively [30, 31]. The C=C was believed to derive from the core sp2 conjugation structure of CDs while the C-N peak indicated that N was incorporated into CDs via the formation of C-N bonds. The C-O peak indicated that a higher oxidation state of C existed in the N-CDs. In the case of O 1s spectra (Fig. S4b), only one peak is found at 531.8 eV representing C-OH/C-O-C [32], which further confirms the oxidation state of C in the N-CDs structure. This oxidation state is regarded as the passivation spots in CDs which leads to the high PLQY. In the highresolution spectra of N 1s (Fig. S4c), there are two peaks centered at 398.4 and 399.4 eV, which are attributed to pyridinic N and amino N, respectively [33]. The N 1s spectra further suggests that N was successfully doped into CDs in the form of pyridinic N and amino N rather than graphitic, thereby indicating that some N was doped in the edge or defect area of the CDs' graphitized structure [7].

|
Download:
|
| Fig. 2. (a) XPS spectra; (b) FTIR spectra; and (c) Raman spectra of the optimized N-CDs; (d) Mechanic schematic showing the effect of N doping to the photoluminescence of CDs. | |
From the FTIR spectra (Fig. 2b), the peaks centered at 3200 cm-1 (N-H stretching vibration), 1417 cm-1 (C-N stretching vibration), 1213 and 1098 cm-1 (C-O stretching vibration) are consistent with the XPS analysis. Interestingly, by comparing the FTIR spectra of the as-prepared N-CDs and the precursor hydroquinone (Fig. S5 in Supporting information), it can be found that the major functional groups in hydroquinone are reserved in N-CDs such as C=C centered around 1513 cm-1 and O-H at around 3376 cm-1 but several new structures were formed after the hydrothermal reaction such as the C-N and N-H discussed above. The results of XPS and FTIR are consistent which confirms the high oxidation state of C and the successful doping of N via the formation of C-N bonds.
The Raman spectra (Fig. 2c) contains two distinct peaks centered at around 1351 cm-1 and 1586 cm-1 which are assigned to the D band arising from vibrations of disordered carbon atoms [34] and G band arising from the sp2-conjugated carbon atoms [35], respectively. The peak intensity ratio of D and G band (ID/IG) was calculated to be 0.93, suggesting the presence of a graphite structure in N-CDs. The high intensity of D band as well as the high width of D and G bands both indicate the existence of high-density defects resulting from the nitrogen doping [34]. The Raman spectra is further consistent with the XPS and FTIR analysis, indicating that the successful doping of N on the surface of CDs layers caused a surface passivation effect, thus improving the density of surface defects. Besides, as shown in Fig. 2d, a model mechanism may explain the PL processes of the N-CDs. The doping of N on the surface of CDs can lead to a homogeneous surface state and also a decrease in energy levels, which may lead to a red shift of the absorption and emission band [36]. On the other band, it could be assumed based on previous research that the major state of Ndopant in CDs is a crucial reason for a high PLQY [37]. In this work, it can be inferred that the highest PLQY of N-CDs may be resulted from the optimal balance between the pyridinic N and the amino N on the surface of CDs, so that the electrons and holes can be optimally compounded in the Forest energy resonance.
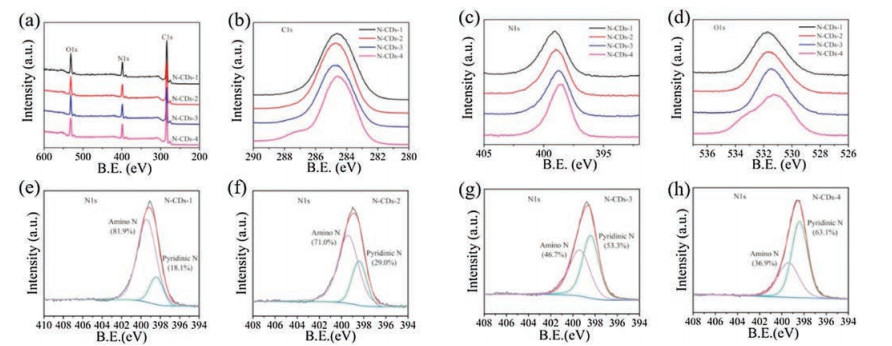
To further understand the effect of chemical states in CDs to the PLQY, N-CDs synthesized by different adding volume of ethylenediamine were also prepared and four different ethylenedi-amine adding volume which are 5, 10, 20, and 60 μL/10 mL were selected in this study to investigate the mechanism based on the XPS analysis. The prepared N-CDs were recorded as N-CDs-1, N-CDs-2, N-CDs-3 and N-CDs-4, respectively. Fig. 3a showed the XPS full spectra of the four types of N-CDs. Compared with the C 1s high-resolution spectra (Fig. 3b), the high-resolution spectra of N 1s (Fig. 3c) and O 1s (Fig. 3d) both demonstrated an obvious difference. From the N 1s high-resolution spectra (Fig. 3c), it is noteworthy that as the doping amount of ethylenediamine increases (from N-CDs-1 to N-CDs-4), the N 1s peak shows an obvious decrease in width and the peak also shifts simultaneously to a lower binding energy direction, indicating a gradually reduced chemical states of N. However, the peak of N-CDs-4 in O 1s spectra (Fig. 3d) became obviously wider, which may be resulted from the combination of excessive N atoms with O, thus indicating the further oxidation of N which may decrease the PLQY adversely. Besides, from the XPS peaks fitting analysis of the N 1s high-resolution spectra (Fig. 3e-h), it can be found that the amino N was the major existing state of nitrogen when the adding volume of ethylenediamine was less than 20 μL. However, the pyridinic N became the major state of N existed in N-CDs gradually as the adding volume of ethylenediamine increased. Interestingly, the closest content of pyridinic N and amino N was found when the adding volume of ethylenediamine was 20 mL (N-CDs-3), which was corresponding to N-CDs-3 with the highest PLQY. This result further indicated that a high PLQY of N-CDs should be closely related to the optimal balance between the pyridinic N and the amino N.

|
Download:
|
| Fig. 3. (a) XPS full spectra of N-CDs-1, 2, 3 and 4; (b–d) High-resolution XPS C 1s, N 1s, O 1s spectra of N-CDs-1, 2, 3 and 4; (e–h) High-resolution N 1s XPS peak fitting results of N-CDs-1, 2, 3 and 4, respectively. | |
The environmental pH is believed to have a significant impact on the PL property of CDs. Stable fluorescence emission over a wide range of pH can broadly extend its potential applications. Thus, the pH-dependent PL behavior of the as prepared N-CDs was investigated. As shown in Fig. S6 (Supporting information), the fluorescence of the N-CDs was relatively stable when the pH varied from 4 to 11 indicating a high adaptability and good application prospect of the N-CDs in a wide pH range. However, when the pH is less than 4 or more than 11, the fluorescence of CDs dramatically decreased and even was quenched, indicating that the strong acid and base will affect the surface emitting groups of N-CDs.
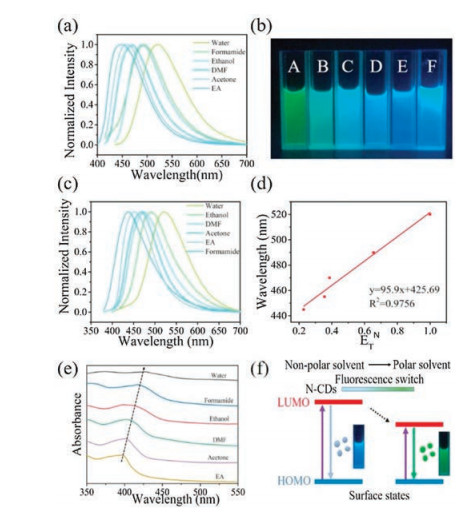
Solvent-dependent effect provides a facial and efficient way to realize the tunable PL of CDs, which can further broaden the application of these materials. Up to now, several studies have shown the effectiveness of this strategy to realize the tunable fluorescence of CDs [32, 38-40]. In this work, the fluorescence of N-CDs in solvents with different polarity including water, formamide, ethanol, N, N-dimethylformamide (DMF), acetone and ethyl acetate (EA) was investigated. The as-prepared N-CDs powder showed excellent solubility in the first five solvents without any further chemical modification but forms a little precipitate in EA. As shown in Fig. 4a, when excited at 410 nm, the emission peak gradually shifted from 445 nm to 520 nm with the increase of solvent polarity and the corresponding fluorescence shifted from blue to cyan and then to green, indicating an obvious solvent-dependent PL. However, this polarity-dependent trend was not found when the excitation wavelength was 365 nm (Figs. 4b and c). It was shown in Figs. 4b and c that formamide with a relatively strong polarity demonstrated an opposite blue fluorescence. To explain this contradiction, further characterization was conducted (Fig. S7 in Supporting information). The emission spectra of formamide (Fig. S7b) demonstrated excitation-dependent emission peaks centered at 495 nm and 430 nm, indicating two different states of N-CDs existed in formamide. Differently, excitation-independent emissions were observed in other five solvents, which indicates the existence of uniform surface states in N-CDs and can explain the consistent fluorescence shift among these solvents when different excitation wavelengths were used. Furthermore, except formam-ide, the emission peak (y) of N-CDs in other five solvents showed a linear relationship with the Reichardt's polarity parameter ETN (x) [41], which can be described as y = 95.9x + 425.69 with a correlation coefficient of 0.9756 (Fig. 4d). The UV–vis absorption spectra of N-CDs in different solvents were also measured (Fig. 4e). Correspondingly, the absorption bands at around 400 nm also demonstrated a gradual red shift with the increasing solvent polarity, which is consistent with the red shift of PL. Besides, as the solvent polarity increased, the absorption band became signifi-cantly broader, indicating more kinds of surface states transitions existing in CDs. Interestingly, it can also be seen in Fig. 4e that the absorption intensity gradually reduced with the increasing solvent polarity and the weakest intensity was found in water. This observation, which is believed to cause the difference in the PLQY, is possibly due to the intensive interactions between CDs and polar solvents. The difference in UV–vis absorption spectra further confirms the difference in surface states. The PLQY and life time of N-CDs in six solvents were also calculated (Table S3 in Supporting information). The highest PLQY was obtained in DMF which is up to 25.3% while the lowest PLQY of 12.5% was obtained in water. Consistent with PLQY, the highest lifetime of 8.80 ns was obtained in DMF while the lowest lifetime was obtained in water which was only 3.95 ns. In addition, it is notable that the PLQYs in organic solvents are all higher than that in water which is consistent with the magnitude of UV absorption seen in these solvents (Fig. 4e). This indicates that an enhanced PLQY can be obtained due to the solvent-dependent PL. Thereby, it is further believed that the fluorescent behavior of CDs is closely related to the surface states. According to previous research, the solvent-dependent property of CDs is resulted from the difference in interactions between CDs and solvent. In polar solvents, the hydrogen bond interactions and the dipole-dipole interactions are predominant [42-44]. Therefore, it can be inferred that the interactions between CDs and solvents with different polarity leads to different surface states of CDs, which further leads to different energy gaps between HOMO and LUMO, thus making the PL tunable (Fig. 4f).

|
Download:
|
| Fig. 4. (a) The normalized photoluminescence spectra of the N-CDs dispersed in different solvents (excited by a 410 nm light); (b) Image of the N-CDs' fluorescence excited at 365 nm in different solvents: water (A), ethanol (B), DMF (C), acetone (D), ethyl acetate (E) and formamide (F); (c) The normalized photoluminescence spectra of the N-CDs dispersed in different solvents(excited by a 365 nm light); (d) The linear relationship between the emission peak of spectra from five different solvents in Fig. 4b (except formamide) and the ETN solvent polarity parameter; (e) UV–vis absorption spectra of N-CDs in six different solvents; (f) Schematic showing the possible mechanism of the solvent-dependently tunable photoluminescence. | |
Based on these findings, applications utilizing the excellent photoluminescence properties of N-CDs were further explored. Organic matters are considered as a potential threat for human health and environment. Remarkably, acetone has been proved to be closely related with the type-1 diabetes after extensive medical research [45, 46]. Besides, acetone is a common water impurity in environment and laboratory reactions. Therefore, it is highly desirable to develop facile approaches to detect acetone in water. So far, semiconductor metal oxide-based or graphene oxide-based nanofibers have been designed to detect trace of acetone [47, 48]. Although this method exhibits high sensitivity, it can only detect the acetone in gas state, which requires high operation tempera-ture and is costly. Thus, a method capable of detecting liquid state acetone is of great significance.
In this work, acetone detection in water using N-CDs as probes were conducted. As shown in Fig. 5a and Fig. S8 (Supporting information), with the acetone content in water ranging from 0% to 100%, the emission peak of the N-CDs probes demonstrated a continuous blue shift while the fluorescence intensity showed a gradually increasing trend. Specifically, the maximum emission wavelength is linearly against acetone content in the range of 0.4%– 10% and 10%–90% with a correlation coefficient of 0.9863 and 0.9865, respectively (Figs. 5a and b). When comparing the slopes, it can be found that the maximum emission wavelength is more sensitive to the acetone content lower than 10%, indicating the high sensitivity to detect trace of acetone. The difference in slopes may result from the different preferred solvation trend of N-CDs in water-acetone system. In addition, it is also notable that the fluorescence intensity also showed a strong linear relationship against acetone content varying from 2% to 40% with a correlation coefficient of 0.9954 (Fig. 5c). The detection limit of acetone was estimated to be 0.060% based on the signal to noise ratio of 3. Besides, interference experiments were conducted to verify the specificities of N-CDs as fluorescence probes to detect acetone. For those who are suffering from the type-1 diabetes, acetone is considered as a typical indicator for this disease and is easy to detect in the patients' urine. Thereby, in the interference experiment, several bio-molecules including urea, glycine, Na+, K+, HCO3, PO43- with a concentration of 0.1 mol/L were selected to simulate the actual bio-environment and were introduced to the N-CDs' solution. The emission spectra of these solutions under the excitation of a 410 nm light were investigated subsequently. As shown in Fig. S9a (Supporting information), a significant change in the emission peak could only be observed in the acetone solution (with a volume fraction of 0.5) while other solutions had no obvious effect. Interestingly, a notable increase in the fluorescence intensity was also observed only in acetone solution (Fig. S9b in Supporting information). This observation suggests the strong potential of the N-CDs as ideal candidates for the selective and sensitive detection of acetone. Before this work, Chao et al. firstly applied CDs as fluorescence probes to determine the water content in organic solvents and achieved a detection limit of 0.13% for tetrahydrofuran (THF) [38]. However, to the best of our knowledge, this is the first time that a detection limit under 0.1% was achieved.

|
Download:
|
| Fig. 5. (a) The original emission spectra of N-CDs dispersed in water with different acetone content; (b, c) The emission peak of the N-CDs solution versus different acetone contents in water; (d) The fluorescence intensity of the N-CDs solution versus the acetone content in water. (Error bars in (b–d) represent the standard deviations of five independent measurements). | |
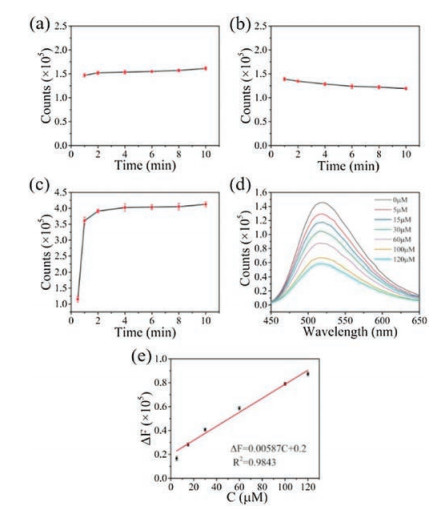
In addition to acetone, hydrogen peroxide (H2O2) is also an important chemical related to cell health. In this work, the utilization of N-CDs as a probe to detect H2O2 was investigated. According to previous work, the fluorescence of CDs can be quenched by hydroxyl radical generated from the Fenton reaction between H2O2 and Fe2+. Therefore, the time-dependent changes in the fluorescence intensity of N-CDs with the only presence of 50 μmol/L H2O2 or 50 μmol/L Fe2+ were examined firstly and no significant change was observed as shown in Figs. 6a and b. This observation indicates that the N-CDs cannot be quenched by H2O2 or Fe2+ alone. However, when the same concentration of H2O2 and Fe2+ were employed together in N-CDs' solution, a significant decrease was observed (Fig. 6c). Specifically, an obvious decay was observed after 0.5 min and a significant change appeared after 1 min, indicating a quick response time. The intensity stabilizes within 5 min, thus signal collected at 5 min can be used to properly determine the H2O2. Next, different concentrations of H2O2 were added into N-CDs solution and the fluorescence intensity was recorded after 5 min. Fig. 6d showed a gradual decrease in the fluorescence intensity as the H2O2 concentration increased. A linear relationship was observed between the change in fluores-cence intensity (ΔF) and the H2O2 concentration. The resultant calibration curve in Fig. 6e demonstrated a good linearity when the concentration of H2O2 varying from 5 μmol/L to 120 μmol/L, with a correlation coefficient of 0.9843. The detection equation was defined as ΔF = 0.00587C + 0.2. The detection limit was calculated to be 2 μmol/L based on the S/N of 3. To further understand the mechanism of the fluorescence quenching caused by Fenton reaction, the UV–vis absorption of N-CDs before and after quenching were measured respectively. Despite the fact that addition of H2O2 and Fe2+ together caused a significant decline in the fluorescence intensity, the UV–vis absorption of N-CDs did not change, as shown in Fig. S10 (Supporting information), suggesting that the functional groups in N-CDs are in the same state. Thereby, it can be deduced that the fluorescence quenching was resulted from the electron transfer process between N-CDs and the hydroxyl radical (OH) generated from the Fenton reaction, which may absorb on the surface of N-CDs [49]. This absorption can lead to the non-radiative electron/hole recombination process, which is closely related to the fluorescence quenching.

|
Download:
|
| Fig. 6. Time-dependent fluorescence intensity of N-CDs in (a) 50 μmol/L of H2O2 solution, (b) 50 μmol/L of Fe2+ solution; (c) The diversity degree of N-CDs' fluorescence intensity changes over time in the presence of both 50 μmol/L of H2O2 and 50 μmol/L of Fe2+; (d) The emission spectra of N-CDs solution in the presence of 50 μmol/L of Fe2+ and different concentrations of H2O2 (0, 5, 15, 30, 60, 100, 120 μmol/L); (e) The change in fluorescence intensity of N-CDs at 520 nm versus the concentration of H2O2. (Error bars in (a–c) and (e) represent the standard deviations of five independent measurements). | |
In summary, a facial hydrothermal method was developed to synthesize N-CDs with a low nitrogen doping amount but a high PLQY up to 15.9%, which were further characterized by a series of techniques including TEM, AFM, XPS, FTIR and Raman. The as-prepared N-CDs have exhibited an excitation-independent but solvent-dependent fluorescence and an enhanced PLQY (up to 25.3%) in different solvents. Benefitting from these properties, N-CDs were applied as fluorescent probes to detect acetone in water with a detection limit under 0.1% and to detect H2O2 ranged from 0 to 120 μmol/L. Therefore, this work demonstrates the promising prospect of CDs used as sensors in chemical, environmental and biomedical fields.
AcknowledgmentsWe thank the National Science Foundation of China (No. 31340014), Beijing Nova Program Interdisciplinary Studies Coop-erative Project (No. Z181100006218138), the Research Program of Yongchuan Science and Technology Commission (Ycstc, No. 2018nb1402) for the support.
Appendix A. Supplementary dataSupplementary material related to this article can be found, in the online version, at doi:https://doi.org/10.1016/j.cclet.2019.04.014.
| [1] |
X. Xu, R. Ray, Y. Gu, et al., J. Am. Chem. Soc. 126 (2004) 12736-12737. DOI:10.1021/ja040082h |
| [2] |
C. Hu, Y. Liu, J. Chen, Q. He, H. Gao, J. Colloid Interface Sci. 480 (2016) 85-90. DOI:10.1016/j.jcis.2016.07.007 |
| [3] |
S. Ruan, J. Qian, S. Shen, et al., Nanoscale 6 (2014) 10040-10047. DOI:10.1039/C4NR02657H |
| [4] |
D.K. Dang, C. Sundaram, Y.L.T. Ngo, et al., Sens. Actuators B-Chem. 255 (2018) 3284-3291. DOI:10.1016/j.snb.2017.09.155 |
| [5] |
W. Cheng, J. Xu, Z. Guo, et al., J. Mater. Chem. B 6 (2018) 5775-5780. DOI:10.1039/C8TB01271G |
| [6] |
Q. Xu, J. Zhao, Y. Liu, et al., J. Mater. Sci. 50 (2015) 2571-2576. DOI:10.1007/s10853-015-8822-6 |
| [7] |
Q. Xu, B. Li, Y. Ye, et al., Nano Res. 11 (2018) 3691-3701. DOI:10.1007/s12274-017-1937-0 |
| [8] |
M.C. Rong, K.X. Zhang, Y.R. Wang, X. Chen, Chin. Chem. Lett. 28 (2017) 1119-1124. DOI:10.1016/j.cclet.2016.12.009 |
| [9] |
S. Yang, J. Sun, X. Li, et al., J. Mater. Chem. A 2 (2014) 8660-8667. DOI:10.1039/c4ta00860j |
| [10] |
P. Miao, K. Han, Y. Tang, et al., Nanoscale 7 (2015) 1586-1595. DOI:10.1039/C4NR05712K |
| [11] |
B. Huang, J. He, S. Bian, et al., Chin. Chem. Lett. 29 (2018) 1698-1701. DOI:10.1016/j.cclet.2018.01.004 |
| [12] |
C. Sun, Y. Zhang, K. Sun, et al., Nanoscale 7 (2015) 12045-12050. DOI:10.1039/C5NR03014E |
| [13] |
J. Tang, Y. Zhang, B. Kong, et al., Nano Lett. 14 (2014) 2702-2708. DOI:10.1021/nl500608w |
| [14] |
X. Wang, L. Cao, F. Lu, et al., Chem. Commun. (2009) 3774-3776. |
| [15] |
J. Cheng, C.F. Wang, Y. Zhang, S. Yang, S. Chen, RSC Adv. 6 (2016) 37189-37194. DOI:10.1039/C5RA27808B |
| [16] |
P. Anilkumar, X. Wang, L. Cao, et al., Nanoscale 3 (2011) 2023-2027. DOI:10.1039/c0nr00962h |
| [17] |
W. Xiao, Y. Li, C. Hu, et al., J. Colloid Interface Sci. 497 (2017) 226-232. DOI:10.1016/j.jcis.2017.02.068 |
| [18] |
M. Sun, S. Qu, Z. Hao, et al., Nanoscale 6 (2014) 13076-13081. DOI:10.1039/C4NR04034A |
| [19] |
S. Zhu, Q. Meng, L. Wang, et al., Angew. Chem. 125 (2013) 4045-4049. DOI:10.1002/ange.201300519 |
| [20] |
Q.L. Chen, C.F. Wang, S. Chen, J. Mater. Sci. 48 (2013) 2352-2357. DOI:10.1007/s10853-012-7016-8 |
| [21] |
S. Qu, D. Zhou, D. Li, et al., Adv. Mater. 28 (2016) 3516-3521. DOI:10.1002/adma.201504891 |
| [22] |
X. Miao, X. Yan, D. Qu, et al., ACS Appl. Mater. Interfaces 9 (2017) 18549-18556. DOI:10.1021/acsami.7b04514 |
| [23] |
Z. Wang, F. Yuan, X. Li, et al., Adv. Mater. 29 (2017) 1702910. DOI:10.1002/adma.201702910 |
| [24] |
M.A. Sk, A. Ananthanarayanan, L. Huang, K.H. Lim, P. Chen, J. Mater. Chem. C 2 (2014) 6954-6960. DOI:10.1039/C4TC01191K |
| [25] |
L. Bao, C. Liu, Z.L. Zhang, D.W. Pang, Adv. Mater. 27 (2015) 1663-1667. DOI:10.1002/adma.201405070 |
| [26] |
S.N. Islam, A. Sil, S.K. Patra, Dalton Trans. 46 (2017) 5918-5929. DOI:10.1039/C7DT00895C |
| [27] |
K. Jiang, S. Sun, L. Zhang, et al., Angew. Chem. Int. Ed. 54 (2015) 5360-5363. DOI:10.1002/anie.201501193 |
| [28] |
F. Yuan, Z. Wang, X. Li, et al., Adv. Mater. 29 (2017) 1604436. DOI:10.1002/adma.201604436 |
| [29] |
Q. Xu, Y. Liu, C. Gao, et al., J. Mater. Chem. C 3 (2015) 9885-9893. DOI:10.1039/C5TC01912E |
| [30] |
K. Jiang, L. Zhang, J. Lu, et al., Angew. Chem. 128 (2016) 7347-7351. DOI:10.1002/ange.201602445 |
| [31] |
M. Vedamalai, A.P. Periasamy, C.W. Wang, et al., Nanoscale 6 (2014) 13119-13125. DOI:10.1039/C4NR03213F |
| [32] |
H. Wang, C. Sun, X. Chen, et al., Nanoscale 9 (2017) 1909-1915. DOI:10.1039/C6NR09200D |
| [33] |
Y.R. Park, Y.J. Hu, Y.S. Seo, W.K. Choi, Sci. Rep. 7 (2017) 46422. DOI:10.1038/srep46422 |
| [34] |
D. Pan, J. Zhang, Z. Li, M. Wu, Adv. Mater. 22 (2010) 734-738. DOI:10.1002/adma.200902825 |
| [35] |
F. Liu, M.H. Jang, H.D. Ha, et al., Adv. Mater. 25 (2013) 3657-3662. DOI:10.1002/adma.201300233 |
| [36] |
D. Qu, Z. Sun, M. Zheng, et al., Adv. Opt. Mater. 3 (2015) 360-367. DOI:10.1002/adom.201400549 |
| [37] |
Y. Sun, B. Zhou, Y. Lin, et al., J. Am. Chem. Soc. 128 (2006) 7756-7757. DOI:10.1021/ja062677d |
| [38] |
D. Chao, W. Lyu, Y. Liu, et al., J. Mater. Chem. C 6 (2018) 7527-7532. DOI:10.1039/C8TC02184H |
| [39] |
D. Pan, J. Zhang, Z. Li, et al., Chem. Commun. 46 (2010) 3681-3683. DOI:10.1039/c000114g |
| [40] |
S. Zhu, J. Zhang, C. Qiao, et al., Chem. Commun. 47 (2011) 6858-6860. DOI:10.1039/c1cc11122a |
| [41] |
C. Reichardt, Chem. Rev. 94 (1994) 416-431. |
| [42] |
Y. Choi, S. Kim, Y. Choi, et al., Adv. Mater. 29 (2017) 1701075. DOI:10.1002/adma.201701075 |
| [43] |
S.S. Jones, P. Sahatiya, S. Badhulika, New J. Chem. 41 (2017) 13130-13139. DOI:10.1039/C7NJ03513F |
| [44] |
S. Mukherjee, E. Prasad, A. Chadha, Phys. Chem. Chem. Phys. 19 (2017) 7288-7296. DOI:10.1039/C6CP08889A |
| [45] |
G.A. Reichard, C.L. Skutches, R.D. Hoeldtke, O.E. Owen, Diabetes 35 (1986) 668-674. DOI:10.2337/diab.35.6.668 |
| [46] |
O.E. Owen, V.E. Trapp, C.L. Skutches, et al., Diabetes 31 (1982) 242-248. DOI:10.2337/diab.31.3.242 |
| [47] |
L. Wang, A. Teleki, S.E. Pratsinis, P.I. Gouma, Chem. Mater. 20 (2008) 4794-4796. DOI:10.1021/cm800761e |
| [48] |
S.J. Choi, B.H. Jang, S.J. Lee, et al., ACS Appl. Mater. Interfaces 6 (2014) 2588-2597. DOI:10.1021/am405088q |
| [49] |
Q. Xu, Y. Liu, R. Su, et al., Nanoscale 8 (2016) 17919-17928. DOI:10.1039/C6NR05434J |