 2020, Vol. 31


Ion transport across cell membranes plays an important role in maintaining a number of cellular functions [1-4]. Ionophore can facilitate the transmembrane transport of ions driven by the ion concentration gradient [5, 6]. Valinomycin (VM) is an antimicrobial peptide as well as a K+ ionophore, which has been widely used as the model to investigate the selectivity and mechanism of transmem-brane transport assisted by ionophore [7, 8]. However, most studies regarding ionophore mediated ion transmembrane transport focused on artificial liquid-liquid interfaces and were investigated by conventional electrochemical approaches, which cannot provide in-depth information about the kinetic mechanism of the assisted ion transport across lipid bilayers [9-11]. It thus remains a huge challenge to discriminate and analyze the kinetics of the elemental steps in this process [12]. Revealing the mechanism of ion transport across lipid bilayers facilitated by ionophore at molecular levels will offer profound insights into controlled ion transport.
Attenuated total reflection surface enhanced infrared absorp-tion spectroscopy (ATR-SEIRAS) is an ultrasensitive surface analytical tool for label-free bioanalysis at the solid-liquid interface [13]. SEIRA is a phenomenon that IR signals of the target molecules adsorbed on a nanostructured metal film can be enhanced by 10-1000 times [14, 15]. We have previously cast an Au nanostruc-ture onto a hemispherical ZnSe prism as the enhancement substrate by chemical deposition method. The resulting gold nanostructure can significantly improve the sensitivity of ATR-SEIRAS to sub-monolayer level [16]. Under ATR mode, as the signal interference from the bulk solution is greatly reduced, ATR-SEIRAS can effectively reveal the structure and function information of biomolecules on the interface [17, 18].
In the present communication, we investigate the kinetics of K+ transmembrane transport facilitated by VM using ATR-SEIRAS (Scheme 1). We assemble a mixed monolayer consisted of amphiphiles with different chain lengths onto the Au nanostruc-tured film deposited on a ZnSe prism (Au-ZnSe). VM-anchored supported-lipid bilayers (SLBs) are then constructed onto the mixed monolayer. Both sides of SLBs are immersed in aqueous solution to mimic the actual environment of cell membrane. The structural changes of VM and ion exchange on the surface during the assisted ion transport across SLBs are monitored by ATR-SEIRAS in situ [19]. We find that the ion transmembrane transport consists of two steps starting with the formation of K+-VM complex followed by its diffusion within SLBs. From the evolution of ATR-SEIRAS as a function of time, the kinetics of ion transmembrane transport across SLBs can be extracted. The results demonstrate that ATR-SEIRAS has tremendous advantages and prospects in revealing the interaction mechanism of biomolecules on the interface by virtue of its ability to acquire molecular fingerprint information with high sensitivity.

|
Download:
|
| Scheme 1. Schematic illustration of VM facilitating K+ to transport across a supported lipid bilayer on an Au-ZnSe as monitored by ATR-SEIRAS in situ. | |
A gold nanostructure film was prepared onto a ZnSe prism by chemical deposition as reported previously [16]. Afterwards, a mixed monolayer of 1, 2-dipalmitoyl-sn-glycero-3-phospho-thioethanol (DPPT) and mercaptohexanol (MCH) at a ratio of 1:1 was self-assembled onto the gold film. Liposomes composed of 1, 2-dioleoyl-sn-glycero-3-phosphocholine (DOPC) and VM were added onto the mixed monolayer to form a VM-anchored SLBs by liposomes spread and fusion [20]. DPPT has a long chain ended with hydrophobic choline group, which can insert into the lipid bilayers through the hydrophobic interactions with the hydrocar-bon chains of lipids; While MCH has a shorter molecular length with hydroxyl groups at its tail, providing a hydrophilic region between SLBs and Au-ZnSe [21]. This hydrophilic region acts as a reservoir for ion re-hydration to transport across the lipid bilayers [22]. Fig. 1a shows the SEIRAS from DPPT/MCH monolayer (0.1 mol/L BaCl2). A pair of peaks between 3000-2800 cm-1 assigning to the CH2 symmetric and anti-symmetric stretching of DPPT can be observed. Another peak at 1741 cm-1 is attributed to the C=O stretching of DPPT [23]. As the assembly of DPPT/MCH monolayer replaces the water molecules from the gold film surface, the infrared signal of hydroxyl groups in MCH is embedded in a prominent negative peak of water molecules around 3400 cm-1. The mixed monolayer in 0.1 mol/L BaCl2 was taken as the reference to monitor the formation of VM-anchored SLBs. The two peaks of -CH2 stretching of DOPC appear between 3000-2800 cm-1. The presence of VM is evidenced by the peaks located at 1665 and 1532 cm-1 assigning to the amide I and amide Ⅱ modes of peptide, respectively (Fig. 1b) [24, 25]. In addition, the peak at 1757 cm-1 is attributed to the ester C=O stretching of VM. According to the atomic force microscopic analysis, the surface roughness of the Au-ZnSe, mixed monolayer/Au-ZnSe and SLBs are 35.42 nm, 848.62 nm and 48.33 nm, respectively (Fig. S1 in Supporting information). The increased surface roughness of the mixed monolayer is largely due to the great difference of molecular length between DPPT and MCH. After the formation of SLBs on the mixed monolayer, the surface roughness decreases indicating the ordered arrangement of lipid bilayer. These results reveal that we have successfully casted a VM-anchored SLBs onto the mixed monolayer on Au-ZnSe.

|
Download:
|
| Fig. 1. (a) ATR-SEIRAS of the modification of DPPT/MCH monolayer onto an Au-ZnSe. The bare Au-ZnSe substrate was recorded as reference. (b) ATR-SEIRAS of the construction of VM-anchored SLBs onto the DPPT/MCH monolayer on Au-ZnSe, taken the DPPT/MCH monolayer as reference. | |
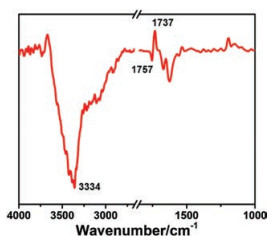
VM is a natural cyclodepsipeptide that can selectively transport K+ across cell membrane [26]. We used ATR-SEIRAS to investigate the kinetics of K+ transport facilitated by VM. The spectrum of VM-anchored SLBs in 0.1 mol/L BaCl2 was recorded as the reference. After the addition of 0.1 mol/L KCl, a series of spectra were collected until the spectrum reaches equilibrium at about 1 h. A negative peak can be observed at 1757 cm-1 concomitant with the appearance of a positive peak at 1737 cm-1 (Fig. 2). As VM complexes with K+, the ester carbonyls of VM coordinate a potassium atom, which would decrease the electron density of the ester carbonyls of VM and in turn induce the shift of the peak from 1757 cm-1 to 1737 cm-1 [27]. Therefore, the peak at 1737 cm-1 indicates the association of VM with K+. Besides, a remarkable negative peak appears at 3334 cm-1, which is attributed to the -OH stretching mode of water molecules within the evanescent region of the electric field.

|
Download:
|
| Fig. 2. ATR-SEIRAS of the VM-anchored SLBs after the addition of 0.1 mol/L KCl aqueous solution, taken the spectrum in 0.1 mol/L BaCl2 as the reference. | |
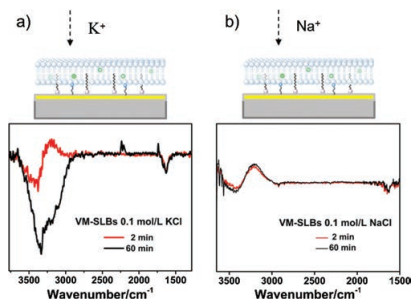
We then analyzed the cause of the peak at 3334 cm-1. After addition of 0.1 mol/L KCl to the VM-anchored SLBs in 0.1 mol/L BaCl2 for 2 min, a pair of bipolar peaks appears at 3600-3000 cm-1 accompanied with a negative peak at 3380 cm-1 and a positive peak at 3200 cm-1. The bipolar peaks gradually decrease while a negative peak at 3334 cm-1 appears and increases over time until it reaches steady-state at about 1 h (Fig. 3a). To clarify this phenomenon, 0.1 mol/L NaCl was added to the VM-anchored SLBs as a control experiment (Fig. 3b). The biopolar peaks appear at the same wavenumbers. It is noteworthy that the spectrum reaches steady-state quickly within 2 min. When 0.1 mol/L KCl was added to the SLBs without VM, the biopolar peaks can be observed without the appearance of amide peaks, which is consistent with spectrum of VM-SLBs in the presence of 0.1 mol/L NaCl (Fig. S2 in Supporting information). As in the case of Na+, K+ without the mediation of VM cannot transport across the nonpolar interior of SLBs, and thus these ions can only diffuse to the surface of SLBs upon the addition of monovalent cations. Therefore, it is reasonable to suggest that the biopolar peaks are derived from the entering of K+ ions to the outer surface of SLBs. The positive band at 3200 cm-1 can be ascribed to the IR absorption of the water molecules associated by K+ ions [28]. Due to the rapid process of ion exchange on the outer surface, the biopolar peaks reach steadystate very quickly. In the presence of VM, K+ ions are able to penetrate the SLBs and reach to the gold film after rehydration, which will certainly consume the bulk water molecules within the region between SLBs and Au-ZnSe, inducing the negative peak at 3334 cm-1. As the process of assisted ion transport is relatively slow, the peak at 3334 cm-1 reaches steady-state at about 60 min. Taken together, the negative peak at 3334 cm-1 is relating to the process of ion transmembrane transport.

|
Download:
|
| Fig. 3. ATR-SEIRAS of the VM-anchored SLBs on Au-ZnSe after the addition of (a) 0.1 mol/L KCl and (b) 0.1 mol/L NaCl on the VM-anchored SLBs. | |
The transmembrane transport of K+ facilitated by VM is consisted of two step: The K+ ion transmembrane transport starts with its association/disassociation to VM; The second step is the transfer of the complexation within SLBs (Fig. 4a). As the peaks at 1737 and 3334 cm-1 are relating to the association/disassociation and the transfer of the complexation processes, respectively, the kinetics of these two processes can be obtained by monitoring the peaks intensities at 1737 and 3334 cm-1 versus time (Fig. 4b). The fitting results show that the kinetic constant of step 1 is 2 times larger than the one of step 2 (marked in Fig. 4b). Therefore, the complex transfer across the lipid bilayer is the rate-determining step of ion transmembrane transport facilitated by ionophore.

|
Download:
|
| Fig. 4. (a) Schematic illustration of the ion transmembrane transport facilitated by VM. (b) Intensity of peaks at 1737 and 3334 cm-1 as function of time. | |
In summary, we have successfully constructed a supported lipid bilayer onto the Au-ZnSe in aqueous solution as an appropriate model of cell-membrane. The kinetics of ion transmembrane transport facilitated by VM can be monitored by ATR-SEIRAS in situ. Results show that the transfer across the lipid bilayers of K+-VM complexes is the rate-determining step for the ionophore facilitated ion transport. The present work demonstrates that ATR-SEIRAS is an ultrasensitive surface analysis technique to reveal the mechanism underlying life activities, which is of great importance in the biological interface analysis.
AcknowledgmentsThis work was supported by grants from the National Key R & D Program of China (No. 2017YFA0700500), and the National Natural Science Foundation of China (No. 21635004).
Appendix A. Supplementary dataSupplementarymaterial related to this article canbefound, in the online version, at doi:https://doi.org/10.1016/j.cclet.2019.08.009.
| [1] |
M.P. Blaustein, Am. J. Pysiol. 232 (1977) C165-C173. DOI:10.1152/ajpcell.1977.232.5.C165 |
| [2] |
J. Liao, H. Li, W. Zeng, et al., Science 335 (2012) 686-690. DOI:10.1126/science.1215759 |
| [3] |
A. Becchetti, Am.J. Physiol, Cell Physiol. 301 (2011) C255-C265. DOI:10.1152/ajpcell.00047.2011 |
| [4] |
J.R. Erickson, M.L. Joiner, X. Guan, et al., Cell 133 (2008) 462-474. DOI:10.1016/j.cell.2008.02.048 |
| [5] |
Y. Li, S. Wang, G. He, et al., Chem. Soc. Rev. 44 (2015) 103-118. DOI:10.1039/C4CS00215F |
| [6] |
M.R. Pourjavid, T. Razavi, Chin. Chem. Lett. 23 (2012) 343-346. DOI:10.1016/j.cclet.2011.12.006 |
| [7] |
S.K. Berezin, J. Membrane Biol. 248 (2015) 713-726. DOI:10.1007/s00232-015-9784-y |
| [8] |
L.K. Steinrauf, J.A. Hamilton, M.N. Sabesan, J. Am. Chem. Soc. 104 (1982) 4085-4091. DOI:10.1021/ja00379a008 |
| [9] |
L. Becucci, M.R. Moncelli, R. Naumann, R. Guidelli, J. Am. Chem. Soc. 127 (2005) 13316-13323. DOI:10.1021/ja052920t |
| [10] |
H.X. Wang, Z.N. Yan, X.L. Wen, et al., Chin. Chem. Lett. 26 (2015) 1147-1149. DOI:10.1016/j.cclet.2015.04.036 |
| [11] |
R. Ishimatsu, A. Izadyar, B. Kabagambe, et al., J. Am. Chem. Soc. 133 (2011) 16300-16308. DOI:10.1021/ja207297q |
| [12] |
R. Naumann, D. Walz, S.M. Schiller, W. Knoll, J. Electroanal. Chem. 550-551 (2003) 241-252. DOI:10.1016/S0022-0728(03)00013-5 |
| [13] |
Q. Shen, Y.J. Fan, W.M. Zhang, et al., Chin. Chem. Lett. 26 (2015) 193-196. DOI:10.1016/j.cclet.2014.07.003 |
| [14] |
R. Adato, H. Altug, Nat. Commun. 4 (2013) 2154. DOI:10.1038/ncomms3154 |
| [15] |
A. Kinkhabwala, Z. Yu, S. Fan, et al., Nat. Photonics 3 (2009) 654-657. DOI:10.1038/nphoton.2009.187 |
| [16] |
W.J. Bao, J. Li, J. Li, et al., Anal. Chem. 90 (2018) 3842-3848. DOI:10.1021/acs.analchem.7b04505 |
| [17] |
M. Iwaki, N.P. Cotton, P.G. Quirk, P.R. Rich, J.B. Jackson, J. Am. Chem. Soc. 128 (2006) 2621-2629. DOI:10.1021/ja0556272 |
| [18] |
W.J. Bao, Z.D. Yan, M. Wang, et al., Chem. Commun. 50 (2014) 7787-7789. DOI:10.1039/c4cc01920b |
| [19] |
J. Kozuch, C. Steinem, P. Hildebrandt, D. Millo, Angew. Chem. Int. Ed. 51 (2012) 8114-8117. DOI:10.1002/anie.201203214 |
| [20] |
J.A. Jackman, S.R. Tabaei, Z. Zhao, S. Yorulmaz, N.J. Cho, ACS Appl. Mater. Inter. 7 (2015) 959-968. DOI:10.1021/am507651h |
| [21] |
P. Théato, R. Zentel, Langmuir 16 (2000) 1801-1805. DOI:10.1021/la990292l |
| [22] |
G. Krishna, J. Schulte, B.A. Cornell, R.J. Pace, P.D. Osman, Langmuir 19 (2003) 2294-2305. DOI:10.1021/la026238d |
| [23] |
L.K. Tamm, S.A. Tatulian, Q. Rev. Biophys. 30 (1997) 365-429. DOI:10.1017/S0033583597003375 |
| [24] |
X. Jiang, M. Engelhard, K. Ataka, J. Heberle, J. Am. Chem. Soc. 132 (2010) 10808-10815. DOI:10.1021/ja102295g |
| [25] |
A. Barth, BBABiomembranes 1767 (2007) 1073-1101. DOI:10.1016/j.bbamem.2007.01.013 |
| [26] |
X. Wu, W. Luke Judd, N.W. Ethan Howe, et al., Chem 1 (2016) 127-146. DOI:10.1016/j.chempr.2016.04.002 |
| [27] |
V.A. Howarth, M.C. Petty, Langmuir 5 (1989) 330-332. DOI:10.1021/la00086a006 |
| [28] |
N. Agmon, Nat. Chem. 8 (2016) 206-207. DOI:10.1038/nchem.2465 |