 2020, Vol. 31


b Peking-Tsinghua Center for Life Sciences, PKU-IDG/McGovern Institute for Brain Research, Academy for Advanced Interdisciplinary Studies, Peking University, Beijing 100871, China;
c State Key Laboratory of Membrane Biology, Beijing Key Laboratory of Cardiometabolic Molecular Medicine, Institute of Molecular Medicine, Peking University, Beijing 100871, China
Zinc (Zn2+) plays a pivotal role in many fundamental cellular processes. Zinc homeostasis is coordinated by zinc import, export and distribution. Both free and chelated zinc are stored in different intracellular spaces, forming a dynamic pool of coordination and interactions. Some selectively targeted genetically encoded sensors revealed the heterogeneous distribution of zinc in the cytoplasm, nucleus and most organelles, including the endoplas-mic reticulum, Golgi apparatus and mitochondria [1, 2]. Compared to other cell types, pancreatic beta cells contain exceptionally high zinc content; specifically, the insulin-storing vesicle may contain up to 70% of the total beta-cell zinc, the major stored form of which is zinc-insulin crystals with a molecular ratio of 2:6 [3]. By quantitative electron probe microanalysis of thin, dried cryosec-tions of individual secretory vesicles, Foster and his colleagues found that the beta-cell zinc concentration in dense-core vesicles reached the 10-2 mol/L range [4]. However, Foster's study simply evaluated whole vesicles. Subsequent further examination of the structure of the vesicles under an electron microscope showed that the membrane-bound vesicle consists of two parts: a dense core with zinc-insulin crystals and a lumen with free zinc [5]. Therefore, it is more accurate to measure the free zinc concentration of vesicles rather than zinc as a whole. Merkx's lab made the first attempt to solve this problem by focusing on the free zinc in the insulin-storing vesicles of INS-1 cells (a rat insulinoma cell line) [6]. The authors fused their eCALWY sensor to vesicle-associated membrane protein 2 (VAMP-2) and then expressed the sensors in insulin-storing vesicles. They estimated that the free zinc concentration in INS-1 cell vesicles was between 1 μmol/L and 100 μmol/L. However, there are still intrinsic differences between INS-1 and primary beta cells; for instance, the total insulin content of INS-1 cells is only 20% of that of primary beta cells [7]. In addition, INS-1 cells must be cultured in medium containing mercaptoethanol, which might denature the proteins and degrade insulin [7]. Further examination of this topic indicated that free zinc homeostasis in vesicles has a decisive effect on the formation of mature dense-core vesicles (DCVs) because preventing the influx of free zinc into vesicles leads to the deformation and decompression of the dense core [8]. Moreover, there is clear evidence that zinc deficiency coexists with type 2 diabetes, as supported by mouse models and patient studies [9, 10]. Application of fluorescence imaging technologies helps in the elucidation of the disease states with a simple and rapid response [11]. A deeper understanding of the role of Zn2+ ions in cell signaling requires the development of sensitive and non-invasive sensors that provide both spatial and temporal resolution [12]. Additionally, the dissociation constants (Kd) of some available FRET-based sensors range from 10-12 mol/L to 10-6 mol/L, which is insufficient to accurately estimate the free zinc concentration in insulin-containing secretory vesicles [13-15].
The concentration of free zinc within normal and diabetic primary beta-cell insulin-storing vesicles still requires accurate measurement. To meet the need of measurement, we sought to prepare a genetically encoded zinc sensor with a zinc-binding motif whose conformation changes before and after zinc binding. The RING motif is a zinc-binding domain and changes conformation upon zinc binding [16, 17]. Here, we carefully selected a RING motif from human TRIM72 (MG53). Considering the brightness of the fluorescent proteins and FRET efficiency, we chose a FRET pair; the green fluorescent protein mNeon-Green (mNeon) and the red fluorescent protein mRuby2 were fused to the N terminus and the C terminus of the RING motif, respectively [18, 19]. We used flexible amino acid residues (GGS & SAA) as linkers between the fluorescent proteins and the RING motif (Fig. 1A, Table S1 in Supporting information). The biosensor based on the RING motif of TRIM72 is referred to as ZnT72R.

|
Download:
|
| Fig. 1. In vitro measurements of the Zn2+ sensor ZnT72R: (A) Schematic view of ZnT72R; (B) Emission spectrum of ZnT72R with and without incubation with 100 μmol/L Zn2+; (C) Response of ZnT72R to 100 μmol/L different cations. The responses (∆R/R) were normalized to the ∆R/R value of 100 μmol/L Zn2+ in 20 mmol/L HEPES buffer (pH 7.4). n = 3 per group. (D-F) In vitro calibration of the Kd value of ZnT72R. Purified ZnT72R protein was incubated with different concentrations of Zn2+ (0, 2, 4, 5, 6, 8, 10, 12, 14, 15, 16, 18, 20, 25, 30, 35, 40, 45, 50, 60, 70, 80, 90 and 100 μmol/L) at room temperature for 30 min. The solid curve is the fit to the data with the indicated parameters. n = 3 per data point. | |
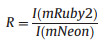
After expression and purification of the ZnT72R biosensor in E. coli, we tested the response of the ZnT72R biosensor to 100 μmol/L Zn2+. With an excitation wavelength of 480 nm, we characterized the emission spectrum of ZnT72R at wavelengths from 500 nm to 650 nm. We found a fluorescence decrease in mNeon at a wavelength of 517 nm and a fluorescence increase in mRuby2 at 584 nm (Fig. 1B). Then, we determined the response of the biosensor ZnT72R to different cations at a concentration of 100 μmol/L. With an excitation wavelength of 480 nm, we measured the fluorescence intensity at 535 nm, recorded as I(mNeon), and 595 nm, recorded as I(mRuby2). The FRET ratio (R) was calculated as Eq. (1).
|
(1) |
Then, we calculated ∆R/R [∆R/R = (R-R0)/R] to determine the responses to different cations; in this equation, R represents the measured FRET ratio at a concentration of 100 μmol/L for different cations, and R0 (baseline) represents the measured FRET ratio of the apo form of the sensor. Finally, we normalized the responses to the response of Zn2+. As shown in Fig. 1C, the biosensor displayed a specific response to zinc rather than to other cations.
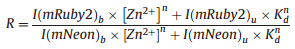
According to previous reports, the pH in beta-cell insulin-storing vesicles varies from 5.5 to 7.5 [20], so we measured the response of ZnT72R to different zinc concentrations in different buffer solutions at different pH values. We chose 20 mmol/L MES buffer at pH values of 6.0 and 6.5 and 20 mmol/L HEPES buffer at a pH value of 7.4. Then, we fitted the FRET ratio (R) and zinc concentration ([Zn2+]) to Eq. (2) [21], in which I(mRuby2)b represents the fluorescence intensity at 595 nm of the bound sensor, I(mRuby2)u represents the fluorescence intensity at 595 nm of the unbound sensor, I(mNeon)b represents the fluorescence intensity at 535 nm of the bound sensor, I(mNeon)u represents the fluorescence intensity at 535 nm of the unbound sensor, the constant n represents Hill's coefficient, and the constant Kd represents the dissociation constant of the biosensor from zinc.
|
(2) |
The fitting results indicated that the ZnT72R biosensor showed an affinity for zinc with a Kd of 6.80±0.39 μmol/L and a Hill coefficient (n) of 2.33±0.22 at a pH of 6.0 (Fig. 1D), a Kd of 6.07±0.28 μmol/L and a Hill coefficient (n) of 1.95±0.13 at a pH of 6.5 (Fig. 1E) and a Kd of 7.84±0.42 μmol/L and a Hill coefficient (n) of 2.06±0.17 at a pH of 7.4 (Fig. 1F).
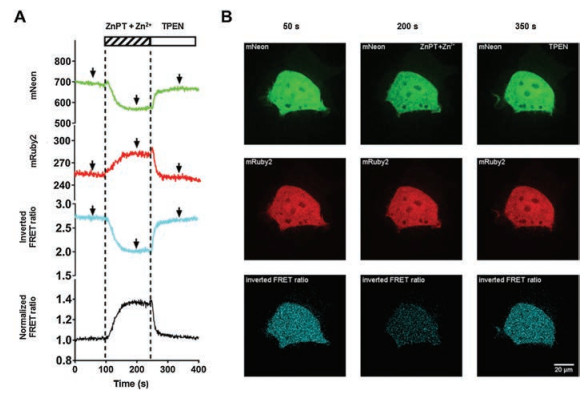
To further verify the effects of this biosensor in living cells, we next expressed ZnT72R in the cytosol of HEK293 T cells. We observed an increase in ∆R/R in cells expressing ZnT72R after adding a saturating concentration of the zinc ionophore pyrithione (Zn2+-pyrithione, solubility in water is 25.2 μmol/L at pH 7.0) and 400 μmol/L zinc, indicative of an increase in cytosolic zinc. Subsequently, the FRET ratio decreased to the baseline value (R0) after the addition of the membrane-permeant zinc chelator N, N, N', N'-tetrakis(2-pyridylmethyl)ethylenediamine (TPEN), indicative of a decrease in cytosolic zinc (Figs. 2A and B, Movie S1 and Fig. S1 in Supporting information). The data show that TPEN is highly capable of chelating zinc to reach the baseline level at the start of the assay.

|
Download:
|
| Fig. 2. Determination of the cytosolic free Zn2+ concentration in HEK293 T cells using ZnT72R: (A) Responses of a single cell expressing ZnT72R to perfusion, first with saturating Zn2+-pyrithione (ZnPT) and 400 μmol/L Zn2+ to increase the intracellular Zn2+ and subsequently with TPEN to chelate intracellular Zn2+. The time-lapse fluorescence intensity values were recorded in the mNeon channel (green line) and mRuby2 channel (red line). The cyan line denotes the fluorescence intensity ratio between the mNeon channel and the mRuby2 channel (inverted FRET ratio, to show a contrasting video of the FRET ratio). The black line denotes the normalized FRET ratio change, represented as the ratio over the baseline (average value of the ratio from 0 to 100 s). The time interval is 1 s. These traces are representative of 20 recordings from similar experiments; (B) A single HEK293 T cell was imaged at 50 s, 200 s and 350 s; These time points correspond to the arrows in (A). Scale bar: 20 μm. | |
To assess the performance of ZnT72R in living cells, we used a previous method [22] to measure the fluorescence change in HEK293 T cells when zinc was added at various concentrations from 0 to 400 μmol/L with saponin at a pH of 6.0 and without pyrithione (Figs. 3A and B). We used 0.001% (w/v) saponin permeabilization to determine the Kd of ZnT72R in living cells. A similar result was obtained by using another perforating agent, digitonin (Fig. S2 in Supporting information). The maximum changes in the normalized ratio value over R0 were recorded. Fitting the FRET ratios to Eq. (2) yielded a Kd of 55.56 ± 4.59 μmol/L and a Hill coefficient (n) of 1.30 ± 0.13 (Fig. 3C), close to the values observed in vitro. Thus, we succeeded in creating a novel zinc FRET biosensor to detect free zinc in the 10-5 mol/L concentration range.

|
Download:
|
| Fig. 3. In situ calibration of the Kd value of ZnT72R: (A) Saponin-permeabilized, biosensor-expressing HEK293 T cells were exposed to an intracellular solution containing the indicated Zn2+ concentration. The black line denotes the normalized FRET ratio change, represented as the ratio over the baseline (average value of the ratio from 0 to 140 s); (B) The representative traces present the different concentrations of Zn2+, as indicated, with the same normalized method in (A); (C) The FRET ratio was measured at 0, 8, 20, 50, 75, 100, 120, 150, 200, 300 and 400 μmol/L Zn2+. The solid curve is a non-linear fit to the data with the indicated parameters. n = 17-23 per data point. | |
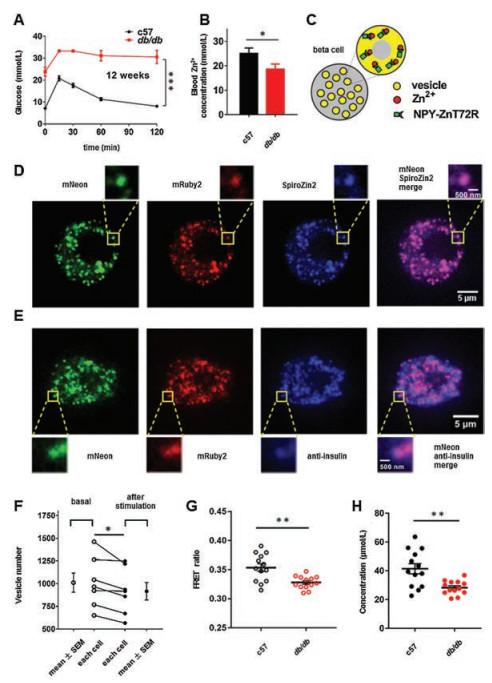
Considering the zinc deficiencies in the pancreas and blood in the diabetic mouse model [9], we hypothesized that diabetic betacell vesicles also have a free zinc deficiency. Twelve-week-old db/db mice with severe hyperglycemia were chosen as a zinc deficiency model (Fig. 4A). Blood zinc was collected and measured to verify the zinc deficiency in nonfasted db/db mice (Fig. 4B). Next, we attempted to target ZnT72R to the insulin vesicles of beta cells by fusing them to neuropeptide Y (NPY) (Fig. 4C), which was previously expressed well in primary beta-cell DCVs [23]. Then, we constructed an adenovirus expressing NPY-ZnT72R. After loading adenovirus-infected beta cells with SpiroZin2, a zinc dye with a "nmol/L"-range Kd [24], colocalization of the NPY-ZnT72R-and SpiroZin2-labeled DCVs was quantified by the Pearson correlation coefficient (PCC). In living beta cells, we saw good colocalization between NPY-ZnT72R and SpiroZin2 (PCC was 0.84 ± 0.04, Fig. 4D). NPY-ZnT72R also strikingly colocalized with immunostained insulin in fixed beta cells (PCC was 0.86 ± 0.01, Fig. 4E), implying that NPY-ZnT72R was expressed in insulin-storing vesicles. To further demonstrate that the NPY-ZnT72R-labeled vesicles were functional, we captured z-stack images of beta cells under a spinning disk confocal microscope (Movie S2 in Supporting information) and counted the whole vesicle number of each beta cell before and after stimulation by 20 mmol/L glucose and 70 mmol/L KCl (Fig. S3 in Supporting information). The average number of vesicles decreased significantly from 1011.00 ± 105.40 to 916.30 ± 95.97 (Fig. 4F), which showed their secretion ability. Considering that the Kd in Fig. 3 was calculated at a pH of 6.0 (the average pH of vesicles [20]), FRET ratios were measured and calculated by a vesicle titration assay described in the Methods and Materials section (Supporting information). Based on Eq. (2), the free zinc concentration of vesicles was quantified in Figs. 4G and H. Significantly, the free zinc concentration in the beta-cell vesicles of 12-week-old db/db mice was lower than that in the beta-cell secretory vesicles of age-matched control mice (28.30 ± 1.33 μmol/L in db/db mice vs. 41.46 ± 3.53 μmol/L in control mice, Fig. 4G).

|
Download:
|
| Fig. 4. Zinc deficiency in insulin-storing vesicles of db/db mice: (A) Glucose tolerance test of 12-week-old c57 and db/db mice. n = 6 per group; (B) Blood was collected for zinc measurements from mice that had free access to food and drinking water. n = 6 per group; (C) Schematic diagram of ZnT72R in insulin-storing vesicles; (D) Colocalization of ZnT72R and SpiroZin2 in living beta cells. n = 10, cells from 3 independent mouse preparations; (E) Colocalization of ZnT72R and anti-insulin antibody in fixed beta cells. n = 10, cells from 3 independent mouse preparations. Scale bar: 5 μm for the whole beta-cell photograph, 500 nm for the single zoomed-in vesicle; (F) The whole vesicle number of each beta cell before (basal) and after stimulation by high-potassium, high-glucose extracellular solution. n = 7, cells from 2 independent mouse preparations; (G) FRET ratios. A dot plot with a single dot representing a single cell was used to display a ratio; (H) Free zinc concentrations. n = 13 for both c57 and db/db mice, cells from 5 independent mouse preparations per group. | |
To compare ZnT72R with other sensors and show its advantages, we summarized the sensor characteristics as shown in Table S2 (Supporting information). Recently, eZinCh-2 was used to measure Zn2+ in the cytosol, ER, mitochondria, and secretory vesicles [25, 26]. The authors targeted the eZinCh-2 to insulin vesicles in INS-1 cells by fusion of the sensor to VAMP-2 and reported that the sensor was approximately 30% zinc bound, which, assuming a pH of 6.0, would represent a free zinc concentration of 120 nmol/L [25]. Although eZinCh-2 (Kd =256 nmol/L at pH 6.0) is an attractive FRET-based zinc sensor, the difference between the primary cell and the cell line needs to be taken into consideration [7]. FluoZin-1 AM [27] and Zinpyr-1 [28] show pH sensitivity in the 5.5–7.5 range, which might contribute to mismeasurement in acidic vesicles. Furthermore, for Zinpyr-1, SpiroZin2, ZifCY1 [13] and eCALWY-1 [6], the Kd is also inadequate for determining the free zinc concentration in insulinstoring vesicles. In addition, FluoZin-3 AM often accumulates in acidic vesicles, including insulin-storing vesicles. However, it also accumulates in other organelles, such as lysosomes [29]. Therefore, FluoZin-3 AM is not exclusively found in insulin-storing vesicles, which could complicate use of this dye for quantification of Zn2+. Besides, it was reported that the green fluorescent protein mNeonGreen has an advantage in brightness compared with other green fluorescent proteins, and the mNeonGreen-mRuby2 FRET pair shows improved FRET efficiency compared with common FRET pairs.
In summary, we developed a genetically encoded FRET-based zinc sensor that was used to image high concentrations of free zinc in single beta-cell insulin-storing vesicles. We found that the free zinc concentration in the beta-cell insulin-storing vesicles of 12-week-old db/db mice was only two thirds that of the concentration in the beta-cell insulin-storing vesicles of control mice. This method can be widely used to monitor the dynamic zinc progression in diabetes at multiple time points in various models. The future goal of our group would be to spur the development of a novel diagnostic strategy for zinc-deficiency disease and enable more holistic prevention and treatment regimens.
AcknowledgmentsWe thank Prof. Yi Rao and Prof. Liangyi Chen for their comments on the manuscript. We also thank Prof. Peng R. Chen for offering the PML plasmid and his advice on the design of sensors.
This study was supported by a China Postdoctoral Science Foundation-funded project (No. 2017M612440).
Appendix A. Supplementary dataSupplementarymaterial related to this article can befound, in the online version, at doi:https://doi.org/10.1016/j.cclet.2019.08.012.
| [1] |
E. Tomat, S.J. Lippard, Curr. Opin. Chem. Biol. 14 (2010) 225-230. DOI:10.1016/j.cbpa.2009.12.010 |
| [2] |
K.P. Carter, A.M. Young, A.E. Palmer, Chem. Rev. 114 (2014) 4564-4601. DOI:10.1021/cr400546e |
| [3] |
H.W. Davidson, J.M. Wenzlau, R.M. O'Brien, Trends Endocrinol. Metab. 25 (2014) 415-424. DOI:10.1016/j.tem.2014.03.008 |
| [4] |
M.C. Foster, R.D. Leapman, M.X. Li, I. Atwater, Biophys. J. 64 (1993) 525-532. DOI:10.1016/S0006-3495(93)81397-3 |
| [5] |
J. Suckale, M. Solimena, Trends Endocrinol. Metab. 21 (2010) 599-609. DOI:10.1016/j.tem.2010.06.003 |
| [6] |
J.L. Vinkenborg, T.J. Nicolson, E.A. Bellomo, et al., Nat. Methods 6 (2009) 737-740. DOI:10.1038/nmeth.1368 |
| [7] |
M. Asfari, D. Janjic, P. Meda, et al., Endocrinology 130 (1992) 167-178. DOI:10.1210/endo.130.1.1370150 |
| [8] |
A.B. Hardy, A.S. Serino, N. Wijesekara, F. Chimienti, M.B. Wheeler, Diabetes Obes. Metab. 13 (2011) 112-117. DOI:10.1111/j.1463-1326.2011.01451.x |
| [9] |
S.F. Simon, C.G. Taylor, Exp. Biol. Med. 226 (2001) 43-51. DOI:10.1177/153537020122600107 |
| [10] |
R.A. Al-Maroof, S.S. Al-Sharbatti, Saudi Med. J. 27 (2006) 344-350. DOI:10.1016/S0248-8663(06)80006-8 |
| [11] |
L. Yu, Y. Qiao, L. Miao, Y. He, Y. Zhou, Chin. Chem. Lett. 29 (2018) 1545-1559. DOI:10.1016/j.cclet.2018.09.005 |
| [12] |
P. Chabosseau, J. Woodier, R. Cheung, G.A. Rutter, Metallomics 10 (2018) 229-239. DOI:10.1039/C7MT00336F |
| [13] |
P.J. Dittmer, J.G. Miranda, J.A. Gorski, A.E. Palmer, J. Biol. Chem. 284 (2009) 16289-16297. DOI:10.1074/jbc.M900501200 |
| [14] |
Y. Qin, P.J. Dittmer, J.G. Park, K.B. Jansen, A.E. Palmer, Proc. Natl. Acad. Sci. U. S. A. 108 (2011) 7351-7356. DOI:10.1073/pnas.1015686108 |
| [15] |
J.G. Miranda, A.L. Weaver, Y. Qin, et al., PLoS One 7 (2012) e49371. DOI:10.1371/journal.pone.0049371 |
| [16] |
K.L. Borden, M.N. Boddy, J. Lally, et al., EMBO J. 14 (1995) 1532-1541. DOI:10.1002/j.1460-2075.1995.tb07139.x |
| [17] |
S.Y. Huang, C.F. Chang, P.J. Fang, et al., J. Biomol. NMR 61 (2015) 173-180. DOI:10.1007/s10858-015-9901-3 |
| [18] |
C.D. Krause, G. Digioia, L.S. Izotova, S. Pestka, Cytokine 64 (2013) 272-285. DOI:10.1016/j.cyto.2013.05.026 |
| [19] |
N.C. Shaner, G.G. Lambert, A. Chammas, et al., Nat.Methods 10 (2013) 407-409. DOI:10.1038/nmeth.2413 |
| [20] |
T.J. Jentsch, V. Stein, F. Weinreich, A.A. Zdebik, Physiol. Rev. 82 (2002) 503-568. DOI:10.1152/physrev.00029.2001 |
| [21] |
A. Pomorski, T. Kochanczyk, A. Miloch, A. Krezel, Anal. Chem. 85 (2013) 11479-11486. DOI:10.1021/ac402637h |
| [22] |
W. Shang, F. Lu, T. Sun, et al., Circ. Res. 114 (2014) 412-420. DOI:10.1161/CIRCRESAHA.114.302938 |
| [23] |
F. Fan, C. Ji, Y. Wu, et al., J. Clin. Invest. 125 (2015) 4026-4041. DOI:10.1172/JCI80652 |
| [24] |
P. Rivera-Fuentes, A.T. Wrobel, M.L. Zastrow, et al., Chem. Sci. 6 (2015) 1944-1948. DOI:10.1039/C4SC03388D |
| [25] |
A.M. Hessels, P. Chabosseau, M.H. Bakker, et al., ACS Chem. Biol. 10 (2015) 2126-2134. DOI:10.1021/acschembio.5b00211 |
| [26] |
K.P. Carter, M.C. Carpenter, B. Fiedler, R. Jimenez, A.E. Palmer, Anal. Chem. 89 (2017) 9601-9608. DOI:10.1021/acs.analchem.7b02933 |
| [27] |
K.R. Gee, Z.L. Zhou, D. Ton-That, S.L. Sensi, J.H. Weiss, Cell Calcium 31 (2002) 245-251. DOI:10.1016/S0143-4160(02)00053-2 |
| [28] |
G.K. Walkup, S.C. Burdette, S.J. Lippard, R.Y. Tsien, J. Am. Chem. Soc. 122 (2000) 5644-5645. DOI:10.1021/ja000868p |
| [29] |
Y. Han, J.M. Goldberg, S.J. Lippard, A.E. Palmer, Sci. Rep. 8 (2018) 15034. DOI:10.1038/s41598-018-33102-w |