 2020, Vol. 31


b Department of Applied Chemistry, School of science, Anhui Agricultural University, Hefei 230036, China;
c Institute of Physical Science and Information Technology, Anhui University, Hefei 230601, China
As a typical cellular lysosomal degradation pathway, autophagy is used by organisms to against diverse pathologies [1, 2]. Disorders of autophagy are linked to a variety of diseases, including infections [3], cancers [4], neurodegenerative diseases [5], aging [6] and heart disease [7, 8]. The detailed understanding and probing of the biological functions of autophagy rely on the analytical methods to sensitively detect autophagy. In these decades, transmission electron microscopy (TEM) [9], western blotting (Atg8/LC3) [10] and GFP-Atg8/LC3 fluorescence microscopy [11] have been widely used for monitoring autophagy, and have gained great progress. Nevertheless, these methods commonly suffer from the drawbacks such as time-consuming, high cost and lack of single-cell level resolution [12, 13].
Fluorescent probes have attracted much attention because of its obvious advantages [14-20]. Recently, two-photon fluorescent probe (TPFP) has become an attractive alternative to the aforementioned strategies [21, 22]. Despite the real-time ultrasen-sitive detection of autophagy, the low fluorescence intensity and the lack of clarity in imaging limit its practical application. As the strong fluorescence could efficiently enhance the light penetration depth into biological tissues [23-25] and reduce the perturbation by auto-fluorescence background of cell [26, 27], we sought to develop novel probe with strong fluorescence. The aim of this study is to achieve clear monitoring of the cellular autophagy in complex environment.
After rational structural design and synthesis, we reported herein a bright, lysosome-targeting, TPFP for real-time monitoring autophagy process. This probe (Lyso-OSC) comprises of the following key components: a lysosome-targeting morpholine group, a D-A type two-photon fluorophore constituted by 1-vinyl-4-methoxybenzene and morpholine, and a polarity sensing coumarin group (Scheme 1). Lyso-OSC exhibits high sensitivity to polarity changes, intense two-photon fluorescence (under low polar solvent), large two-photon absorption cross-section, and excellent tissue penetration depth of up to 150 μm.

|
Download:
|
| Scheme 1. The design of Lyso-OSC and its mechanism of real-time detecting autophagy. | |
Our group recently endeavoured to prepare two-photon fluorophore with the conjugated asymmetric structures, which showed excellent effective two-photon absorption cross-section and large Stokes shift. The idea of using 1-vinyl-4-methoxyben-zene group as donor in D-A type of fluorophore was inspired by the observation that the introduction of large conjugated system can enlarge the two-photon cross-section area of quinoline. Using 3-iodophenol as starting material, we obtained Lyso-OSC after 6 synthetic steps (Scheme S1 in Supporting information). We first tested its absorption and fluorescence spectra in different solvents to explore its optical response to the polarity change of solvent (Fig. S1 and Table S1 in Supporting information). As shown in Fig. S1a, the optical absorption of Lyso-OSC shows little dependency on the solvent polarity. By contrast, the fluorescence intensity of Lyso-OSC is highly sensitive to the polarity changes of solvents (Fig. S1b). Lyso-OSC is weakly fluorescent in water, while showed remarkably enhanced fluorescence in less-polar solvent, such as benzonitrile, tetrahydrofuran (THF) and 1, 4-dioxane. Meanwhile, a regular blue-shift of emission maximum (from 525 nm in water to 470 nm in THF and 450 nm in 1, 4-dioxane) and prolonged lifetime (Fig. S2 in Supporting information) were observed when decreasing the solvent polarity. The detailed procedures for synthesis of Lyso-OSC are given in Supporting information.
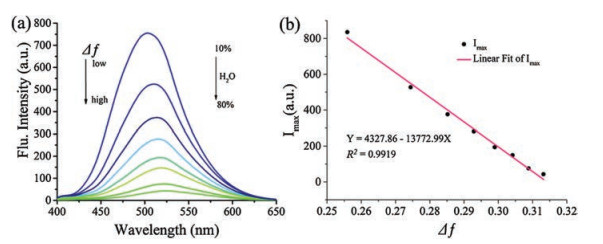
We verified the polarity sensitivity of fluorescence emission of Lyso-OSC in mixed solution of THF and H2O. Lippert Mataga polarity parameter Δf [28] was used to quantitatively describe the polarity of the solution. As shown in Fig. 1a, with the increased ratio of water from 10% (Δf ≈ 0.256) to 80% (Δf ≈ 0.313), the fluorescence intensity of Lyso-OSC reduced by about 16 times, accompanied with the red shift of the emission maximum. Meanwhile, similar to the aforementioned observations, the fluorescence intensity at emission maximum (Imax) shows linear correlation with Δf (Fig. 1b), demonstrating the ultra-sensitivity of Lyso-OSC probe to detect the polarity change of the solvent.

|
Download:
|
| Fig. 1. (a) The fluorescence spectra of Lyso-OSC (5.0 μmol/L) in THF-H2O mixture solvents (b) Linearity of Lyso-OSC (5.0 μmol/L) of Imax versus the polarity parameter of THF-H2O mixture solvent. | |
We further examined the effect of solvent polarity on fluorescence quantum yield and fluorescence lifetime of Lyso-OSC (Figs. S3 and S4, and Table S2 in Supporting information). When Δf of the THF/H2O system changed from 0.256 to 0.313, the fluorescence quantum yield of Lyso-OSC decreased from 51% to 10%, with a remarkable decrease in fluorescence lifetime from 2.54 ns to 1.42 ns. The fluorescence quantum yield and the fluorescence lifetime of Lyso-OSC were linear to the Δf of the THF/H2O system (Figs. S3 and S4b), reconfirming the sensitive response to solvent polarity. Of note, a similar polarity-dependent fluorescence changes (in intensity, emission maximum and linear correlation between Imax and polarity parameters) was also observed in MeOH-THF system (Fig. S5 and S6 in Supporting information).
The two-photon absorption cross section of the Lyso-OSC probe in THF-H2O system was examined by two-photon induced technique. As shown in Fig. 2a, Lyso-OSC shows a two-photon absorption cross-section of up to 250 GM in 10% water. Increasing the ratio of water to 80% resulted in a reduced two-photon absorption cross-section of Lyso-OSC to 45 GM. In addition, at the maximum excitation wavelength of 820 nm, we observed a square relationship between the two-photon excitation fluorescence intensity and the laser energy (0.2–0.8 W), indicating the two-photon absorption property of Lyso-OSC (Fig. 2b).

|
Download:
|
| Fig. 2. (a) Two photon action cross sections of Lyso-OSC in THF-H2O mixture solvent (water from 10% to 80%). (b) The logarithmic curve fitting of the output fluorescence intensity (Iout) vs. input laser power intensity (Iin) of Lyso-OSC (5.0 μmol/L). | |
To ascertain whether the fluorescence of Lyso-OSC responds exclusively to the changes of solvent polarity, we measured the fluorescence of the probe under different pH and viscosity circumstances (Figs. S7 and S8 in Supporting information). In THF-H2O (1:1) system, fluorescence intensity of Lyso-OSC barely changed when pH changed from 5 to 7. In the methanol-ethylene glycol system, when 100% methanol was gradually changed to 100% ethylene glycol, the viscosity of the system increased from 0.6 cp to 100 cp but the polarity retained. During this process, only a tiny change in the fluorescence intensity of Lyso-OSC was observed. Therefore, the pH and viscosity insensitivity of Lyso-OSC demonstrate its high selectivity to polarity changes. On this basis, we used Lyso-OSC as probe to detect the polarity changes in cellular microenvironment.
To assess the biocompatibility of Lyso-OSC, we tested its cytotoxicity and lysosomal localization ability. MCF-7, HeLa and CHO cells were used as cell lines in MTT experiments. After 24 h of incubation with 10 μmol/L of Lyso-OSC, more than 90% of the cells remained healthy (Fig. S9 in Supporting information), indicating the low cytotoxicity of Lyso-OSC and its potential for living cell probes. In addition, the living cells were co-stained with the commercially available lysosomal localization dye, Lyso Tracker Red (Figs. S10–S12 in Supporting information, see Fig. 3a as an example). In all three types of cells, the fluorescence image of Lyso-OSC overlapped well with the Lyso Tracker Red image with a colocalization correlation coefficient of over 0.9 (0.93 for MCF-7 cells, 0.91 for HeLa cells and 0.94 for CHO cells), demonstrating the good localization capacity of Lyso-OSC in living cells. On the other hand, benefiting from the strong luminescence, three-dimensional fluorescence imaging of mouse liver tissue treated with Lyso-OSC revealed the penetration depth (under two-photon excitation) to be up to 150 μm (Fig. S13 in Supporting information).

|
Download:
|
| Fig. 3. (a) Fluorescence imaging of MCF-7 cells after co-staining with Lyso-OSC (5.0 μmol/L) and Lyso Tracker Red (0.5 μmol/L) for 30 min. (b) Fluorescence imaging of MCF-7 cells after DMSO (10 μmol/L) treatment, λex =820 nm, λem = 490–550 nm. Scale bars: 20 μm. | |
The probing ability of Lyso-OSC to the changes of lysosomal polarity was tested in living MCF-7 and CHO cells (Fig. 3b and Fig. S14 in Supporting information). After 30 min incubation with Lyso-OSC probe, MCF-7 cells were treated by dimethyl sulfoxide (DMSO) to induce a decrease in lysosomal organelle polarity to living cells. Under fluorescence microscopy, we tracked fluorescence intensity changes of MCF-7 cells over 1 h. As shown in Fig. 3b, the fluorescence intensity of MCF-7 cells significantly enhanced after DMSO treatment. This phenomenon was also observed in CHO cells (Fig. S15 in Supporting information). The high sensitivity of Lyso-OSC to detect intracellular lysosomal polarity encouraged us to further detect cellular autophagy process with Lyso-OSC.
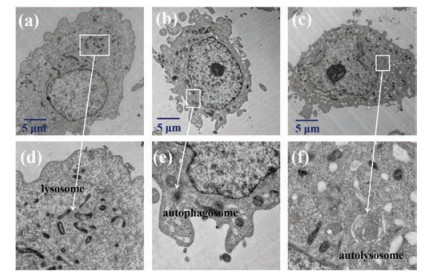
Hank's Balanced Salt Solution (HBSS) lacking of nutrient was used to induce the autophagy of cells [29]. After treating MCF-7 cells with HBSS solution, TEM was used to monitor the changes of cellular lysosomes at subcellular level during the process of autophagy. In Fig. 4, the morphology of normal lysosomes and cytoplasm of MCF-7 cells can be seen clearly in a nutrient-rich solution. However, after 1 h of HBSS treatment, we observed the formation of autophagosomes and the membrane fusion between lysosomes and autophagosomes. Four hours later, a distinct autolysosome filled by small internal vesicles was observed. Similar to our recent studies [22, 30], the observation demonstrated that incubation with nutrient-lacking HBSS solution induced the autophagy of the MCF-7 cells.

|
Download:
|
| Fig. 4. (a–c) Representative electron microscopy images of the cytoplasmic area of MCF-7 cells after starvation for 0 h (a), 1 h (b), and 4 h (c). MCF-7 Cells were incubated with osmium tetroxide prior to TEM experiments. (d), (e), and (f) are the magnified views of the regions in (a), (b), and (c), respectively. | |
With the established cellular autophagy system in hand, we used Lyso-OSC probe to study the changes of lysosome polarity before and after autophagy. Given the high brightness of Lyso-OSC, MCF-7 cells were treated with 5 μmol/L of Lyso-OSC. As shown in Fig. S16 (Supporting information), Lyso-OSC probe were regularly distributed within MCF-7 cells prior to HBSS treatment. From the fluorescence images of Lyso-OSC, we clearly observed the intracellular distribution of normal lysosomes. After treating MCF-7 cells with nutrient-lacking HBSS solution, autophagy occurred with a critical decrease in the fluorescence intensity of Lyso-OSC. The phenomenon indicates that membrane fusion between lysosomes and autophagy lysosomes leads to an increase in lysosomal polarity.
We finally carried out cellular experiments to test the in-vitro monitoring ability of Lyso-OSC for autophagy process. After staining with 5 μmol/L of Lyso-OSC, MCF-7 cells were incubated with different cell culture mediums (nutrient-rich, nutrientlacking, and autophagy inhibitor-containing mediums). The two-photon fluorescence microscopy was used to track MCF-7 cells at different time (0–4 h). As shown in Fig. 5, in nutrient-rich medium, the fluorescence intensity of MCF-7 maintained within 4 h, indicating the high photostability of Lyso-OSC. By contrast, the fluorescence intensity of the starved MCF-7 reduced by ~60% after 4 h, demonstrating the occurrence of autophagy. In 3-methyladenine (3-MA, an autophagy inhibitor) containing HBSS solution, the fluorescence intensity of MCF-7 cells was maintained, due to the efficient suppression of the autophagy of MCF-7 cells. The above results verified the applicability of Lyso-OSC to sensitively monitor autophagy process in living cells.

|
Download:
|
| Fig. 5. (a) Real-time confocal fluorescence imaging of MCF-7 cells under richnutrient (control), starvation (autophagy), and starvation + 3-MA (autophagy inhibitor), respectively. Before fluorescence microscopy, MCF-7 cells were treated with Lyso-OSC (5.0 μmol/L). (b) Real-time monitoring the fluorescence intensity ratio (I/I0) of Lyso-OSC (5.0 μmol/L) of MCF-7 cells under nutrient-rich (B: black line), starvation (D: purple line), and autophagy-inhibited conditions (C: blue line). I represents the intensity of Lyso-OSC at the time of measurement; I0 represents the intensity of Lyso-OSC at the starting point. λex =820 nm, λem = 490-550 nm. Scale bars: 50 μm. | |
Herein, a highly bright two-photon fluorescent probe Lyso-OSC, was developed for highly sensitive real-time detection of autophagy process in living cells. The fluorescence quantum yield of Lyso-OSC shows linear correlation to the polarity of the solvent, and is able to detect the polarity change of cellular environment with high sensitivity. Lyso-OSC can specifically target lysosomes of a variety of cell lines (MCF-7, CHO, and HeLa cells) and monitor the lysosomal polarity change during the autophagy process. Benefiting from the strong fluorescence, Lyso-OSC exhibits a large twophoton absorption cross-section of up to 254 GM, and deep tissue penetration depth of 150 μm. These characteristics will benefit the applications of Lyso-OSC in complex biological circumstances, especially for those cases with auto-fluorescence background.
AcknowledgmentsThis work was supported by the National Natural Science Foundation of China (Nos. 21778001, 21672001), and Open Fund for Discipline Construction in Institute of Physical Science and Information Technology of Anhui University.
Appendix A. Supplementary dataSupplementary material related to this article can befound, in the online version, at doi:https://doi.org/10.1016/j.cclet.2019.07.046.
| [1] |
N. Mizushima, Genes Dev. 21 (2007) 2861-2873. DOI:10.1101/gad.1599207 |
| [2] |
C. Settembre, A. Fraldi, D.L. Medina, A. Ballabio, Nat. Rev. Mol. Cell Biol. 14 (2013) 283-296. DOI:10.1038/nrm3565 |
| [3] |
V. Deretic, T. Saitoh, S. Akira, Nat. Rev. Immunol. 13 (2013) 722-737. DOI:10.1038/nri3532 |
| [4] |
G.K. Alderton, Nat. Rev. Cancer 15 (2015) 513-513. |
| [5] |
R.M. Friedlander, N. Engl. J. Med. 348 (2003) 1365-1375. DOI:10.1056/NEJMra022366 |
| [6] |
G. Mariňo, M. Niso-Santano, E.H. Baehrecke, G. Kroemer, Nat. Rev. Mol. Cell Biol. 15 (2014) 81-94. DOI:10.1038/nrm3735 |
| [7] |
N. Mizushima, B. Levine, A.M. Cuervo, D.J. Klionsky, Nature 451 (2008) 1069-1075. DOI:10.1038/nature06639 |
| [8] |
P.D. Jiang, N. Mizushima, Cell Res. 24 (2014) 69-79. DOI:10.1038/cr.2013.161 |
| [9] |
J.M. Swanlund, K.C. Kregel, T.D. Oberley, Autophagy 6 (2010) 270-277. DOI:10.4161/auto.6.2.10439 |
| [10] |
I. Tanida, N. Minematsu-Ikeguchi, T. Ueno, E. Kominami, Autophagy 1 (2005) 84-91. DOI:10.4161/auto.1.2.1697 |
| [11] |
N. Mizushima, T. Yoshimori, B. Levine, Cell 140 (2010) 313-326. DOI:10.1016/j.cell.2010.01.028 |
| [12] |
Y.X. Lin, S.L. Qiao, Y. Wang, et al., ACS Nano 11 (2017) 1826-1839. DOI:10.1021/acsnano.6b07843 |
| [13] |
Y. Liu, J. Zhou, L.L, et al., J. Am. Chem. Soc. 138 (2016) 12368-12374. DOI:10.1021/jacs.6b04048 |
| [14] |
H.H. He, T.T. He, Z.Q. Zhang, et al., Chin. Chem. Lett. 29 (2018) 1497-1499. DOI:10.1016/j.cclet.2018.08.019 |
| [15] |
Q. Wang, Y. Feng, J. Jiang, et al., Chin. Chem. Lett. 27 (2016) 1563-1566. DOI:10.1016/j.cclet.2016.02.021 |
| [16] |
Z.H. Lei, Z.H. Zeng, X.H. Qian, Y.J. Yang, Chin. Chem. Lett. 28 (2017) 2001-2004. DOI:10.1016/j.cclet.2017.09.023 |
| [17] |
M.L. Wang, D.F. Yue, Q.L. Qiao, L. Miao, Z.C. Xu, Chin. Chem. Lett. 29 (2018) 703-706. DOI:10.1016/j.cclet.2018.03.025 |
| [18] |
S. Leng, Q.L. Qiao, Y. Gao, L. Miao, Z.C. Xu, Chin. Chem. Lett. 28 (2017) 1911-1915. DOI:10.1016/j.cclet.2017.03.034 |
| [19] |
D.F. Yue, M.L. Wang, F. Deng, W.T. Yin, Z.C. Xu, Chin. Chem. Lett. 29 (2018) 648-656. DOI:10.1016/j.cclet.2018.01.046 |
| [20] |
Z.Q. Xu, X.T. Huang, X. Han, et al., Chem 4 (2018) 1609-1628. DOI:10.1016/j.chempr.2018.04.003 |
| [21] |
P. Ning, W.J. Wang, M. Chen, Y. Feng, X.M. Meng, Chin. Chem. Lett. 28 (2017) 1943-1951. DOI:10.1016/j.cclet.2017.09.026 |
| [22] |
J.C. Jiang, X.H. Tian, C.Z. Xu, et al., Chem. Commun. 53 (2017) 3645-3648. DOI:10.1039/C7CC00752C |
| [23] |
Z.J. Guo, S. Park, J.Y. Yoon, I. Shin, Chem. Soc. Rev. 43 (2014) 16-29. DOI:10.1039/C3CS60271K |
| [24] |
H.M. Kim, B.R. Cho, Chem. Rev. 115 (2015) 5014-5055. DOI:10.1021/cr5004425 |
| [25] |
D. Wu, A.C. Sedgwick, T. Gunnlaugsson, et al., Chem. Soc. Rev. 46 (2017) 7105-7123. DOI:10.1039/C7CS00240H |
| [26] |
H.W. Liu, L.L. Chen, C.Y. Xu, et al., Chem. Soc. Rev. 47 (2018) 7140-7180. DOI:10.1039/C7CS00862G |
| [27] |
A.S. Klymchenko, Acc. Chem. Res. 50 (2017) 366-375. DOI:10.1021/acs.accounts.6b00517 |
| [28] |
A. Niemann, A. Takatsuki, H.P. Elssser, J. Histochem. Cytochem. 48 (2000) 251-258. DOI:10.1177/002215540004800210 |
| [29] |
B. Levine, G. Kroemer, Cell 132 (2008) 27-42. DOI:10.1016/j.cell.2007.12.018 |
| [30] |
L.L. Hou, P. Ning, Y. Feng, et al., Anal. Chem. 90 (2018) 7122-7126. DOI:10.1021/acs.analchem.8b01631 |