 2020, Vol. 31


b School of Pharmaceutical Sciences, Capital Medical University, Beijing 100069, China
As an important amino acid, Arg participates in the synthesis of many materials such as agmatine, cretine, and has a significant part in many life activities, such as cell division and wound healing [1, 2]. Consequently, high-sensitivity, high-selectivity detection of Arg has long attracted the attention of scientists. Selective detection of a specific amino acid without interference from other amino acids, however, remains a great challenge, and only a few fluorescent probes are available for Arg detection [3-7].
Nevertheless, due to their many advantages such as simplicity, high sensitivity, and capacity for in vivo, in situ, real-time monitoring, fluorescent probes have become a comprehensive and sensitive screening tool for medical, environmental, and biological analyses [8-16]. As a result, numerous fluorescent probes have been developed for a variety of species including metal ions [17-22], anions [23-25], pH [26, 27], environmental pollutants [28, 29], and biological molecules, such as glutathione (GSH), cysteine (Cys), and carboxylesterase [30-34].
As it is well known, ratiometric fluorescence detection can eliminate restrictions from various analyte-independent factors and therefore provide superior precision and sensitivity than that with off-on or on-off fluorescent probes. Some methods have been used for the development of ratiometric fluorescent probes, and the synthesized probes have been reported to detect the substrates in various human diseases; however, only two examples of ratiometric fluorescent probes for Arg have been reported [35, 36].
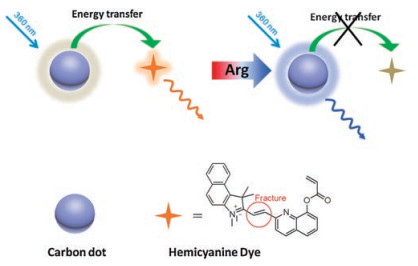
Due to their small size, good photostability, and λex-dependent photoluminescence (PL) emission, carbon nanodots (CDs) as fluorescent probes may potentially exhibit good properties [37-39]. Although there have been several studies on the application of CDs as fluorescent probes/sensors in bioimaging [40-49], there have been no reports of CDs fluorescent probes for Arg (Scheme 1).

|
Download:
|
| Scheme 1. Schematic illustration of the FRET-based ratiometric nanoprobe for Arg synthesized from hemicyanine dye-modified CDs. | |
Previously, we synthesized a hemicyanine-based lysosometargeted near-infrared (NIR) ratiometric fluorescent probe, exhibiting high sensitivity, excellent selectivity and anti-interference against various species [35]. From this work, a mitochondrion-targeted Argsensitive fluorescent compound 1 was synthesized (Scheme S1 in Supporting information) [50]. Amino-and carboxyl-coated CDs were prepared by utilizing citric acid and ethylenediamine [51, 52]. Through the electrostatic attraction between compound 1 and CDs, a FRET-based ratiometric fluorescent probe CDs-1 was constructed toward Arg. Further studies indicated that CDs-1 has low cytotoxicityand can recognize intracellular Arg through ratiometric fluorescence imaging.
Compound 1 was prepared via four steps starting from 8-hydroxy-2-methylquinoline. Compound 4 (yield 47.3%) was obtained by reacting 8-hydroxy-2-methylquinoline and acryloyl chloride for 12 h at room temperature. Product 3 (yield 71.6%) was given by oxidizing compound 4 with SeO2 at 101 ℃. Compound 2 (yield 52.6%) was given from the reaction of 1, 1, 2-trimethylbenzo-[e]indolenine and CH3I. Compound 1 was obtained in a yield of 43.3% by the Knoevenagel condensation reaction of compound 3 with compound 2.
Compounds 2 (0.7025 g, 2.0 mmol) and 3 (0.5542 g, 2.0 mmol), and 15 mL ethanol were mixed and refluxed at 78 ℃ for 12 h. After cooled to 20 ℃, the product 1 was obtained as brown solid (0.4854 g, 43.3%) after filtration.
Characterization of 1: HRMS (EI) m/z: Calculated for C29H25N2O2 [M-I], 433.1918; found, 433.1839. 1H NMR (400 MHz, DMSO): δ 8.74 (d, 1H), 8.62 (d, 1H), 8.52 (d, 1H), 8.36 (t, 3H), 8.32 (d, 1H), 8.28 (d, 1H), 8.15 (d, 1H), 8.11 (m, 1H), 7.87 (t, 1H), 7.80 (m, 3H), 6.78 (d, 2H), 6.37 (t, 1H), 4.26 (s, 3H), and 2.05 (s, 6H). 13C NMR (100 MHz, DMSO): δ 164.85, 152.04, 148.59, 147.77, 138.48, 131.62, 130.54, 129.09, 128.17, 128.14, 126.62, 125.25, 123.97, 123.06, 117.11, 114.01, 54.73, 36.00, and 25.09.
The fluorescent CDs were prepared using a hydrothermal method [53-58]. Fig. S1 (Supporting information) presents the TEM image of the CDs. The diameter of the CDs was about 4.19 ± 0.25 nm (Fig. S2 in Supporting information). XPS was employed to examine the surface states and compositions of CDs [59, 60]. As can be seen in Fig. S3 (Supporting information), the representative XPS peaks at 285.76, 398.60, and 528.03 eV correspond to the elements of C 1s, N 1s, and O 1s, respectively. For the high-resolution C 1s region (Fig. S4 in Supporting information), there are five peaks observed at 284.6, 285.0, 286.7, 288.0 and 289.0 eV, which are attributed to the C—C, C–N, C–O, C=O and O-C=O groups, respectively. And three peaks are emerged at 399.0, 400.1 and 400.9 eV (Fig. S5 in Supporting information), which are attributed to the N—H, C–N and graphite N groups, respectively. The O 1s spectrum shows two peaks at 531.3 and 532.9 eV, which are assigned to the C=O and C—OH/C—O—C groups, respectively (Fig. S6 in Supporting information). By comparing the FTIR spectrum of the CDs, organic molecule 1, and CDs-1 (Fig. S7 in Supporting information), it is obvious that the CDs-1 was successfully assembled. The zeta potentials of the CDs and the hybrid nanoprobe CDs-1 were also measured (Fig. S8 in Supporting information). The increase in the zeta potential of the CDs from -1.57 mV to 0.35 mV can be ascribed to the decreasing surface electricity of the CDs after its assembly with compound 1.
Compound 1 was synthesized according to Scheme S1. 1H NMR, 13C NMR and HR-MS confirmed the molecular structure of compound 1. The CDs were prepared using a hydrothermal method, and the nanoprobe CDs-1 was obtained by interaction between the CDs and compound 1. The CDs were characterized by TEM, diameter distribution, XPS, FTIR, and zeta potential measurements.
UV-vis and fluorescence experiments (Figs. S9 and S10 in Supporting information) were conducted in a solution of 1 with 0.1 mol/L Arg (Vwater/VDMSO = 100/1, 3.0 × 10⁻⁵ mol/L). The absorption peaks at 283, 375 and 436 nm in the UV–vis spectrum decreased upon addition of 3.0 × 10⁻⁴ mol/L Arg (Fig. S9). Fig. S10 demonstrates the emission spectral change of compound 1 before and after addition of Arg. With excitation at 360 nm and addition of Arg, the emission intensity at 607 nm disappeared, which may be due to the reaction between compound 1 and Arg.
As illustrated in Fig. S11 (Supporting information), an emission peak at 440 nm appeared in the fluorescence spectrum of 0.67 μg/mL CDs water solution. After addition of 3.0 × 10⁻⁴ mol/L Arg, no obvious emission spectral changes were observed in the fluorescence spectrum of CDs; indicating Arg does not induce fluorescence changes in CDs.
Changes in the absorption and fluorescence spectra were monitored prior to the preparation of hybrid nanoprobes to investigate the interaction between CDs and compound 1 in the hybrid system. As shown in Fig. S12 (Supporting information), there was an overlap between the absorption spectrum of compound 1 (black line in Fig. S12) and the PL spectrum of CDs (green line), which highly suggests that energy transfer from CDs to compound 1 may occur. However, after the addition of Arg, no energy transfer took place because no absorption was found in the absorption spectrum of compound 1 (red line in Fig. S12). Along with Fig. S10, a 360 nm laser can be used to excite the CDs in the hybrid probe. With excitation at 360 nm, compound 1 can absorb the emission of CDs, and a very strong emission peak was exhibited by the nanohybrid system at 607 nm, whereas a very weak emission peak was exhibited at 440 nm. After addition of Arg, no emission at 607 nm was observed and a strong emission at 440 nm was detected. Therefore, a mixture solution containing CDs (0.67 μg/mL) and compound 1 (3.0 × 10⁻⁵ mol/L) was prepared.
In the following experiments, awater-DMSO solution (100:1, v/v) of nanoprobe CDs-1 (0.67 μg/mL CDs and 3.0 × 10⁻⁵ mol/L compound 1) and a 0.1 mol/L water solution of Arg were used. The absorption peaks at 374 and 434 nm in the UV–vis spectrum gradually decreased upon addition of Arg (Fig. S13 in Supporting information). Three clear isosbestic points were observed at 277, 304, and 335 nm, indicating that only one product was generated from the reaction of nanoprobe CDs-1 with Arg. As evidenced by Fig. S14 (Supporting information), the solution color, originally yellow, became colorless in the presence of different Arg concentrations. Upon 360 nm excitation and gradual addition of Arg, the characteristic emission band of cyanine centered at 607 nm decreased with the emission intensity at 440 nm increasing significantly (Fig. 1a). As demonstrated in Fig. 1b, the fluorescence colorofnanoprobeCDs solution changedfromorange toblue, which is consistent with the fluorescence spectral change. Fig. 1c suggests a good linear relationship between the ratio of I440/I607 to Arg concentration, ranging from 6.0 × 10⁻⁵ mol/L to 2.7 × 10⁻⁴ mol/L; implying Arg can be quantitatively detected in awide concentration range via ratiometric fluorescence method. From the linear calibration graph of the fluorescence titration experiment (Fig. 1c) and based on the signal-to-noise ratio (S/N) = 3 [32], the detection limit of nanoprobe CDs-1 for Arg was determined to be about 6.5 ×10⁻⁸ mol/L, which was sufficiently low for Arg detection. Therefore, it can be concluded that an effective ratiometric fluorescent Arg-probe CDs-1 was made herein with a minimum LOD comparable to those obtained from other methods (Table S1 in Supporting information).

|
Download:
|
| Fig. 1. (a) Emission spectral change of nanoprobe CDs-1 (0.67 μg/mL CDs and 3.0 × 10⁻⁵ mol/L compound 1) in water-DMSO solution (100:1, v/v) upon titration of Arg water solution (0–10.0 equiv. to 1) under 360 nm excitation. Reaction time was 12 min. (b) Photographs of hybrid nanoprobe CDs-1 (0.67 μg/mL CDs and 3.0 × 10⁻⁵ mol/L compound 1) in water-DMSO solution (100:1, v/v) with different concentrations of Arg (from left to right: 0, 3, 6, 9, 12, 15, 18, 21, 24, 27 (× 10-5 mol/L)) upon 365 nm excitation. (c) Arg titration curve plotted by the ratiometric emission spectra of CDs-1 as linear function of Arg concentration. (d) Fluorescence change of CDs-1 (0.67 μg/mL CDs and 3.0 × 10⁻⁵ mol/L compound 1) in water-DMSO solution (100:1, v/v) before and after the addition of Arg with varying pH. | |
Although the influence of pH on Arg detection has hardly been reported previously, the pH of the solution was determined to be critical in the reaction between CDs-1 and Arg. Here, the fluorescence of CDs-1 (0.67 μg/mL CDs and 3.0 × 10⁻⁵ mol/L compound 1) in water-DMSO solution (100:1, v/v) in the absence and presence of 3.0 × 10⁻⁴ mol/L Arg was tested in the pH range of 5.0 -11.0. From Fig. 1d, we can see the CDs-1 itself was stable and its emission spectrum remained unchanged in the pH range of 5.0 -11.0. However, a great fluorescence change was found in the pH range of 5.0–11.0 upon addition of Arg. The fluorescence change of CDs-1 to Arg peaked at about 6.0 and became almost constant in the pH range of 6.0–11.0. Such results imply that Arg can be detected by CDs-1 in a broad pH range.
Mass spectrometry was used to study the recognition mechanism. Since CDs cannot react with Arg, compound 1 was selected to reactwith Arg. A peak at 433.1839 corresponding to the species [1-I] was found for compound 1 only. After reactionwith Arg, the peak at 433.1839 disappeared and a new peak at 224.1438 was detected, which indicated a new compound was formed (Scheme S1).
The selectivity of CDs-1 toward Arg was evaluated by testing various species, including nucleophilic biological species (Thr, Val, Ser, Phe, His, Gly, Pro, IIe, Trp, Ala, Tyr, Glu, Glc, Leu, and H2O2), metal ions (Na+, K+, Mg2+, Ca2+, Mn2+, Ni2+, Cd2+, Cu2+, Pb2+, and Ag+), and anions (Cl-, F-, Br-, I-, N3-, SO42-, ClO3-, S2O32-, SO32-, HS-, CH3COO-, and C2O42-). As shown by the red bars in Figs. S15-S17 (Supporting information), Arg induced a great fluorescence change, whereas, other species did not result in obvious fluorescence change. While most previous literatures have only studied biological molecules in regards to the selectivity of 1, the selectivity of nanoprobe CDs-1 was measured among several different species, from which it was implied that the CDs-1 has excellent selectivity toward Arg and high potential in a complicated practice, such as working in biological surroundings.
The fluorescent response of CDs-1 to Arg was tested in the complicated surroundings mentioned above to further assess its utility as an Arg-selective fluorescent probe (shown by the green bars of Figs. S15-S17). From the results, it is evident that the tested species do not interfere with Arg detection, which indicates that the nanoprobe CDs-1 could be an excellent fluorescent probe, possessing strong anti-interference ability towards Arg.
Time-dependent fluorescence change in probes upon addition of Arg has been discussed previously [4, 22]. Reaction kinetics between probe CDs-1 and Arg in different concentrations were also studied. As shown in the time-dependent fluorescence spectra (Fig. S18 in Supporting information), the reaction of CDs-1 and Arg was completed within 45 min. When the concentration of Arg was higher or equal to 1.2 × 10⁻⁴ mol/L, Arg was detected within 3 min. The reaction time was longer compared to our previous work [22], which may be ascribed to the difference in molecular structure and the recognition system.
Fig. S19 (Supporting information) illustrates the photostability experimental results, the emission intensity ratio I440/I607 of the nanoprobe CDs-1 (0.67 μg/mL CDs and 3.0 × 10⁻⁵ mol/L compound 1) in water-DMSO solution (100:1, v/v) hardly changed with increasing irradiation time, indicating excellent photostability. As for the thermal stability experiment (Fig. S20 in Supporting information), the emission intensity ratio I440/I607 of the nanoprobe CDs-1 (0.67 μg/mL CDs and 3.0 × 10⁻⁵ mol/L compound 1) in water-DMSO solution (100:1, v/v) changed significantly (0.60 to 1.28) as the temperature increased from 25 ℃ to 43 ℃, showing its poor thermal stability. In future work, we will focus on improving the thermal stability of the CDs-1.
Living Hela cells were used to investigate the mitochondrion-targeting ability of CDs-1. The cells were co-stained with CDs-1 (0.67 μg/mL CDs and 6.0 × 10⁻⁶ mol/L compound 1, 30 min, 25 ℃) and a commercially available mitochondrion-specific dye (mitochondrion-Tracker) (1.0 × 10⁻⁷ mol/L, 30 min) in culture medium. Imaging results show that the green image for the 1 channel obtained upon 488 nm excitation was almost identical to the red image for the mitochondrion-Tracker channel obtained upon 550 nm excitation (Fig. S21 in Supporting information), suggesting the ability of CDs-1 to target mitochondrion.
MTT assay was used tomeasure the cytotoxicity of the probe CDs-1 and evaluate its potential application in live-cell imagining. When the concentration of CDs was 0.67 μg/mL and the concentration of compound 1 was 7.0 × 10⁻⁶ mol/L, the cellular viability was assessed to be greater than 82% after 4 h, suggesting the probe CDs-1 has low cytotoxicity (Fig. S22 in Supporting information).
A confocal fluorescence microscopy with a 405 nm diode laser was used to investigate the practical applications of CDs-1 in imaging live Hela cells. As shown in Fig. 2, after incubation of Hela cells with CDs-1 (0.67 μg/mL CDs and 6.0 × 10⁻⁶ mol/L compound 1) for 30 min, strong fluorescence was detected at the red (595 ± 25 nm) channel, whereas weak fluorescence was detected at the green (525 ± 25 nm) channel, in the cytoplasm, demonstrating that the CDs-1 had good cell permeability. Following addition of Arg (5.0 × 10⁻⁴ mol/L), an obvious rapid decrease in fluorescence at the red channel and an increase in fluorescence at green channel were rapidly observed, suggesting the reaction of CDs-1 to Arg took place and the intracellular Arg can be detected via ratiometric fluorescence imagining. Bright-field measurements (Fig. S23 in Supporting information) indicated that the cells remained viable before and after treatment with Arg throughout the imaging experiments.

|
Download:
|
| Fig. 2. Confocal microscopy images of HeLa cells after addition of CDs-1 (0.67 μg/mL CDs and 6.0 × 10⁻⁶ mol/L of compound 1) (a, b, c), and after addition of CDs-1 (0.67 μg/mL CDs and 6.0 × 10⁻⁶ mol/L of compound 1) and Arg (5.0 × 10⁻⁴ mol/L) (d, e, f). Excitation wavelengths was 405 nm. Images were collected at 595 ± 25 nm (a and d), and 525 ± 25 nm (b and e). Ratio images obtained from first and second channels (c and f). | |
In summary, a ratiometric fluorescence hybrid nanoprobe CDs-1 for Arg, which can quantitatively detect Arg concentrations ranging from 6.0 × 10⁻⁵ mol/L to 2.7 × 10⁻⁴ mol/L and has a very low detection limit of 6.5 ×10⁻⁸ mol/L, was fabricated and demonstrated. Further, it could locate mitochondrion and selectively detect intracellular Arg. While the application of the probe CDs-1 is intrinsically limited by its thermal stability, rapid development in organic synthesis and fabrication of hybrid nonmaterial methods can overcome this problem.
AcknowledgmentsWe are grateful to the National Natural Science Foundation of China (Nos. U1704161, U1504203, 21601158) and Zhengzhou University (No. 32210431) for the financial supports.
Appendix A. Supplementary dataSupplementary material related to this article canbefound, in the online version, at doi:https://doi.org/10.1016/j.cclet.2019.07.047.
| [1] |
K. Beezhold, C.A. Byersdorfer, Cancer Lett. 414 (2018) 127-135. DOI:10.1016/j.canlet.2017.11.005 |
| [2] |
A. Mantovani, F. Marchesi, A. Malesci, et al., Nat. Rev. Clin. Oncol. 14 (2017) 399-416. DOI:10.1038/nrclinonc.2016.217 |
| [3] |
Z. Zhang, T. Wei, Y. Chen, et al., Sens. Actuators B: Chem. 255 (2018) 2211-2217. DOI:10.1016/j.snb.2017.09.027 |
| [4] |
T. Liu, N. Li, J.X. Dong, et al., Biosens. Bioelectron. 87 (2017) 772-778. DOI:10.1016/j.bios.2016.08.098 |
| [5] |
W. Lu, Y. Gao, Y. Jiao, et al., Nanoscale 9 (2017) 11545-11552. DOI:10.1039/C7NR02336G |
| [6] |
J.H. Cao, L.P. Ding, W.T. Hu, et al., Langmuir 30 (2014) 15364-15372. DOI:10.1021/la5039798 |
| [7] |
K. Velugula, J.P. Chinta, Biosens. Bioelectron. 87 (2017) 271-277. DOI:10.1016/j.bios.2016.08.023 |
| [8] |
X. Huang, J. Song, B.C. Yung, et al., Chem. Soc. Rev. 47 (2018) 2873-2920. DOI:10.1039/C7CS00612H |
| [9] |
M. Medina-Sanchez, O.G. Schmidt, Nature 545 (2017) 406-408. DOI:10.1038/545406a |
| [10] |
Q. Jia, J. Ge, W. Liu, et al., Adv. Mater. 30 (2018) 1706090-1706100. DOI:10.1002/adma.201706090 |
| [11] |
X. Guo, J. Qua, C. Zhu, et al., Drug Deliv. 25 (2018) 585-599. DOI:10.1080/10717544.2018.1435751 |
| [12] |
R. Kabe, C. Adachi, Nature 550 (2017) 384-387. DOI:10.1038/nature24010 |
| [13] |
S. Long, Q. Qiao, L. Miao, et al., Chin. Chem. Lett. 30 (2019) 573-576. DOI:10.1016/j.cclet.2018.11.031 |
| [14] |
X.K. Chen, D. Kim, J.L. Bredas, Acc. Chem. Res. 51 (2018) 2215-2224. DOI:10.1021/acs.accounts.8b00174 |
| [15] |
B. Li, L. Lu, M. Zhao, et al., Angew. Chem. Int. Ed. 57 (2018) 7483-7487. DOI:10.1002/anie.201801226 |
| [16] |
W. Chen, Y. Pan, J. Chen, et al., Chin. Chem. Lett. 29 (2018) 1429-1435. DOI:10.1016/j.cclet.2018.08.011 |
| [17] |
A. Chevalier, Y. Zhang, O.M. Khdour, et al., J. Am. Chem. Soc. 138 (2016) 12009-12012. DOI:10.1021/jacs.6b06229 |
| [18] |
M. Tomas-Gamasa, M. Martinez-Calvo, et al., Nat. Commun. 7 (2016) 12538-12548. DOI:10.1038/ncomms12538 |
| [19] |
C.M. Ackerman, S. Lee, C.J. Chang, Anal. Chem. 89 (2017) 22-41. DOI:10.1021/acs.analchem.6b04631 |
| [20] |
M. Gao, B.Z. Tang, ACS Sens. 2 (2017) 1382-1399. DOI:10.1021/acssensors.7b00551 |
| [21] |
R. Nosrati, S. Dehghani, B. Karimi, et al., Biosens. Bioelectron. 117 (2018) 1-14. DOI:10.1016/j.bios.2018.05.057 |
| [22] |
J. Li, D. Yim, W.D. Jang, et al., Chem. Soc. Rev. 46 (2017) 2437-2458. DOI:10.1039/C6CS00619A |
| [23] |
J.L. Kolanowski, F. Liu, E.J. New, Chem. Soc. Rev. 47 (2018) 195-208. DOI:10.1039/C7CS00528H |
| [24] |
N. Busschaert, C. Caltagirone, W. van Rossom, et al., Chem. Rev. 115 (2015) 8038-8155. DOI:10.1021/acs.chemrev.5b00099 |
| [25] |
H. Xiong, L. He, Y. Zhang, et al., Chin. Chem. Lett. 30 (2019) 1075-1077. DOI:10.1016/j.cclet.2019.02.008 |
| [26] |
A. Homberg, E. Brun, F. Zinna, et al., Chem. Sci. 9 (2018) 7019-7160. DOI:10.1039/C8SC90179A |
| [27] |
H. Li, H. Dong, M. Yu, et al., Anal. Chem. 89 (2017) 8863-8869. DOI:10.1021/acs.analchem.7b01324 |
| [28] |
Z. Zhou, F. Wang, G. Yang, et al., Anal. Chem. 89 (2017) 11576-11582. DOI:10.1021/acs.analchem.7b02910 |
| [29] |
Z. Li, W. Zhang, C. Liu, et al., Sens. Actuators B: Chem. 241 (2017) 665-671. DOI:10.1016/j.snb.2016.10.141 |
| [30] |
J. Liu, L. Meng, Z. Fei, et al., Biosens. Bioelectron. 90 (2017) 69-74. DOI:10.1016/j.bios.2016.11.046 |
| [31] |
L. Yang, H. Xiong, Y. Su, et al., Chin. Chem. Lett. 30 (2019) 563-565. DOI:10.1016/j.cclet.2018.12.017 |
| [32] |
Y. Wi, H.T. Le, P. Verwilst, et al., Chem. Commun. 54 (2018) 8897-8900. DOI:10.1039/C8CC04846K |
| [33] |
G.X. Yin, T.T. Niu, Y.B. Gan, et al., Angew. Chem. Int. Ed. 57 (2018) 4991-4994. DOI:10.1002/anie.201800485 |
| [34] |
H.W. Liu, L. Chen, C. Xu, et al., Chem. Soc. Rev. 47 (2018) 7140-7180. DOI:10.1039/C7CS00862G |
| [35] |
M. Yu, W. Du, H. Li, et al., Biosens. Bioelectron. 92 (2017) 385-389. DOI:10.1016/j.bios.2016.10.090 |
| [36] |
R.S. Bhosale, G.V. Shitre, R. Kumar, et al., Sens. Actuators B: Chem. 241 (2017) 1270-1275. DOI:10.1016/j.snb.2016.10.002 |
| [37] |
Q. Wang, S. Zhang, Y. Zhong, et al., Anal. Chem. 89 (2017) 1734-1741. DOI:10.1021/acs.analchem.6b03983 |
| [38] |
Y. Wang, J. Xu, L. Lei, et al., Sens. Actuators B: Chem. 264 (2018) 296-303. DOI:10.1016/j.snb.2018.02.183 |
| [39] |
B. Geng, D. Yang, F. Zheng, et al., New J. Chem. 41 (2017) 14444-14451. DOI:10.1039/C7NJ03005C |
| [40] |
D. Liu, S. Feng, G. Feng, Sens. Actuators B: Chem. 269 (2018) 23-29. |
| [41] |
J. Liu, Y. Dong, Y. Ma, et al., Nanoscale 10 (2018) 13589-13598. DOI:10.1039/C8NR04596H |
| [42] |
Y. Zhang, Z. Gao, W. Zhang, et al., Sens. Actuators B: Chem. 262 (2018) 928-937. DOI:10.1016/j.snb.2018.02.079 |
| [43] |
Z. Zhang, Y. Liu, Z. Yan, et al., Sens. Actuators B: Chem. 255 (2018) 986-994. DOI:10.1016/j.snb.2017.08.153 |
| [44] |
F. Yan, Z. Bai, Y. Chen, et al., Sens. Actuators B: Chem. 275 (2018) 86-94. DOI:10.1016/j.snb.2018.08.034 |
| [45] |
J. Wang, R.S. Li, H.Z. Zhang, et al., Biosens. Bioelectron. 97 (2017) 157-163. DOI:10.1016/j.bios.2017.05.035 |
| [46] |
S. Sun, K. Jiang, S. Qian, et al., Anal. Chem. 89 (2017) 5542-5548. DOI:10.1021/acs.analchem.7b00602 |
| [47] |
J. Zhu, S. Sun, K. Jiang, et al., Biosens. Bioelectron. 97 (2017) 150-156. DOI:10.1016/j.bios.2017.05.054 |
| [48] |
G. Gao, Y.W. Jiang, W. Sun, et al., Chin. Chem. Lett. 29 (2018) 1475-1485. DOI:10.1016/j.cclet.2018.07.004 |
| [49] |
G. Gao, Y.W. Jiang, H.R. Jia, et al., Carbon 134 (2018) 232-243. DOI:10.1016/j.carbon.2018.02.063 |
| [50] |
Y. Ban, R. Wang, Y. Li, et al., New J. Chem. 42 (2018) 2030-2035. DOI:10.1039/C7NJ04212D |
| [51] |
Z. An, Z. Li, Y. He, et al., RSC Adv. 7 (2017) 10875-10880. DOI:10.1039/C6RA27844B |
| [52] |
Y. He, Z. Li, Q. Jia, et al., Chin. Chem. Lett. 28 (2017) 1969-1974. DOI:10.1016/j.cclet.2017.07.027 |
| [53] |
X. Wu, Y. Song, X. Yan, et al., Biosens. Bioelectron. 94 (2017) 292-297. DOI:10.1016/j.bios.2017.03.010 |
| [54] |
Z. Li, J. Zhang, Y. Li, et al., Biosens. Bioelectron. 99 (2018) 251-258. DOI:10.1016/j.bios.2017.07.065 |
| [55] |
L. Vallan, E.P. Urriolabeitia, F. Ruiperez, et al., J. Am. Chem. Soc. 140 (2018) 12862-12869. DOI:10.1021/jacs.8b06051 |
| [56] |
D. Shan, J.T. Hsieh, X. Bai, et al., Adv. Healthc. Mater. 7 (2018) 1800532-1800548. DOI:10.1002/adhm.201800532 |
| [57] |
W. Kasprzyk, T. Swiergosz, S. Bednarz, et al., Nanoscale 10 (2018) 13889-13894. DOI:10.1039/C8NR03602K |
| [58] |
G.A.M. Hutton, B.C.M. Martindale, E. Reisner, Chem. Soc. Rev. 46 (2017) 6111-6123. DOI:10.1039/C7CS00235A |
| [59] |
W. Gao, H. Song, X. Wang, et al., ACS Appl. Mater. Inter. 10 (2018) 1147-1154. DOI:10.1021/acsami.7b16991 |
| [60] |
X. Gao, C. Du, et al., J. Phys. Chem. C 4 (2016) 6927-6945. |